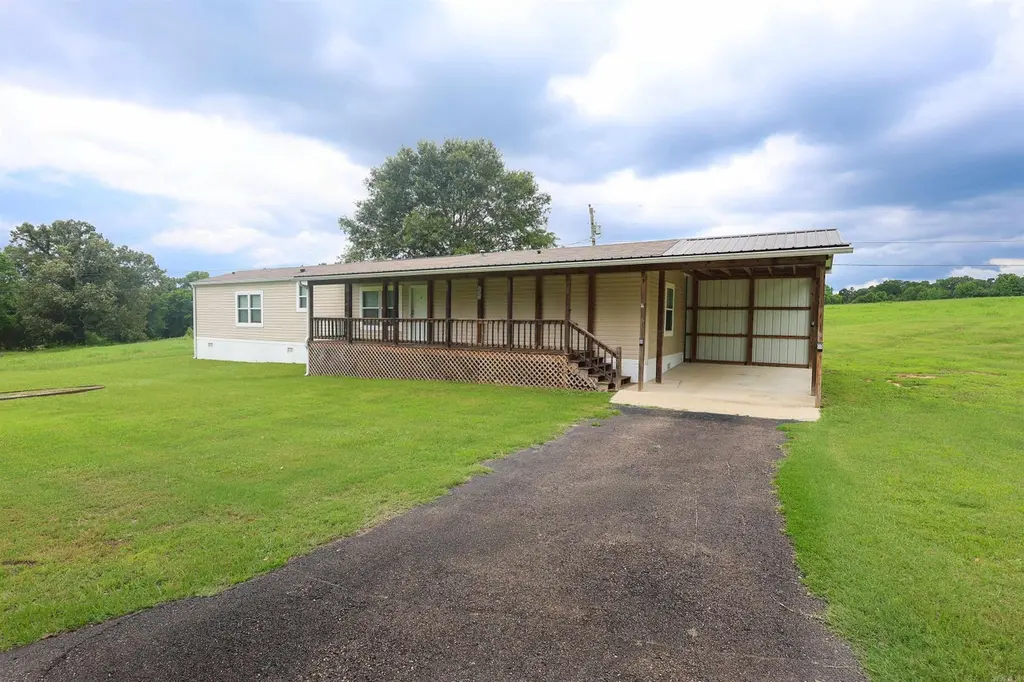
101 Barentine · Kirby, AR
Flood risk 1/10 · Minimal
- FEMA flood zone
- —
- Chance of flooding over 30 yrs
- 0.0%
- Est. flood insurance / yr
- —
Fire risk 5/10 · Moderate
- Est. fire insurance / yr
- $1,499 – $2,785
Heat risk 6/10 · Moderate
- Hot days now (above 110°F)
- 7 days/yr
- Hot days in 30 yrs
- 21 days/yr
Wind risk 4/10 · Minor
- Chance of severe wind over 30 yrs
- 11.0%
Air-quality risk 1/10 · Minimal
- Unhealthy air days now
- 0 days/yr
- Unhealthy air days in 30 yrs
- 0 days/yr
Risk factors via First Street. Map © Google.
Why this score? — see what drove the D- grade
The composite is a weighted blend of 9 inputs, each scored 0–100. Each bar is that input's sub-score; the figure is the points it added to the 100-point composite (weight × sub-score).
- Cash flow +8.0/30.0
- Appreciation +7.9/10.0
- ARV discount +7.5/15.0
- Livability +3.1/5.0
- 1% rule +2.5/10.0
- Rent growth +2.5/5.0
- Schools +2.5/10.0
- Condition / age +2.5/5.0
- DSCR +2.1/10.0
$149,900
🖨 Deal sheet (PDF) 📄 Offer letter ✓ Due diligence
Listing remarks MLS
Enjoy country living with easy access to some of the area's favorite outdoor destinations! This 2019 Clayton 16x80 mobile home offers 3 bedrooms, 2 bathrooms, and approximately 1,280 square feet of comfortable living space on 0.75± acres. Inside, you'll find a spacious living area featuring a built-in entertainment center and a large kitchen with an island, abundant cabinetry, and plenty of room for gathering. The home also includes a covered front porch, attached one-car carport, and a functional layout designed for everyday living. Outside, enjoy the included 12x16 storage building, above-ground pool, and open yard with room to relax or entertain. Conveniently located just a short drive from both Lake Greeson and the Caddo River, this property offers easy access to boating, fishing, kayaking, swimming, and other outdoor recreation. Whether you're looking for a full-time residence, weekend getaway, or an investment property, this home has plenty to offer. With its proximity to two popular recreational destinations, it could also make an excellent nightly rental opportunity for those looking to generate income while enjoying the benefits of ownership. Property will require a survey.
Key facts
- Covered front porch
- Above-ground pool
- 0.75 acre lot
Tags
Property features AI
Finance
- Other: Approximately 0.75 acre lot (seller disclosure)
Exterior
- Parking: Carport for 1 car
- Utilities: Septic system; Public water; Electric via cooperative; Propane/butane gas; Insulated windows; Insulated doors
- Home design: Single wide mobile home; Metal/vinyl siding; Composition roof; Not permanent foundation; Approximately 1,280 total living area; Facing information not provided
- Construction: Metal/Vinyl siding construction; Composition roof; Not permanent foundation
- Exterior features: Porch; Outside storage area; Under pinning; Paved road access; Level, rural setting not in a subdivision
Interior
- Kitchen: Free-standing stove; Dishwasher; Pantry; Refrigerator stays
- Flooring: Laminate flooring
- Bathrooms: 2 full bathrooms
- Heating & cooling: Central electric heat; Central electric cooling
- Interior features: Washer connection; Electric dryer connection; Electric water heater; Walk-in closet(s); Ceiling fan(s)
- Laundry & utility: Laundry room
Neighborhood map
What this means for you Summary
Snapshot
- This is a 3-bed/2.0-bath manufactured listed at $150k.
Deal economics
- At list price, monthly cash flow is $-151 ($-2k/yr) — negative.
- To cash-flow at today's rent, offer at most $128k (14.6% below list).
- To meet the 1% rule (rent ≥ 1% of price), the offer needs to be $112k (25.3% below list).
- Recommended offer: $112k (25.3% below list) — sets the bar for 1% rule.
Location & tenants
- Location reads 61/100 on livability (#233 in AR) — a middle-class / working-renter tenant base. Strengths: cost of living A+, housing A+, employment A-; Watch: health & safety D+, schools F, crime F.
- Kirby School District (rural): math 32% / reading 29% proficiency, ranked #153 of 238 in AR (top 64%) — families likely to look elsewhere, expect single-tenant / working-renter base with shorter leases.
- Market conditions: 35 active listings in the ZIP.
Forward outlook
- In year one you build about $10k of equity ($1k loan paydown + $9k appreciation (5.8% local appreciation)).
- Pike County population projected at -26% by 2050 — secular population decline; favor cash flow + early exit over multi-decade hold.
- By year 4, paydown + projected appreciation supports a ~$33k cash-out refi (75% LTV) — recoverable capital for the next deal without selling this one.
Negotiation context
- It's been on market 15 days — a 2% lower offer ($148k) is reasonable based on typical stale-listing flexibility.
- 2 sale attempts with the ask held roughly flat each time — persistent listings suggest the price (not the market) is what's stuck; bring a comps-based counter.
Risks & watch-outs
- Climate carrying-cost: moderate wildfire risk; extreme-heat days projected 7→21/yr by 2055 (HVAC capex compounding) — expect insurance premiums to compound above CPI over the hold.
Questions for the listing agent
- What do current leases actually rent for vs. the listed asking? Can we see a recent rent roll and the last 12 months of T-12 income?
- Is there a deadline driving the sale (1031 exchange, divorce, estate, relocation)? That informs how much negotiation room exists.
- Schools are F-rated, which usually means shorter tenancies and higher turnover. Who's the typical renter profile here, and what's been the actual vacancy rate?
- Crime grade is F in this area — have there been break-ins, vandalism, or insurance claims at this property in the last 3 years? What carrier currently insures it and at what premium?
- The area grade is low — what's the realistic commute time and amenity access for the typical tenant pool here? Any planned neighborhood developments (good or bad) we should know about?
- What's the average days-on-market for RENTAL listings here right now (not sales)? A rising rental-DOM trend means longer vacancies and softer asking-rent achievability than the comps imply.
- What's the recent tenant-quality profile in this submarket — average credit score on applications, eviction rate, late-payment / NSF rate, and stable-employment percentage? A property-management company in the area should have these aggregated.
- How much new for-sale + rental construction is in the pipeline within 1–3 miles? Heavy new supply typically softens prices + rents 12–24 months out; constrained supply supports both.
Investment metrics
- 1% rule
- 0.75% ✗
- Cap rate
- 5.08%
- Cash-on-cash
- -4.31%
- DSCR
- 0.81
- GRM
- 11.2
CMA / ARV
No comps found within radius.
Projected returns pro-forma
5.85% appreciation · 3.0% rent growth · sell at horizon
- IRR
- 11.5%
- Equity multiple
- 1.77×
- Total profit
- $32,385
- Equity at exit
- $92,850
- IRR
- 12.4%
- Equity multiple
- 3.46×
- Total profit
- $103,170
- Equity at exit
- $167,197
Cash invested: $41,972 (down + closing). Projections, not guarantees.
Landlord ↔ Tenant lean methodology
- Overall (STATE)
- 92 Strongly Landlord-Friendly
- State Arkansas
- 92 Strongly Landlord-Friendly · R+14
- County
- — inherits STATE
- City
- — inherits STATE
ZIP-level market 71921
- Home prices YoY
- 2.0%
- Active inventory
- 35
- Price-to-rent
- 11.2×
Monthly cashflow live
- Estimated rent
- $1,120 medium interval (Pro) →
- Mortgage (P&I)
- −$786
- Tax est. 1.5%
- −$187 /mo · $2,248/yr
- Insurance
- −$62
- HOA
- −$0
- Vacancy / Maint / Mgmt
- −$235
- Net cashflow
- $-151
Break-even live
Sensitivity live
| Price | -10% $-47 | -5% $-99 | +0% $-151 | +5% $-203 | +10% $-254 |
|---|---|---|---|---|---|
| Rent | -10% $-239 | -5% $-195 | +0% $-151 | +5% $-107 | +10% $-62 |
| Rate | -1.0pp $-75 | -0.5pp $-113 | base $-151 | +0.5pp $-190 | +1.0pp $-229 |
UW: 25.0% down · 7.5% · 30yr · 1.5% tax · 5.0% vac · 8.0% maint · 8.0% mgmt
Financing live
Cash to close
- Down payment
- $37,475
- Closing costs
- $4,497
- Reserves months
- —
- Total cash needed
- —
Loan-product check · same deal, 3 products live
Conventional
25% down · 7.5% · 30yr
- Down + closing
- —
- Monthly P&I
- —
- Monthly cashflow
- —
- DSCR
- —
- Eligible?
- —
Personal DTI + credit; lowest rate.
DSCR
20% down · 8.5% · 30yr
- Down + closing
- —
- Monthly P&I
- —
- Monthly cashflow
- —
- DSCR
- —
- Eligible?
- —
No personal income docs; deal must DSCR.
Hard money
10% down · 12.0% · 12mo
- Down + closing
- —
- Monthly P&I
- —
- Monthly cashflow
- —
- DSCR
- —
- Eligible?
- —
Short-term bridge; refi at stabilization.
Listing history 12 events
-
2026-06-19days on market $149,900 Active 15 DOM
-
2026-06-18days on market $149,900 Active 14 DOM
-
2026-06-17days on market $149,900 Active 13 DOM
-
2026-06-16days on market $149,900 Active 12 DOM
-
2026-06-15days on market $149,900 Active 11 DOM
-
2026-06-14days on market $149,900 Active 9 DOM
-
2026-06-12statusdays on market $149,900 Active 8 DOM
-
2026-06-09days on market $149,900 New Listing 5 DOM
-
2026-06-08days on market $149,900 New Listing 4 DOM
-
2026-06-07days on market $149,900 New Listing 3 DOM
-
2026-06-07remarks 692-char remark
-
2026-06-07$149,900 New Listing 2 DOM
ⓘ Source: listings_history table (triggers on properties + properties_extension) + one-shot
backfill from property_details.listing_events for pre-trigger history.
Climate risk First Street
- Flood 1/10 Low 0% chance over 30 yrs
- Wildfire 5/10 Major
- Heat 6/10 Major 7 d/yr ≥110°F today · 21 d/yr by 30 yrs out
- Wind 4/10 Moderate 11% chance of damaging wind over 30 yrs
- Air quality 1/10 Low 0 unhealthy d/yr today · 0 by 30 yrs out
Nearby sold comps map
Loading sold comps map…
Walkable amenities ~0.75 mi
Loading nearby amenities…
Taxation est. · year 1
- Rental income
- $13,443
- − Mortgage interest
- −$8,397
- − Property taxes
- −$2,248
- − Insurance
- −$750
- − Repairs & maintenance
- −$1,075
- − Management
- −$1,075
- − Depreciation
- −$4,361
- Taxable loss
- −$4,463
- Est. tax savings @ 24.0%
- +$1,071
- After-tax cash flow
- $-740/yr
For passive investors: Depreciation is non-cash, so a rental often shows a tax loss while cash-flowing — sheltering income. Rental losses are passive: they offset passive income freely, and up to $25,000/yr can offset ordinary (W-2) income if you actively participate and your MAGI is under $100k (phasing out to $0 by $150k); unused losses carry forward. On sale, claimed depreciation is recaptured at up to 25%, and gains may owe capital-gains tax (a 1031 exchange can defer both). Figures are a year-1 estimate at your 24.0% rate — not tax advice; consult a CPA.
Schools (NCES district)
- District
- Kirby School District
- NCES district ID
- 0508490
- Math proficiency
- 32% ▼ -9.00%
- Reading proficiency
- 29% ▼ -9.00%
- Median HH income
- $36,353
- Composite
- 25.33/100
- National rank
- #7479
- State rank
- #153 of 238 in AR
Livability — Kirby
- Score
- 61/100
- State rank
- #233
- US rank
- #17477
Category grades
Schools grade is shown separately in the Schools card above.
Census & demographics
- Census place
- Kirby, AR
- Population (ZIP)
- 3,591
Population outlook (Pike County) Hauer SSP2
- Today (2025)
- 10,158 people
- By 2030
- 9,681 · -4.7%
- By 2040
- 8,640 · -14.9%
- By 2050
- 7,500 · -26.2%
- By 2075
- 4,897 · -51.8%
- By 2100
- 2,911 · -71.3%
Race, ethnicity, and origin ACS 2023
- Neighborhood character
- Predominantly White (89%)
- Race & ethnicity
- White 89% Two or more races 8% Hispanic / Latino 5% Black 1%
- Hispanic origin (detail)
- Mexican 4%
- Common ancestry
- Slovak 2% Lithuanian 2% Italian 1%
- Foreign-born
- 1% · Canada
- Languages at home
- 98% English-only · Spanish 2%
Political lean MEDSL · Pike
- 2024 margin
- Solid R (+73.1) · D 12.8% · R 86.0% · Other 1.2%
- 2008→2024 swing
- -31.8pp toward R · 2008: -41.3pp · 2024: -73.1pp
- All cycles
- 2024: R+73.1 2020: R+67.7 2016: R+62.3 2012: R+52.7 2008: R+41.3
Not yet ingested
- Civics
- —
Market trends
- HPI YoY
- ▲ 5.85%
- Current HPI
- 300.7988
- Rent YoY
- —
- Metro
- —
- State GDP YoY
- ▲ 3.80%
- F500 in state
- 10
Industry mix (Fortune 500 HQ in AR)
| Industry | F500 HQs | Revenue |
|---|---|---|
| Retail | 1 | $681B |
|
||
| Food / Agriculture | 1 | $53B |
|
||
| Retail / Energy | 1 | $22B |
|
||
| Transportation / Logistics | 1 | $12B |
|
||
| Energy | 1 | $4B |
|
||
Price history
+0.0% since first listed2 events — show timeline
- 2026-06-04 Listed $149,900 HSBOR
- 2026-06-04 Listed $149,900 CARMLS
Cash-flow waterfall
monthlySold comps — $/sqft
last 12 mo · ≤1 miLoading sold comps…