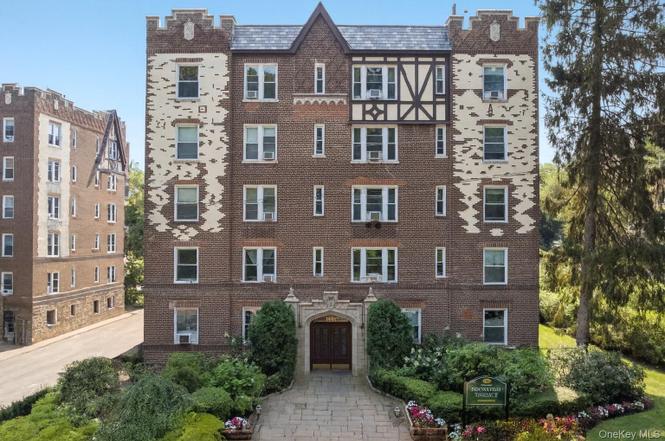
1440 Midland Ave Unit 1D · Yonkers, NY
Flood risk 1/10 · Minimal
- FEMA flood zone
- X (unshaded)
- Chance of flooding over 30 yrs
- 0.0%
- Est. flood insurance / yr
- $473 – $860
Fire risk 1/10 · Minimal
- Est. fire insurance / yr
- $691 – $1,283
Heat risk 6/10 · Moderate
- Hot days now (above 98°F)
- 7 days/yr
- Hot days in 30 yrs
- 15 days/yr
Wind risk 6/10 · Moderate
- Chance of severe wind over 30 yrs
- 27.0%
Air-quality risk 5/10 · Moderate
- Unhealthy air days now
- 6 days/yr
- Unhealthy air days in 30 yrs
- 8 days/yr
Risk factors via First Street. Map © Google.
Why this score? — see what drove the D- grade
The composite is a weighted blend of 9 inputs, each scored 0–100. Each bar is that input's sub-score; the figure is the points it added to the 100-point composite (weight × sub-score).
- Cash flow +8.6/30.0
- ARV discount +7.5/15.0
- 1% rule +5.9/10.0
- Schools +4.1/10.0
- Rent growth +3.6/5.0
- Livability +3.4/5.0
- Condition / age +2.5/5.0
- DSCR +2.4/10.0
- Appreciation +0.0/10.0
$299,000
🖨 Deal sheet (PDF) 📄 Offer letter ✓ Due diligence
Listing remarks
Back on Market - Buyer Could not perform. Charming and spacious 2-bedroom, 1-bath ground-level unit located in the well-maintained Bronxville Terrace complex. This home features hardwood floors throughout, a large living room ideal for relaxing or entertaining, an eat-in kitchen with modern appliances, and a dedicated dining area. The two generously sized bedrooms offer comfortable living space, while the windowed full bathroom adds both style and practicality. The complex provides convenient amenities including a laundry room, BBQ and sitting areas, and additional storage. Heating is oil via an above-ground tank. Ideally situated near Fleetwood Metro-North Station, Bee-Line bus routes, Cro
Key facts
- Garage
- Built 1928
- Listed 177 days
Neighborhood map
What this means for you Summary
Snapshot
- This is a 2-bed/1.0-bath condo listed at $299k.
Deal economics
- At list price, monthly cash flow is $-257 ($-3k/yr) — negative.
- The deal already cash-flows at list — no discount required.
- Meets the 1% rule at list price ($3k rent vs $299k).
- Recommended offer: $263k (12.0% below list) — sets the bar for market timing.
Location & tenants
- Location reads 68/100 on livability (#528 in NY) — a middle-class / working-renter tenant base. Strengths: employment A, commute B; Watch: amenities F, cost of living F.
- Yonkers City School District (suburban): math 41% / reading 54% proficiency, ranked #413 of 590 in NY (top 70%) — families likely to look elsewhere, expect single-tenant / working-renter base with shorter leases; 64% free/reduced lunch — lower-income household profile, screen leases tightly.
- Zoned schools: Yonkers Early Childhood Academy (327 students, 72% FRL); Yonkers Middle School (math 17% / reading 37%, grade F, #587 of 729 statewide, top 81%, 601 students, 88% FRL); Yonkers High School (math 92% / reading 88%, grade A+, #238 of 1,100 statewide, top 23%, 1,060 students, 76% FRL) — zoned schools average 79% FRL vs 64% district-wide (15 pts higher); higher-poverty schools than district average — tighter screening recommended.
- Market conditions: Rents rising fast (+4.3%/yr); 245 active listings in the ZIP; 31 comparable units currently listed for rent nearby; rentals at typical pace (median 25d on market — plan ~3-4 weeks tenant-placement turnaround); high-income renter base; 954 units permitted in Westchester County in 2024 (649 in 5+ unit buildings).
- This rent runs 31% of the median local income ($126k/yr) — at the standard rent-burdened threshold; future hikes will face affordability resistance.
Forward outlook
- Local home prices are declining (-3.0%/yr); year-one equity from $2k of loan paydown is wiped out by about $9k of value loss. Plan a longer hold.
- Westchester County population projected at +10% by 2050 — modest demand growth; plan on rents tracking national, not racing it.
Negotiation context
- It's been on market 177 days — a 12% lower offer ($263k) is reasonable based on typical stale-listing flexibility.
- 10 sale attempts since 14y ago; this cycle's ask has dropped $26k (8%) from the opening price — seller is motivated, your offer sets the floor, not the list.
- Current owner paid $112k; list at $299k implies a 166% gain — meaningful room to come down on a strong offer.
Risks & watch-outs
- Watch-outs: HOA is 24% of rent; built in 1928 — expect roof / HVAC / electrical / plumbing capex.
- Climate carrying-cost: major wind risk, 27% chance of damaging wind over 30y; extreme-heat days projected 7→15/yr by 2055 (HVAC capex compounding) — expect insurance premiums to compound above CPI over the hold.
Questions for the listing agent
- What do current leases actually rent for vs. the listed asking? Can we see a recent rent roll and the last 12 months of T-12 income?
- It's been on market 177 days. Have you received any prior offers? Is the seller open to a 12% concession, seller financing, or rate buy-down credit?
- Built in 1928 — when were the roof, HVAC, electrical panel, plumbing, and water heater last replaced?
- What does the HOA fee cover, when was the last increase, and are there any pending special assessments or reserve-fund shortfalls?
- Any open or pending special assessments — roof, HVAC, plumbing, elevator, façade? What's the per-unit balance and payoff schedule, and is the seller paying it off at close or rolling it to the buyer?
- Why hasn't it sold? Are there any deal-killer items the seller is aware of (foundation, flood, title, zoning, code violations)?
- Is there a deadline driving the sale (1031 exchange, divorce, estate, relocation)? That informs how much negotiation room exists.
- The area grade is low — what's the realistic commute time and amenity access for the typical tenant pool here? Any planned neighborhood developments (good or bad) we should know about?
- What's the average days-on-market for RENTAL listings here right now (not sales)? A rising rental-DOM trend means longer vacancies and softer asking-rent achievability than the comps imply.
- What's the recent tenant-quality profile in this submarket — average credit score on applications, eviction rate, late-payment / NSF rate, and stable-employment percentage? A property-management company in the area should have these aggregated.
- How much new apartment / multifamily construction is in the pipeline within 1–3 miles? Heavy new supply (>2% of stock underway) typically softens rents 12–24 months out; light construction supports rent growth.
Investment metrics
- 1% rule
- 1.09% ✓
- Cap rate
- 5.26%
- Cash-on-cash
- -3.69%
- DSCR
- 0.84
- GRM
- 7.6
CMA / ARV
No comps found within radius.
Projected returns pro-forma
-3.0% appreciation · 4.27% rent growth · sell at horizon
- IRR
- -20.3%
- Equity multiple
- 0.28×
- Total profit
- $-60,085
- Equity at exit
- $44,582
- IRR
- -9.6%
- Equity multiple
- 0.36×
- Total profit
- $-53,470
- Equity at exit
- $25,852
Cash invested: $83,720 (down + closing). Projections, not guarantees.
Landlord ↔ Tenant lean methodology
- Overall (CITY)
- 5 Strongly Tenant-Friendly
- State New York
- 15 Strongly Tenant-Friendly · D+10
- County
- — inherits STATE
- City Yonkers
- 5 Strongly Tenant-Friendly · D+20
ZIP-level market 10708
- Rents YoY
- 4.3%
- Active inventory
- 245
- Price-to-rent
- 7.6×
Monthly cashflow live
- Estimated rent
- $3,271 high interval (Pro) →
- Mortgage (P&I)
- −$1,568
- Tax est. 1.5%
- −$374 /mo · $4,485/yr
- Insurance
- −$125
- HOA est. from 1 same-building comp
- −$775
- Vacancy / Maint / Mgmt
- −$687
- Net cashflow
- $-257
Break-even live
Sensitivity live
| Price | -10% $-51 | -5% $-154 | +0% $-257 | +5% $-361 | +10% $-464 |
|---|---|---|---|---|---|
| Rent | -10% $-516 | -5% $-387 | +0% $-257 | +5% $-128 | +10% $1 |
| Rate | -1.0pp $-107 | -0.5pp $-181 | base $-257 | +0.5pp $-335 | +1.0pp $-414 |
UW: 25.0% down · 7.5% · 30yr · 1.5% tax · 5.0% vac · 8.0% maint · 8.0% mgmt
Financing live
Cash to close
- Down payment
- $74,750
- Closing costs
- $8,970
- Reserves months
- —
- Total cash needed
- —
Loan-product check · same deal, 3 products live
Conventional
25% down · 7.5% · 30yr
- Down + closing
- —
- Monthly P&I
- —
- Monthly cashflow
- —
- DSCR
- —
- Eligible?
- —
Personal DTI + credit; lowest rate.
DSCR
20% down · 8.5% · 30yr
- Down + closing
- —
- Monthly P&I
- —
- Monthly cashflow
- —
- DSCR
- —
- Eligible?
- —
No personal income docs; deal must DSCR.
Hard money
10% down · 12.0% · 12mo
- Down + closing
- —
- Monthly P&I
- —
- Monthly cashflow
- —
- DSCR
- —
- Eligible?
- —
Short-term bridge; refi at stabilization.
Rent comps 31 comps
| Address | Beds | Baths | Sqft | Rent | $/sqft | DOM | Units | Dist |
|---|---|---|---|---|---|---|---|---|
| 42 Broad St W Mount Vernon, NY | 3.0 | 1.0–2.0 | 1014 | $5,080 | $5.01 | 24d | 15 | 0.27mi |
| 42 Broad St W Mount Vernon, NY | 3.0 | 1.0–2.0 | 955 | $3,199 | $3.35 | 2d | 16 | 0.27mi |
| 26 W Devonia Ave Unit 1 Mt Vernon, NY | 3.0 | 1.5 | 1388 | $4,200 | $3.03 | 12d | 1 | 0.29mi |
| 645 N MacQuesten Pkwy Unit 3G Mt Vernon, NY | 2.0 | 1.0 | 950 | $3,195 | $3.36 | 25d | 1 | 0.29mi |
| 33 William St Mount Vernon, NY | 1.0–2.0 | 1.0 | 725 | $2,675 | $3.69 | 22d | 2 | 0.44mi |
| 671 Bronx River Rd Unit 3A Yonkers, NY | 2.0 | 1.5 | 950 | $3,000 | $3.16 | 25d | 1 | 0.54mi |
| 51 Parkway Rd Apt 3 Bronxville, NY | 1.0 | 1.0 | 1100 | $3,100 | $2.82 | 25d | 1 | 0.69mi |
| 28 Tunis Ave Unit 2 Yonkers, NY | 2.0 | 1.0 | 900 | $3,000 | $3.33 | 44d | 1 | 0.71mi |
| 12 Putnam St Mount Vernon, NY | 2.0 | 1.0 | 950 | $2,600 | $2.74 | 25d | 1 | 0.74mi |
| 305 N Terrace Ave Mount Vernon, NY | 2.0 | 1.0 | 1800 | $3,200 | $1.78 | 25d | 1 | 0.82mi |
| 230 N 7th Ave Unit 2 Mt Vernon, NY | 1.0 | 1.0 | 950 | $2,300 | $2.42 | 10d | 1 | 0.83mi |
| 173 Crary Ave Mount Vernon, NY | 3.0 | 2.0 | 1100 | $3,100 | $2.82 | 25d | 1 | 0.88mi |
| 86 Edgewood Ave Unit 2W Yonkers, NY | 2.0 | 1.0 | 1000 | $2,699 | $2.70 | 44d | 1 | 0.90mi |
| 86 Edgewood Ave Apt 2E Yonkers, NY | 2.0 | 1.0 | 1000 | $2,599 | $2.60 | 19d | 1 | 0.90mi |
| 6 Belden Ave Unit 1 Yonkers, NY | 3.0 | 2.0 | 1450 | $3,500 | $2.41 | 25d | 1 | 0.91mi |
| 14 Elm St Unit 2 Mt Vernon, NY | 2.0 | 1.0 | 1000 | $2,800 | $2.80 | 25d | 1 | 0.99mi |
| 495 Kimball Ave Unit First Floor Yonkers, NY | 2.0 | 1.0 | 1100 | $3,000 | $2.73 | 44d | 1 | 1.07mi |
| 148 Claremont Ave Mount Vernon, NY | 2.0 | 1.0 | 960 | $2,400 | $2.50 | 19d | 1 | 1.11mi |
| 355 Bronxville Rd Bronxville, NY | 3.0 | 2.0 | 968 | $3,400 | $3.51 | 25d | 1 | 1.17mi |
| 142 Trenchard St Unit 2E Yonkers, NY | 1.0 | 1.0 | 900 | $2,250 | $2.50 | 11d | 1 | 1.17mi |
| 70 Elm Ave Unit Right Mt Vernon, NY | 3.0 | 2.5 | 1800 | $4,000 | $2.22 | 5d | 1 | 1.27mi |
| 163 Saint Nicholas Ave Yonkers, NY | 3.0 | 1.5 | 1732 | $5,495 | $3.17 | 5d | 1 | 1.31mi |
| 112 N Columbus Ave Unit 2 Mt Vernon, NY | 2.0 | 2.0 | 900 | $2,997 | $3.33 | 19d | 1 | 1.31mi |
| 173 Washington St Unit 1 Mt Vernon, NY | 3.0 | 2.0 | 1100 | $3,000 | $2.73 | 25d | 1 | 1.40mi |
| 173 Washington St Unit 2 Mt Vernon, NY | 3.0 | 2.0 | 1500 | $3,200 | $2.13 | 1d | 1 | 1.40mi |
| 85 Bennett Ave Unit 2 Yonkers, NY | 2.0 | 1.0 | 1000 | $2,500 | $2.50 | 44d | 1 | 1.47mi |
| 433 Palmer Rd Unit Second Fl Yonkers, NY | 3.0 | 1.5 | 1400 | $3,500 | $2.50 | 44d | 1 | 1.48mi |
| 7 Oak Ave Tuckahoe, NY | 2.0 | 1.0 | 1200 | $2,500 | $2.08 | 44d | 1 | 1.48mi |
| 11 Oak Ave Unit 1 Bronxville, NY | 3.0 | 2.0 | 1400 | $4,300 | $3.07 | 44d | 1 | 1.49mi |
| 36 Dunwoodie St Unit 1 Yonkers, NY | 3.0 | 1.0 | 1300 | $3,500 | $2.69 | 44d | 1 | 1.50mi |
| 23 Alida St Unit 2s Yonkers, NY | 2.0 | 1.0 | 1000 | $2,900 | $2.90 | 25d | 1 | 1.50mi |
HOA detail condo
- Monthly dues
- $0 · $0/yr
- Assessments
- None detected in remarks — confirm with the listing agent.
Listing history 26 events
-
2026-03-25status Pending
-
2026-03-03status Active
-
2026-02-22historical
-
2026-02-21status Active
-
2026-01-14status Pending
-
2025-09-03price $299,000
-
2025-08-09$325,000 Active
-
2025-08-07historical $325,000
-
2025-07-22historical
-
2025-05-28$358,888 Active
-
2024-12-01historical
-
2024-10-31price $294,999
-
2024-09-20$299,999 Active
-
2024-09-15historical
-
2024-04-15$299,999 Active
-
2023-11-10$309,999 Active
-
2022-09-17historical
-
2022-04-24$350,000 Active
-
2014-03-15price $112,500
-
2012-12-07soldstatus $112,500 Sold
-
2012-12-07soldstatus $112,500
-
2012-09-22historical Pending
-
2012-09-21price $139,000
-
2012-08-01price $139,000
-
2012-06-29$149,000 Active
-
2012-06-29$139,000
ⓘ Source: listings_history table (triggers on properties + properties_extension) + one-shot
backfill from property_details.listing_events for pre-trigger history.
Climate risk First Street
- Flood 1/10 Low FEMA zone X (unshaded) · 0% chance over 30 yrs
- Wildfire 1/10 Low
- Heat 6/10 Major 7 d/yr ≥98°F today · 15 d/yr by 30 yrs out
- Wind 6/10 Major 27% chance of damaging wind over 30 yrs
- Air quality 5/10 Major 6 unhealthy d/yr today · 8 by 30 yrs out
Nearby sold comps map
Loading sold comps map…
Walkable amenities ~0.75 mi
Loading nearby amenities…
Taxation est. · year 1
- Rental income
- $39,250
- − Mortgage interest
- −$16,749
- − Property taxes
- −$4,485
- − Insurance
- −$1,495
- − Repairs & maintenance
- −$3,140
- − Management
- −$3,140
- − HOA
- −$9,300
- − Depreciation
- −$8,698
- Taxable loss
- −$7,757
- Est. tax savings @ 24.0%
- +$1,862
- After-tax cash flow
- $-1,227/yr
For passive investors: Depreciation is non-cash, so a rental often shows a tax loss while cash-flowing — sheltering income. Rental losses are passive: they offset passive income freely, and up to $25,000/yr can offset ordinary (W-2) income if you actively participate and your MAGI is under $100k (phasing out to $0 by $150k); unused losses carry forward. On sale, claimed depreciation is recaptured at up to 25%, and gains may owe capital-gains tax (a 1031 exchange can defer both). Figures are a year-1 estimate at your 24.0% rate — not tax advice; consult a CPA.
Schools (NCES district)
- District
- Yonkers City School District
- NCES district ID
- 3631920
- Math proficiency
- 41% ▼ -1.00%
- Reading proficiency
- 54% ▲ 14.00%
- Median HH income
- $58,042
- Composite
- 41.43/100
- National rank
- #3471
- State rank
- #413 of 590 in NY
Livability — Yonkers
- Score
- 68/100
- State rank
- #528
- US rank
- #9394
Category grades
Schools grade is shown separately in the Schools card above.
Census & demographics
- Census place
- Yonkers, NY
- County
- Westchester County · 709,332 people
- City population
- 212,407
- Metro
- New York-Newark-Jersey City, NY-NJ-PA
- Population (ZIP)
- 22,482
- Household income
- $126,343
- Rent vs Own
- Severe rent burden
- 357.0
Population outlook (Westchester County) Hauer SSP2
- Today (2025)
- 1,028,035 people
- By 2030
- 1,051,636 · +2.3%
- By 2040
- 1,098,520 · +6.9%
- By 2050
- 1,136,044 · +10.5%
- By 2075
- 1,196,925 · +16.4%
- By 2100
- 1,175,147 · +14.3%
Race, ethnicity, and origin ACS 2023
- Neighborhood character
- Predominantly White (69%)
- Race & ethnicity
- White 69% Hispanic / Latino 17% Two or more races 10% Black 6% Asian 4%
- Hispanic origin (detail)
- Puerto Rican 7% Dominican 3%
- Common ancestry
- Romanian 2% Lithuanian 2% Scotch-Irish 1%
- Foreign-born
- 16% · Canada, China
- Languages at home
- 76% English-only · Spanish 10% Other Indo-European 6% Other Asian/Pacific 2%
Political lean MEDSL · Westchester
- 2024 margin
- Strong D (+26.3) · D 63.1% · R 36.9%
- 2008→2024 swing
- -1.3pp toward R · 2008: 27.6pp · 2024: 26.3pp
- All cycles
- 2024: D+26.3 2020: D+36.3 2016: D+32.8 2012: D+22.2 2008: D+27.6
Not yet ingested
- Civics
- —
Market trends
- HPI YoY
- ▼ -668.11%
- Current HPI
- 203.4295
- Rent YoY
- ▲ 4.27%
- Metro
- New York-Newark-Jersey City, NY-NJ-PA
- State GDP YoY
- ▲ 2.60%
- F500 in state
- 92
Industry mix (Fortune 500 HQ in NY)
| Industry | F500 HQs | Revenue |
|---|---|---|
| Financial Services | 10 | $950B |
|
||
| Consumer Goods | 9 | $162B |
|
||
| Insurance | 4 | $225B |
|
||
| Telecommunications | 2 | $144B |
|
||
| Pharmaceuticals | 2 | $112B |
|
||
| Media / Entertainment | 2 | $69B |
|
||
Price history
+115.1% since first listed26 events — show timeline
- 2026-03-25 Pending — OneKey® MLS as Distributed by MLS Grid
- 2026-03-03 Relisted — OneKey® MLS as Distributed by MLS Grid
- 2026-02-22 Listing Removed — OneKey® MLS as Distributed by MLS Grid
- 2026-02-21 Relisted — OneKey® MLS as Distributed by MLS Grid
- 2026-01-14 Pending — OneKey® MLS as Distributed by MLS Grid
- 2025-09-03 Price Changed $299,000 OneKey® MLS as Distributed by MLS Grid
- 2025-08-09 Listed $325,000 OneKey® MLS as Distributed by MLS Grid
- 2025-08-07 Coming Soon $325,000 OneKey® MLS as Distributed by MLS Grid
- 2025-07-22 Listing Removed — OneKey® MLS as Distributed by MLS Grid
- 2025-05-28 Listed $358,888 OneKey® MLS as Distributed by MLS Grid
- 2024-12-01 Listing Removed — OneKey® MLS as Distributed by MLS Grid
- 2024-10-31 Price Changed $294,999 OneKey® MLS as Distributed by MLS Grid
- 2024-09-20 Listed $299,999 OneKey® MLS as Distributed by MLS Grid
- 2024-09-15 Listing Removed — OneKey® MLS as Distributed by MLS Grid
- 2024-04-15 Listed $299,999 OneKey® MLS as Distributed by MLS Grid
- 2023-11-10 Listed $309,999 OneKey® MLS as Distributed by MLS Grid
- 2022-09-17 Listing Removed — OneKey® MLS as Distributed by MLS Grid
- 2022-04-24 Listed $350,000 OneKey® MLS as Distributed by MLS Grid
- 2014-03-15 Price Changed $112,500 HGMLS
- 2012-12-07 Sold (MLS) $112,500 OneKey® MLS as Distributed by MLS Grid
- 2012-12-07 Sold (MLS) $112,500 HGMLS
- 2012-09-22 Contingent — HGMLS
- 2012-09-21 Price Changed $139,000 HGMLS
- 2012-08-01 Price Changed $139,000 HGMLS
- 2012-06-29 Listed $149,000 HGMLS
- 2012-06-29 Listed $139,000 OneKey® MLS as Distributed by MLS Grid
Cash-flow waterfall
monthlySold comps — $/sqft
last 12 mo · ≤1 miLoading sold comps…