 🏷️ Likely Rental
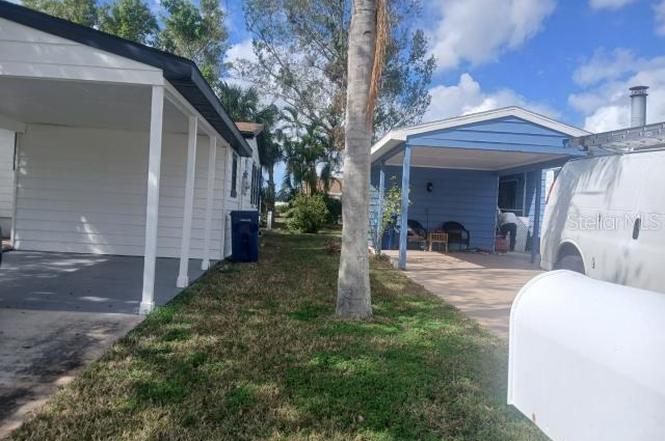
61 Mourningdove Ct · Bradenton, FL
Flood risk 1/10 · Minimal
- FEMA flood zone
- X (unshaded)
- Chance of flooding over 30 yrs
- 0.0%
- Est. flood insurance / yr
- $507 – $1,088
Fire risk 1/10 · Minimal
- Est. fire insurance / yr
- $947 – $1,759
Heat risk 10/10 · Severe
- Hot days now (above 107°F)
- 7 days/yr
- Hot days in 30 yrs
- 30 days/yr
Wind risk 10/10 · Severe
- Chance of severe wind over 30 yrs
- 99.0%
Air-quality risk 3/10 · Minor
- Unhealthy air days now
- 3 days/yr
- Unhealthy air days in 30 yrs
- 3 days/yr
Risk factors via First Street. Map © Google.
Why this score? — see what drove the B+ grade
The composite is a weighted blend of 9 inputs, each scored 0–100. Each bar is that input's sub-score; the figure is the points it added to the 100-point composite (weight × sub-score).
- Cash flow +30.0/30.0
- ARV discount +15.0/15.0
- 1% rule +10.0/10.0
- DSCR +10.0/10.0
- Schools +4.4/10.0
- Livability +4.0/5.0
- Rent growth +2.5/5.0
- Condition / age +2.5/5.0
- Appreciation +0.0/10.0
$130,000
🖨 Deal sheet (PDF) 📄 Offer letter ✓ Due diligence
Listing remarks
This double wide tenant occupied on large cul-de-sac lot in this exciting 55+ robust community. Everything is new!! Spacious living room opens to a large kitchen and dining area that is more than ample space to entertain. All new flooring, paint and remodel of baths and kitchen is just the start of the massive renovation that has been completed. The community offers a pool, clubhouse, fitness area and more. Golf carts and small pets are allowed. 24-hour guard at this lovely, gated community. Great investment opportunity!
Key facts
- Remodel of kitchen
- New flooring
- Large cul-de-sac lot
Tags
Property features AI
Finance
- Other: Total lot about 0.12 acres
- Financial info: Lease restrictions apply
- HOA & community: Ridgewood HOA (association approval required); Quarterly association fee ($95); Monthly HOA equivalent about $31.67; Senior community; Pets allowed with size limit
Exterior
- Parking: Carport (1 space)
- Security: Guard-gated community
- Utilities: Public water; Public sewer; Electricity connected
- Home design: Residential mobile home (double wide); One story; North facing; Entry on main level
- Construction: Vinyl siding; Shingle roof; Slab foundation; Built as a double wide; Living area about 1,176
- Exterior features: Sidewalk; Asphalt road access
Interior
- Kitchen: Dishwasher; Disposal; Range; Refrigerator; Electric water heater
- Bedrooms: 2 bedrooms
- Flooring: Laminate
- Bathrooms: 1 full bathroom
- Heating & cooling: Central heating; Central air conditioning
- Interior features: Ceiling fans
- Laundry & utility: Laundry closet
Neighborhood map
What this means for you Summary
Snapshot
- This is a 2-bed/1.0-bath manufactured listed at $130k.
Deal economics
- At list price, monthly cash flow is $698 ($8k/yr) — positive.
- The deal already cash-flows at list — no discount required.
- Meets the 1% rule at list price ($2k rent vs $130k).
- Recommended offer: $114k (12.0% below list) — sets the bar for market timing.
- Cap rate 12.7% vs local median 3.6% in Bradenton — top-decile yield for the area; either an underpriced asset or a hidden risk that comps aren't pricing in. Stress-test before assuming the spread holds.
Location & tenants
- Location reads 81/100 on livability (#101 in FL, #1,528 nationally) — a professional / high-income tenant draw. Strengths: commute A+, cost of living A+, housing A+; Watch: employment D+, crime D, amenities F.
- Manatee (suburban): math 54% / reading 50% proficiency, ranked #26 of 73 in FL (top 36%) — acceptable for families but not a draw, mixed tenant base, ~2y average lease.
- Zoned schools: Blackburn Elementary School (math 62% / reading 42%, grade C-, #990 of 2,144 statewide, top 48%, 551 students, 78% FRL); Palmetto High School (math 22% / reading 36%, grade F, #456 of 667 statewide, top 68%, 2,100 students, 61% FRL) — zoned schools average 70% FRL vs 51% district-wide (19 pts higher); higher-poverty schools than district average — tighter screening recommended.
- Market conditions: 185 active listings in the ZIP; 12 comparable units currently listed for rent nearby; rentals leasing fast (median 6d on market — plan ~1-2 weeks tenant-placement turnaround); 7,472 units permitted in Manatee County in 2024 (1,782 in 5+ unit buildings).
- This rent runs 38% of the median local income ($64k/yr) — at the standard rent-burdened threshold; future hikes will face affordability resistance.
Forward outlook
- Local home prices are declining (-3.0%/yr); year-one equity from $899 of loan paydown is wiped out by about $4k of value loss. Plan a longer hold.
- Manatee County population projected at +43% by 2050 — long-run rental-demand tailwind backs the buy-and-hold thesis.
- At projected returns (-3.0% appreciation + 3.0% rent growth), your $36k cash investment doubles in ~6 years — after that, you're playing with house money.
Negotiation context
- It's been on market 289 days — a 12% lower offer ($114k) is reasonable based on typical stale-listing flexibility.
- 12 sale attempts since 14y ago; this cycle's ask has dropped $45k (26%) from the opening price — seller is motivated, your offer sets the floor, not the list.
- Current owner paid $58k; list at $130k implies a 122% gain — meaningful room to come down on a strong offer.
Risks & watch-outs
- Climate carrying-cost: severe wind risk, 99% chance of damaging wind over 30y; extreme-heat days projected 7→30/yr by 2055 (HVAC capex compounding) — expect insurance premiums to compound above CPI over the hold.
Questions for the listing agent
- It's been on market 289 days. Have you received any prior offers? Is the seller open to a 12% concession, seller financing, or rate buy-down credit?
- What does the HOA fee cover, when was the last increase, and are there any pending special assessments or reserve-fund shortfalls?
- Why hasn't it sold? Are there any deal-killer items the seller is aware of (foundation, flood, title, zoning, code violations)?
- Is there a deadline driving the sale (1031 exchange, divorce, estate, relocation)? That informs how much negotiation room exists.
- Crime grade is D in this area — have there been break-ins, vandalism, or insurance claims at this property in the last 3 years? What carrier currently insures it and at what premium?
- What's the average days-on-market for RENTAL listings here right now (not sales)? A rising rental-DOM trend means longer vacancies and softer asking-rent achievability than the comps imply.
- What's the recent tenant-quality profile in this submarket — average credit score on applications, eviction rate, late-payment / NSF rate, and stable-employment percentage? A property-management company in the area should have these aggregated.
- How much new for-sale + rental construction is in the pipeline within 1–3 miles? Heavy new supply typically softens prices + rents 12–24 months out; constrained supply supports both.
Investment metrics
- 1% rule
- 1.57% ✓
- Cap rate
- 12.74%
- Cash-on-cash
- 23.03%
- DSCR
- 2.02
- GRM
- 5.3
CMA / ARV
- ARV (on-the-fly)
- $190,512
- Comps found
- 12
Show comp detail 12 sales within ~0.75 mi
| Address | Dist | Beds/Ba | Sqft | Sold | Price | $/sf | Match |
|---|---|---|---|---|---|---|---|
| 20 Wood Owl Ave | 0.17mi | 2/2.0 | 1,176 (0%) | 4mo | $200,000 | $170 | 85 |
| 22 Wood Owl Ave | 0.19mi | 2/2.0 | 1,176 (0%) | 8mo | $190,000 | $162 | 80 |
| 51 Partridge Ave | 0.13mi | 2/2.0 | 1,318 (+12%) | 2mo | $233,000 | $177 | 68 |
| 158 Nightingale Cir | 0.26mi | 2/2.0 | 1,287 (+9%) | 2mo | $185,000 | $144 | 67 |
| 159 Osprey Cir Unit na | 0.20mi | 2/2.0 | 1,296 (+10%) | 4mo | $181,000 | $140 | 66 |
| 121 Mockingbird Ln | 0.14mi | 2/2.0 | 1,012 (-14%) | 3mo | $120,000 | $119 | 64 |
| 77 Spoonbill Ln | 0.12mi | 2/2.0 | 1,352 (+15%) | 2mo | $140,000 | $104 | 63 |
| 112 Eagle Cir | 0.13mi | 2/2.0 | 1,027 (-13%) | 6mo | $179,000 | $174 | 63 |
| 137 Osprey Cir | 0.28mi | 2/2.0 | 1,352 (+15%) | 3mo | $190,000 | $141 | 56 |
| 3108 Terra Siesta Blvd | 0.71mi | 2/2.0 | 1,248 (+6%) | 0mo | $125,000 | $100 | 53 |
| 3522 70th Ave E | 0.62mi | 2/2.0 | 1,266 (+8%) | 4mo | $245,000 | $194 | 51 |
| 3432 71st Ave E | 0.60mi | 2/2.0 | 1,296 (+10%) | 4mo | $230,000 | $177 | 47 |
Match score weights: distance 35% · size 25% · config 20% · recency 20%. Top-matched comps best support the ARV.
Projected returns pro-forma
-3.0% appreciation · 3.0% rent growth · sell at horizon
- IRR
- 16.0%
- Equity multiple
- 1.64×
- Total profit
- $23,460
- Equity at exit
- $19,383
- IRR
- 24.6%
- Equity multiple
- 3.14×
- Total profit
- $77,868
- Equity at exit
- $11,240
Cash invested: $36,400 (down + closing). Projections, not guarantees.
Landlord ↔ Tenant lean methodology
- Overall (STATE)
- 87 Strongly Landlord-Friendly
- State Florida
- 87 Strongly Landlord-Friendly · R+3
- County
- — inherits STATE
- City
- — inherits STATE
ZIP-level market 34222
- Home prices YoY
- -26.9%
- Active inventory
- 185
- Price-to-rent
- 5.3×
Monthly cashflow live
- Estimated rent
- $2,037 high interval (Pro) →
- Mortgage (P&I)
- −$682
- Tax from tax record
- −$144 /mo · $1,726/yr
- Insurance
- −$54
- HOA
- −$31
- Vacancy / Maint / Mgmt
- −$428
- Net cashflow
- $698
Break-even live
Sensitivity live
| Price | -10% $772 | -5% $735 | +0% $698 | +5% $662 | +10% $625 |
|---|---|---|---|---|---|
| Rent | -10% $538 | -5% $618 | +0% $698 | +5% $779 | +10% $859 |
| Rate | -1.0pp $764 | -0.5pp $732 | base $698 | +0.5pp $665 | +1.0pp $631 |
UW: 25.0% down · 7.5% · 30yr · 1.5% tax · 5.0% vac · 8.0% maint · 8.0% mgmt
Financing live
Cash to close
- Down payment
- $32,500
- Closing costs
- $3,900
- Reserves months
- —
- Total cash needed
- —
Loan-product check · same deal, 3 products live
Conventional
25% down · 7.5% · 30yr
- Down + closing
- —
- Monthly P&I
- —
- Monthly cashflow
- —
- DSCR
- —
- Eligible?
- —
Personal DTI + credit; lowest rate.
DSCR
20% down · 8.5% · 30yr
- Down + closing
- —
- Monthly P&I
- —
- Monthly cashflow
- —
- DSCR
- —
- Eligible?
- —
No personal income docs; deal must DSCR.
Hard money
10% down · 12.0% · 12mo
- Down + closing
- —
- Monthly P&I
- —
- Monthly cashflow
- —
- DSCR
- —
- Eligible?
- —
Short-term bridge; refi at stabilization.
Rent comps 12 comps
| Address | Beds | Baths | Sqft | Rent | $/sqft | DOM | Units | Dist |
|---|---|---|---|---|---|---|---|---|
| 2710 59th Dr E Ellenton, FL | 1.0–3.0 | 1.0–2.0 | 1149 | $2,234 | $1.94 | 5d | 37 | 0.49mi |
| 5942 Factory Shops Blvd Ellenton, FL | 1.0–3.0 | 1.0–2.0 | 953 | $2,357 | $2.47 | 0d | 66 | 0.53mi |
| 482 Outer Dr Unit NA Ellenton, FL | 3.0 | 2.0 | 1400 | $1,600 | $1.14 | 5d | 1 | 0.75mi |
| 2711 80th Ave E Ellenton, FL | 3.0 | 2.0 | 1000 | $1,771 | $1.77 | 0d | 1 | 0.81mi |
| 3931 Day Bridge Pl Ellenton, FL | 3.0 | 2.0 | 1250 | $2,295 | $1.84 | 5d | 1 | 0.82mi |
| 3808 Sunset Dr Ellenton, FL | 3.0 | 2.0 | 1441 | $1,699 | $1.18 | 23d | 1 | 0.93mi |
| 7711 Desoto Dr Ellenton, FL | 2.0 | 2.5 | 1356 | $1,599 | $1.18 | 16d | 1 | 0.97mi |
| 8314 Nancy Ln Ellenton, FL | 2.0 | 2.0 | 1404 | $1,895 | $1.35 | 25d | 1 | 1.16mi |
| 4180 Yardly Dr Palmetto, FL | 1.0–3.0 | 1.0–2.0 | 1021 | $2,498 | $2.45 | 5d | 15 | 1.22mi |
| 3908 Lemonwood Dr N Ellenton, FL | 2.0 | 2.0 | 1400 | $1,750 | $1.25 | 25d | 1 | 1.29mi |
| 5021 US Highway 301 N Ellenton, FL | 3.0 | 2.5 | 861 | $3,900 | $4.53 | 5d | 1 | 1.30mi |
| 4212 Long Lake Way Ellenton, FL | 2.0 | 2.0 | 1000 | $1,900 | $1.90 | 25d | 1 | 1.31mi |
HOA detail
- Monthly dues
- $31 · $372/yr
- Likely covers
- poolsecurity
Listing history 50 events
-
2026-06-22days on market $130,000 Active 289 DOM
-
2026-06-18days on market $130,000 Active 286 DOM
-
2026-06-17days on market $130,000 Active 285 DOM
-
2026-06-16days on market $130,000 Active 284 DOM
-
2026-06-15days on market $130,000 Active 283 DOM
-
2026-06-13days on market $130,000 Active 281 DOM
-
2026-06-13days on market $130,000 Active 280 DOM
-
2026-06-10days on market $130,000 Active 278 DOM
-
2026-06-09days on market $130,000 Active 277 DOM
-
2026-06-08days on market $130,000 Active 276 DOM
-
2026-06-08days on market $130,000 Active 275 DOM
-
2026-06-03days on market $130,000 Active 271 DOM
-
2026-06-02days on market $130,000 Active 270 DOM
-
2026-06-01days on market $130,000 Active 269 DOM
-
2026-05-31days on market $130,000 Active 268 DOM
-
2026-04-29price $130,000
-
2026-04-09price $140,000
-
2026-02-06price $150,000
-
2025-12-09status Active
-
2025-11-18historical
-
2025-08-15$175,000 Active
-
2025-08-01historical $1,400
-
2025-08-01$1,400
-
2025-06-26historical $1,400
-
2025-03-18$1,400
-
2025-03-17historical
-
2025-02-06$199,000 Active
-
2024-12-31historical
-
2024-08-07price $140,000
-
2024-08-02price $145,000
-
2024-06-18$147,000 Active
-
2018-02-25historical
-
2017-12-08price $90,000
-
2017-10-03$95,000 Active
-
2016-11-19status Pending
-
2016-11-18historical
-
2016-09-04$80,000 Active
-
2015-06-11status Pending
-
2015-06-10historical
-
2015-05-23price $73,000
-
2015-05-14price $69,900
-
2014-08-12status Active
-
2014-07-31status Pending
-
2014-06-14status Active
-
2014-06-10historical
-
2013-04-30historical
-
2013-01-17$69,000 Active
-
2012-07-12$80,000
-
1986-07-01soldstatus $58,500
-
1984-04-01soldstatus $601,300
ⓘ Source: listings_history table (triggers on properties + properties_extension) + one-shot
backfill from property_details.listing_events for pre-trigger history.
Tax reassessment forecast FL · Resets to sale price
- Current annual tax
- $1,726 · $144/mo
- Projected year-2 tax
- $1,726 · $144/mo
- Expected delta
- $0/yr ($0/mo · 0.0%)
ⓘ Screening estimate from a state-policy table — verify with the county assessor before closing.
Climate risk First Street
- Flood 1/10 Low FEMA zone X (unshaded) · 0% chance over 30 yrs
- Wildfire 1/10 Low
- Heat 10/10 Extreme 7 d/yr ≥107°F today · 30 d/yr by 30 yrs out
- Wind 10/10 Extreme 99% chance of damaging wind over 30 yrs
- Air quality 3/10 Moderate 3 unhealthy d/yr today · 3 by 30 yrs out
Nearby sold comps map
Loading sold comps map…
Walkable amenities ~0.75 mi
Loading nearby amenities…
Taxation est. · year 1
- Rental income
- $24,444
- − Mortgage interest
- −$7,282
- − Property taxes
- −$1,726
- − Insurance
- −$650
- − Repairs & maintenance
- −$1,956
- − Management
- −$1,956
- − HOA
- −$372
- − Depreciation
- −$3,782
- Taxable income
- $6,721
- Est. tax owed @ 24.0%
- −$1,613
- After-tax cash flow
- $6,769/yr
For passive investors: Depreciation is non-cash, so a rental often shows a tax loss while cash-flowing — sheltering income. Rental losses are passive: they offset passive income freely, and up to $25,000/yr can offset ordinary (W-2) income if you actively participate and your MAGI is under $100k (phasing out to $0 by $150k); unused losses carry forward. On sale, claimed depreciation is recaptured at up to 25%, and gains may owe capital-gains tax (a 1031 exchange can defer both). Figures are a year-1 estimate at your 24.0% rate — not tax advice; consult a CPA.
Schools (NCES district)
- District
- Manatee
- NCES district ID
- 1201230
- Math proficiency
- 54% ▼ -6.00%
- Reading proficiency
- 50% ▼ -2.00%
- Median HH income
- $49,607
- Composite
- 44.43/100
- National rank
- #2806
- State rank
- #26 of 73 in FL
Livability — Bradenton
- Score
- 81/100
- State rank
- #101
- US rank
- #1528
Category grades
Schools grade is shown separately in the Schools card above.
Census & demographics
- County
- Manatee County · 416,364 people
- City population
- 227,091
- Metro
- North Port-Sarasota-Bradenton, FL
- Population (ZIP)
- 14,819
- Household income
- $64,355
- Rent vs Own
- Severe rent burden
- 313.0
Population outlook (Manatee County) Hauer SSP2
- Today (2025)
- 447,342 people
- By 2030
- 488,911 · +9.3%
- By 2040
- 567,934 · +27.0%
- By 2050
- 637,995 · +42.6%
- By 2075
- 781,970 · +74.8%
- By 2100
- 848,272 · +89.6%
Race, ethnicity, and origin ACS 2023
- Neighborhood character
- Predominantly White (70%)
- Race & ethnicity
- White 70% Hispanic / Latino 17% Two or more races 13% Black 7% Native American 2% Asian 1%
- Hispanic origin (detail)
- Mexican 8% Puerto Rican 2%
- Common ancestry
- Romanian 3% Slovak 2% Lithuanian 2%
- Foreign-born
- 8% · Canada, Jamaica, Vietnam
- Languages at home
- 88% English-only · Spanish 10% Other Indo-European 1% Vietnamese 1%
Political lean MEDSL · Manatee
- 2024 margin
- Strong R (+23.5) · D 37.9% · R 61.4%
- 2008→2024 swing
- -16.5pp toward R · 2008: -7.0pp · 2024: -23.5pp
- All cycles
- 2024: R+23.5 2020: R+16.1 2016: R+17.1 2012: R+12.5 2008: R+7.0
Not yet ingested
- Civics
- —
Market trends
- HPI YoY
- ▼ -107.75%
- Current HPI
- 293.2597
- Rent YoY
- —
- Metro
- North Port-Sarasota-Bradenton, FL
- State GDP YoY
- ▲ 3.28%
- F500 in state
- 36
Industry mix (Fortune 500 HQ in FL)
| Industry | F500 HQs | Revenue |
|---|---|---|
| Industrial Technology | 2 | $29B |
|
||
| Insurance | 2 | $17B |
|
||
| Retail | 1 | $60B |
|
||
| Technology Distribution | 1 | $58B |
|
||
| Homebuilding | 1 | $35B |
|
||
| Technology Manufacturing | 1 | $35B |
|
||
Price history
-78.4% since first listed35 events — show timeline
- 2026-04-29 Price Changed $130,000 Stellar MLS as Distributed by MLS Grid
- 2026-04-09 Price Changed $140,000 Stellar MLS as Distributed by MLS Grid
- 2026-02-06 Price Changed $150,000 Stellar MLS as Distributed by MLS Grid
- 2025-12-09 Relisted — Stellar MLS as Distributed by MLS Grid
- 2025-11-18 Listing Removed — Stellar MLS as Distributed by MLS Grid
- 2025-08-15 Listed $175,000 Stellar MLS as Distributed by MLS Grid
- 2025-08-01 Rental Removed $1,400 STELLARMLS
- 2025-08-01 Listed for Rent $1,400 STELLARMLS
- 2025-06-26 Rental Removed $1,400 STELLARMLS
- 2025-03-18 Listed for Rent $1,400 STELLARMLS
- 2025-03-17 Listing Removed — Stellar MLS as Distributed by MLS Grid
- 2025-02-06 Listed $199,000 Stellar MLS as Distributed by MLS Grid
- 2024-12-31 Listing Removed — Stellar MLS as Distributed by MLS Grid
- 2024-08-07 Price Changed $140,000 Stellar MLS as Distributed by MLS Grid
- 2024-08-02 Price Changed $145,000 Stellar MLS as Distributed by MLS Grid
- 2024-06-18 Listed $147,000 Stellar MLS as Distributed by MLS Grid
- 2018-02-25 Listing Removed — Stellar MLS as Distributed by MLS Grid
- 2017-12-08 Price Changed $90,000 Stellar MLS as Distributed by MLS Grid
- 2017-10-03 Listed $95,000 Stellar MLS as Distributed by MLS Grid
- 2016-11-19 Pending — Stellar MLS as Distributed by MLS Grid
- 2016-11-18 Listing Removed — Stellar MLS as Distributed by MLS Grid
- 2016-09-04 Listed $80,000 Stellar MLS as Distributed by MLS Grid
- 2015-06-11 Pending — Stellar MLS as Distributed by MLS Grid
- 2015-06-10 Listing Removed — Stellar MLS as Distributed by MLS Grid
- 2015-05-23 Price Changed $73,000 Stellar MLS as Distributed by MLS Grid
- 2015-05-14 Price Changed $69,900 Stellar MLS as Distributed by MLS Grid
- 2014-08-12 Relisted — Stellar MLS as Distributed by MLS Grid
- 2014-07-31 Pending — Stellar MLS as Distributed by MLS Grid
- 2014-06-14 Relisted — Stellar MLS as Distributed by MLS Grid
- 2014-06-10 Listing Removed — Stellar MLS as Distributed by MLS Grid
- 2013-04-30 Listing Removed — Stellar MLS as Distributed by MLS Grid
- 2013-01-17 Listed $69,000 Stellar MLS as Distributed by MLS Grid
- 2012-07-12 Listed $80,000 Stellar MLS as Distributed by MLS Grid
- 1986-07-01 Sold (Public Records) $58,500 Public Records
- 1984-04-01 Sold (Public Records) $601,300 Public Records
Property tax history
+9.1%/yrLatest (2025): $1,726 · +200.3% YoY. Source: county tax records.
Cash-flow waterfall
monthlySold comps — $/sqft
last 12 mo · ≤1 miLoading sold comps…