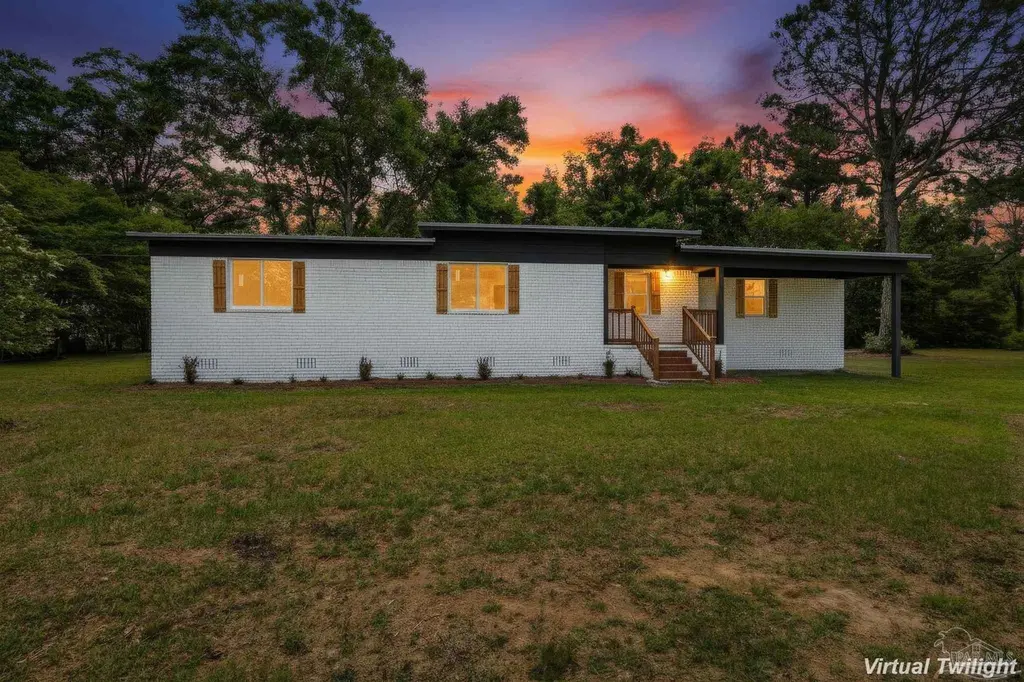
4610 Richardson Rd · Molino, FL
Flood risk 1/10 · Minimal
- FEMA flood zone
- X (unshaded)
- Chance of flooding over 30 yrs
- 0.0%
- Est. flood insurance / yr
- $507 – $1,088
Fire risk 6/10 · Moderate
- Est. fire insurance / yr
- $947 – $1,759
Heat risk 9/10 · Severe
- Hot days now (above 106°F)
- 7 days/yr
- Hot days in 30 yrs
- 21 days/yr
Wind risk 9/10 · Severe
- Chance of severe wind over 30 yrs
- 99.0%
Air-quality risk 1/10 · Minimal
- Unhealthy air days now
- 0 days/yr
- Unhealthy air days in 30 yrs
- 0 days/yr
Risk factors via First Street. Map © Google.
Why this score? — see what drove the D grade
The composite is a weighted blend of 9 inputs, each scored 0–100. Each bar is that input's sub-score; the figure is the points it added to the 100-point composite (weight × sub-score).
- ARV discount +15.0/15.0
- Cash flow +8.9/30.0
- Livability +3.8/5.0
- Schools +3.6/10.0
- DSCR +2.5/10.0
- Rent growth +2.5/5.0
- Condition / age +2.5/5.0
- 1% rule +2.0/10.0
- Appreciation +0.0/10.0
$344,000
🖨 Deal sheet 📄 Offer letter ✓ Due diligence
Listing remarks MLS
AS-IS cash sale
Key facts
- New water heater
- Granite countertops
- New hvac system
Tags
Property features AI
Finance
- Other: Lot approximately 0.74 acres; Directions: From Hwy 97 turn onto Richardson Rd
- HOA & community: No homeowners association
Exterior
- Parking: Four total parking spaces; Front entrance and guest parking
- Utilities: Public water; Septic tank sewer; Copper electrical wiring
- Home design: One-story brick home; Off-grade foundation; Resale property; Not attached to another property; Homestead; Paved, county-maintained road access; Green features include insulation and ENERGY STAR appliances
- Construction: Metal roof; Brick construction; Off-grade foundation; One level
- Exterior features: Covered porch; Porch
Interior
- Kitchen: Updated kitchen remodeled in 2025 with new cabinets, counters, sink, floors, tile, and appliances; Dishwasher; ENERGY STAR qualified dishwasher; ENERGY STAR qualified refrigerator; Electric water heater
- Bedrooms: Primary bedroom on the first floor, approximately 13' x 12'
- Bathrooms: Three full bathrooms; Bathrooms remodeled in 2025 with new cabinet, sink, flooring, tub, and tile
- Heating & cooling: Central heating; Central air conditioning; Ceiling fan(s); ENERGY STAR qualified equipment
- Interior features: Ceiling fan(s); Insulated doors
- Laundry & utility: Electric water heater
Neighborhood map
What this means for you Summary
Snapshot
- This is a 4-bed/2.0-bath single-family listed at $344k.
Deal economics
- At list price, monthly cash flow is $-278 ($-3k/yr) — negative.
- To cash-flow at today's rent, offer at most $295k (14.3% below list).
- To meet the 1% rule (rent ≥ 1% of price), the offer needs to be $240k (30.4% below list).
- Recommended offer: $240k (30.4% below list) — sets the bar for 1% rule.
- Cap rate 5.3% vs local median 3.5% in Molino — top-decile yield for the area; either an underpriced asset or a hidden risk that comps aren't pricing in. Stress-test before assuming the spread holds.
Location & tenants
- Location reads 76/100 on livability (#224 in FL, #3,540 nationally) — a middle-class / working-renter tenant base. Strengths: crime A+, employment A+, cost of living A+; Watch: amenities F, commute F, health & safety F.
- Escambia (suburban): math 40% / reading 45% proficiency, ranked #56 of 73 in FL (top 77%) — families likely to look elsewhere, expect single-tenant / working-renter base with shorter leases.
- Market conditions: 64 active listings in the ZIP; 1 comparable units currently listed for rent nearby; 1,479 units permitted in Escambia County in 2024 (0 in 5+ unit buildings).
Forward outlook
- Local home prices are declining (-3.0%/yr); year-one equity from $2k of loan paydown is wiped out by about $10k of value loss. Plan a longer hold.
- Escambia County population projected at +13% by 2050 — modest demand growth; plan on rents tracking national, not racing it.
Negotiation context
- It's been on market 50 days — a 3% lower offer ($334k) is reasonable based on typical stale-listing flexibility.
- 3 sale attempts; this cycle's ask has dropped $24k (7%) from the opening price — seller is motivated, your offer sets the floor, not the list.
- Current owner paid $115k; list at $344k implies a 199% gain — meaningful room to come down on a strong offer.
Risks & watch-outs
- Climate carrying-cost: severe wind risk, 99% chance of damaging wind over 30y; major wildfire risk; extreme-heat days projected 7→21/yr by 2055 (HVAC capex compounding) — expect insurance premiums to compound above CPI over the hold.
Questions for the listing agent
- What do current leases actually rent for vs. the listed asking? Can we see a recent rent roll and the last 12 months of T-12 income?
- It's been on market 50 days. Have you received any prior offers? Is the seller open to a 30% concession, seller financing, or rate buy-down credit?
- Is there a deadline driving the sale (1031 exchange, divorce, estate, relocation)? That informs how much negotiation room exists.
- Schools are B-rated — typically a magnet for longer-tenancy family renters. What's the average tenant stay here, and is there a school-zone premium baked into asking?
- The area grade is low — what's the realistic commute time and amenity access for the typical tenant pool here? Any planned neighborhood developments (good or bad) we should know about?
- What's the average days-on-market for RENTAL listings here right now (not sales)? A rising rental-DOM trend means longer vacancies and softer asking-rent achievability than the comps imply.
- What's the recent tenant-quality profile in this submarket — average credit score on applications, eviction rate, late-payment / NSF rate, and stable-employment percentage? A property-management company in the area should have these aggregated.
- How much new for-sale + rental construction is in the pipeline within 1–3 miles? Heavy new supply typically softens prices + rents 12–24 months out; constrained supply supports both.
Investment metrics
- 1% rule
- 0.70% ✗
- Cap rate
- 5.32%
- Cash-on-cash
- -3.46%
- DSCR
- 0.85
- GRM
- 12.0
CMA / ARV
- ARV (median comp)
- $597,304
- List price
- $344,000
- Delta
- -42.41%
- Verdict
- UNDERPRICED
- Comps
- 8 within 1.0 mi
Show comp detail 2 sales within ~0.75 mi
| Address | Dist | Beds/Ba | Sqft | Sold | Price | $/sf | Match |
|---|---|---|---|---|---|---|---|
| 4340 Molino Meadows Rd | 0.63mi | 4/3.0 | 2,012 (+1%) | 2mo | $495,000 | $246 | 63 |
| 4355 N Hwy 95 A | 0.26mi | 3/2.0 (-1) | 1,814 (-9%) | 16mo | $220,000 | $121 | 54 |
Match score weights: distance 35% · size 25% · config 20% · recency 20%. Top-matched comps best support the ARV.
Projected returns pro-forma
-3.0% appreciation · 3.0% rent growth · sell at horizon
- IRR
- -22.1%
- Equity multiple
- 0.24×
- Total profit
- $-73,545
- Equity at exit
- $51,292
- IRR
- -16.2%
- Equity multiple
- 0.09×
- Total profit
- $-87,217
- Equity at exit
- $29,743
Cash invested: $96,320 (down + closing). Projections, not guarantees.
Landlord ↔ Tenant lean methodology
- Overall (STATE)
- 87 Strongly Landlord-Friendly
- State Florida
- 87 Strongly Landlord-Friendly · R+3
- County
- — inherits STATE
- City
- — inherits STATE
ZIP-level market 32577
- Home prices YoY
- -6.5%
- Active inventory
- 64
- Price-to-rent
- 12.0×
Monthly cashflow live
- Estimated rent
- $2,395 medium interval (Pro) →
- Mortgage (P&I)
- −$1,804
- Tax from tax record
- −$223 /mo · $2,674/yr
- Insurance
- −$143
- HOA
- −$0
- Vacancy / Maint / Mgmt
- −$503
- Net cashflow
- $-278
Break-even live
UW: 25.0% down · 7.5% · 30yr · 1.5% tax · 5.0% vac · 8.0% maint · 8.0% mgmt
Financing live
Cash to close
- Down payment
- $86,000
- Closing costs
- $10,320
- Reserves months
- —
- Total cash needed
- —
Loan-product check · same deal, 3 products live
Conventional
25% down · 7.5% · 30yr
- Down + closing
- —
- Monthly P&I
- —
- Monthly cashflow
- —
- DSCR
- —
- Eligible?
- —
Personal DTI + credit; lowest rate.
DSCR
20% down · 8.5% · 30yr
- Down + closing
- —
- Monthly P&I
- —
- Monthly cashflow
- —
- DSCR
- —
- Eligible?
- —
No personal income docs; deal must DSCR.
Hard money
10% down · 12.0% · 12mo
- Down + closing
- —
- Monthly P&I
- —
- Monthly cashflow
- —
- DSCR
- —
- Eligible?
- —
Short-term bridge; refi at stabilization.
Rent comps 1 comps
| Address | Beds | Baths | Sqft | Rent | $/sqft | DOM | Units | Dist |
|---|---|---|---|---|---|---|---|---|
| 4321 Molino Meadows Dr Molino, FL | 3.0 | 2.0 | 1912 | $2,395 | $1.25 | 13d | 1 | 0.65mi |
Listing history 23 events
-
2026-06-18days on market $344,000 Active 50 DOM
-
2026-06-17days on market $344,000 Active 49 DOM
-
2026-06-16days on market $344,000 Active 48 DOM
-
2026-06-15days on market $344,000 Active 47 DOM
-
2026-06-14remarks 699-char remark
-
2026-06-14pricedays on market $344,000 Active 45 DOM
-
2026-06-10days on market $349,000 Active 42 DOM
-
2026-06-09days on market $349,000 Active 41 DOM
-
2026-06-08days on market $349,000 Active 40 DOM
-
2026-06-07days on market $349,000 Active 39 DOM
-
2026-06-03days on market $349,000 Active 35 DOM
-
2026-06-03price $349,000 Active 34 DOM
-
2026-06-02days on market $358,500 Active 34 DOM
-
2026-06-01days on market $358,500 Active 33 DOM
-
2026-05-31days on market $358,500 Active 32 DOM
-
2026-05-31days on market $358,500 Active 31 DOM
-
2026-05-11price $358,500 704-char remark
-
2026-04-29$368,500 Active 704-char remark
-
2025-11-07soldstatus $115,000 15-char remark
Show marketing remark (15 chars)
AS-IS cash sale
-
2025-11-07soldstatus $115,000
Show marketing remark (15 chars)
AS-IS cash sale
-
2025-11-06$115,000 15-char remark
Show marketing remark (15 chars)
AS-IS cash sale
-
2025-09-03soldstatus $30,000
Show marketing remark (25 chars)
AS-IS court ordered sale.
-
2025-09-03$30,000
Show marketing remark (25 chars)
AS-IS court ordered sale.
ⓘ Source: listings_history table (triggers on properties + properties_extension) + one-shot
backfill from property_details.listing_events for pre-trigger history.
Tax reassessment forecast FL · Resets to sale price
- Current annual tax
- $2,674 · $223/mo
- Projected year-2 tax
- $2,855 · $238/mo
- Expected delta
- +$181/yr (+$15/mo · 6.8%)
ⓘ Screening estimate from a state-policy table — verify with the county assessor before closing.
Climate risk First Street
- Flood 1/10 Low FEMA zone X (unshaded) · 0% chance over 30 yrs
- Wildfire 6/10 Major
- Heat 9/10 Extreme 7 d/yr ≥106°F today · 21 d/yr by 30 yrs out
- Wind 9/10 Extreme 99% chance of damaging wind over 30 yrs
- Air quality 1/10 Low 0 unhealthy d/yr today · 0 by 30 yrs out
Nearby sold comps map
Loading sold comps map…
Walkable amenities ~0.75 mi
Loading nearby amenities…
Taxation est. · year 1
- Rental income
- $28,740
- − Mortgage interest
- −$19,269
- − Property taxes
- −$2,674
- − Insurance
- −$1,720
- − Repairs & maintenance
- −$2,299
- − Management
- −$2,299
- − Depreciation
- −$10,007
- Taxable loss
- −$9,529
- Est. tax savings @ 24.0%
- +$2,287
- After-tax cash flow
- $-1,050/yr
For passive investors: Depreciation is non-cash, so a rental often shows a tax loss while cash-flowing — sheltering income. Rental losses are passive: they offset passive income freely, and up to $25,000/yr can offset ordinary (W-2) income if you actively participate and your MAGI is under $100k (phasing out to $0 by $150k); unused losses carry forward. On sale, claimed depreciation is recaptured at up to 25%, and gains may owe capital-gains tax (a 1031 exchange can defer both). Figures are a year-1 estimate at your 24.0% rate — not tax advice; consult a CPA.
Schools (NCES district)
- District
- Escambia
- NCES district ID
- 1200510
- Math proficiency
- 40% ▼ -9.00%
- Reading proficiency
- 45% ▼ -4.00%
- Median HH income
- $44,649
- Composite
- 36.04/100
- National rank
- #4773
- State rank
- #56 of 73 in FL
Livability — Molino
- Score
- 76/100
- State rank
- #224
- US rank
- #3540
Category grades
Schools grade is shown separately in the Schools card above.
Census & demographics
- Census place
- Molino, FL
- Population (ZIP)
- 4,881
Population outlook (Escambia County) Hauer SSP2
- Today (2025)
- 334,637 people
- By 2030
- 345,779 · +3.3%
- By 2040
- 364,828 · +9.0%
- By 2050
- 378,514 · +13.1%
- By 2075
- 403,220 · +20.5%
- By 2100
- 386,125 · +15.4%
Race, ethnicity, and origin ACS 2023
- Neighborhood character
- Predominantly White (78%)
- Race & ethnicity
- White 78% Two or more races 13% Hispanic / Latino 12% Black 4%
- Hispanic origin (detail)
- Puerto Rican 8%
- Common ancestry
- Serbian 4% Scotch-Irish 3% Lithuanian 2%
- Foreign-born
- 1% · Canada
- Languages at home
- 94% English-only · Spanish 6% Tagalog/Filipino 1%
Political lean MEDSL · Escambia
- 2024 margin
- R (+19.5) · D 39.7% · R 59.2% · Other 1.1%
- 2008→2024 swing
- -0.2pp no change · 2008: -19.3pp · 2024: -19.5pp
- All cycles
- 2024: R+19.5 2020: R+15.1 2016: R+20.6 2012: R+20.6 2008: R+19.3
Not yet ingested
- Civics
- —
Market trends
- HPI YoY
- ▼ -22.32%
- Current HPI
- 323.2275
- Rent YoY
- —
- Metro
- —
- State GDP YoY
- ▲ 3.28%
- F500 in state
- 36
Industry mix (Fortune 500 HQ in FL)
| Industry | F500 HQs | Revenue |
|---|---|---|
| Industrial Technology | 2 | $29B |
|
||
| Insurance | 2 | $17B |
|
||
| Retail | 1 | $60B |
|
||
| Technology Distribution | 1 | $58B |
|
||
| Homebuilding | 1 | $35B |
|
||
| Technology Manufacturing | 1 | $35B |
|
||
Price history
+1046.7% since first listed9 events — show timeline
- 2026-06-11 Price Changed $344,000 PARMLS
- 2026-06-02 Price Changed $349,000 PARMLS
- 2026-05-11 Price Changed $358,500 PARMLS
- 2026-04-29 Listed $368,500 PARMLS
- 2025-11-07 Sold (Public Records) $115,000 Public Records
- 2025-11-07 Sold (MLS) $115,000 PARMLS
- 2025-11-06 Listed $115,000 PARMLS
- 2025-09-03 Listed $30,000 PARMLS
- 2025-09-03 Sold (MLS) $30,000 PARMLS
Property tax history
+6.9%/yrLatest (2025): $2,674 · +14.3% YoY. Source: county tax records.
Cash-flow waterfall
monthlySold comps — $/sqft
last 12 mo · ≤1 miLoading sold comps…