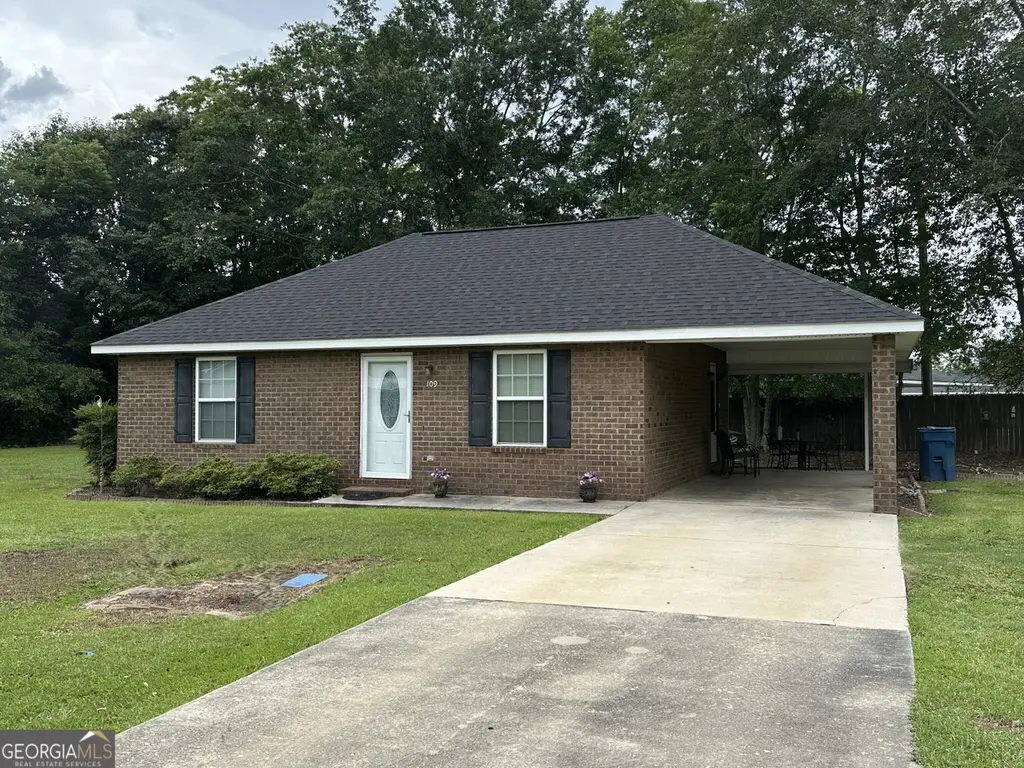
109 Chance Ln · Glennville, GA
Flood risk 1/10 · Minimal
- FEMA flood zone
- X (unshaded)
- Chance of flooding over 30 yrs
- 0.0%
- Est. flood insurance / yr
- $507 – $1,088
Fire risk 5/10 · Moderate
- Est. fire insurance / yr
- $963 – $1,789
Heat risk 8/10 · Major
- Hot days now (above 108°F)
- 7 days/yr
- Hot days in 30 yrs
- 18 days/yr
Wind risk 8/10 · Major
- Chance of severe wind over 30 yrs
- 97.0%
Air-quality risk 2/10 · Minimal
- Unhealthy air days now
- 2 days/yr
- Unhealthy air days in 30 yrs
- 2 days/yr
Risk factors via First Street. Map © Google.
Why this score? — see what drove the D+ grade
The composite is a weighted blend of 9 inputs, each scored 0–100. Each bar is that input's sub-score; the figure is the points it added to the 100-point composite (weight × sub-score).
- Cash flow +20.3/30.0
- ARV discount +7.5/15.0
- DSCR +6.5/10.0
- 1% rule +4.6/10.0
- Livability +3.2/5.0
- Rent growth +2.5/5.0
- Condition / age +2.5/5.0
- Schools +2.4/10.0
- Appreciation +0.0/10.0
$133,998
🖨 Deal sheet 📄 Offer letter ✓ Due diligence
Listing remarks MLS
(Imported from ABBR ListingId 10980)
Key facts
- 7,840 sq ft lot
- Parking
- Built 2011
Property features AI
Finance
- Other: Property located in the Picket Fences subdivision
- HOA & community: No HOA
Exterior
- Parking: Attached carport (1 parking space)
- Utilities: Public water; Public sewer; Electricity available; Cable available
- Home design: Single family residence (house); One story; Resale property
- Construction: Built in 2011; Brick construction; Composition roof; Slab foundation
- Exterior features: Patio; Back yard with wood fencing; Corner lot
Interior
- Kitchen: Breakfast bar; Pantry; Refrigerator
- Bedrooms: 2 bedrooms (both on the main level)
- Flooring: Carpet; Vinyl
- Bathrooms: 1 full bathroom
- Heating & cooling: Central electric heating; Central air; Ceiling fan(s)
- Interior features: Walk-in closet(s); One-level living; No common walls
- Laundry & utility: Laundry in a common area
Neighborhood map
What this means for you Summary
Snapshot
- This is a 2-bed/1.0-bath single-family listed at $134k.
Deal economics
- At list price, monthly cash flow is $172 ($2k/yr) — positive.
- The deal already cash-flows at list — no discount required.
- To meet the 1% rule (rent ≥ 1% of price), the offer needs to be $128k (4.3% below list).
- Recommended offer: $128k (4.3% below list) — sets the bar for 1% rule.
- Cap rate 7.8% vs local median 4.9% in Glennville — top-decile yield for the area; either an underpriced asset or a hidden risk that comps aren't pricing in. Stress-test before assuming the spread holds.
Location & tenants
- Location reads 63/100 on livability (#280 in GA) — a middle-class / working-renter tenant base. Strengths: cost of living A+, health & safety A+, housing A-; Watch: employment D+, amenities F, commute F.
- Tattnall County (rural): math 29% / reading 28% proficiency, ranked #103 of 174 in GA (top 59%) — low school quality limits family demand, transient renter base, plan for 1-2y turnover; 65% free/reduced lunch — lower-income household profile, screen leases tightly.
- Zoned schools: South Tattnall Middle School (math 37% / reading 35%, grade F, #178 of 470 statewide, top 39%, 382 students, 78% FRL).
- Market conditions: 76 active listings in the ZIP; 46 units permitted in Tattnall County in 2024 (0 in 5+ unit buildings).
Forward outlook
- Local home prices are declining (-3.0%/yr); year-one equity from $926 of loan paydown is wiped out by about $4k of value loss. Plan a longer hold.
- Tattnall County population projected at +3% by 2050 — modest demand growth; plan on rents tracking national, not racing it.
Negotiation context
- Only 7 days on market — expect competitive offers; lowballing is unlikely to land.
- 2 sale attempts since 15y ago with the ask held roughly flat each time — persistent listings suggest the price (not the market) is what's stuck; bring a comps-based counter.
- Current owner paid $78k; list at $134k implies a 72% gain — meaningful room to come down on a strong offer.
Risks & watch-outs
- Climate carrying-cost: severe wind risk, 97% chance of damaging wind over 30y; moderate wildfire risk; extreme-heat days projected 7→18/yr by 2055 (HVAC capex compounding) — expect insurance premiums to compound above CPI over the hold.
Questions for the listing agent
- Is there a deadline driving the sale (1031 exchange, divorce, estate, relocation)? That informs how much negotiation room exists.
- Schools are F-rated, which usually means shorter tenancies and higher turnover. Who's the typical renter profile here, and what's been the actual vacancy rate?
- The area grade is low — what's the realistic commute time and amenity access for the typical tenant pool here? Any planned neighborhood developments (good or bad) we should know about?
- What's the average days-on-market for RENTAL listings here right now (not sales)? A rising rental-DOM trend means longer vacancies and softer asking-rent achievability than the comps imply.
- What's the recent tenant-quality profile in this submarket — average credit score on applications, eviction rate, late-payment / NSF rate, and stable-employment percentage? A property-management company in the area should have these aggregated.
- How much new for-sale + rental construction is in the pipeline within 1–3 miles? Heavy new supply typically softens prices + rents 12–24 months out; constrained supply supports both.
Investment metrics
- 1% rule
- 0.96% ✗
- Cap rate
- 7.84%
- Cash-on-cash
- 5.51%
- DSCR
- 1.25
- GRM
- 8.7
CMA / ARV
- ARV (on-the-fly)
- $72,919
- Comps found
- 2
Show comp detail 2 sales within ~0.75 mi
| Address | Dist | Beds/Ba | Sqft | Sold | Price | $/sf | Match |
|---|---|---|---|---|---|---|---|
| 404 E Howard St | 0.71mi | 3/2.0 (+1) | 1,000 (+6%) | 23mo | $14,000 | $14 | 29 |
| 502 Lewis St | 0.73mi | 3/2.0 (+1) | 1,068 (+13%) | 18mo | $82,500 | $77 | 20 |
Match score weights: distance 35% · size 25% · config 20% · recency 20%. Top-matched comps best support the ARV.
Projected returns pro-forma
-3.0% appreciation · 3.0% rent growth · sell at horizon
- IRR
- -7.8%
- Equity multiple
- 0.71×
- Total profit
- $-10,773
- Equity at exit
- $19,980
- IRR
- 1.7%
- Equity multiple
- 1.12×
- Total profit
- $4,614
- Equity at exit
- $11,586
Cash invested: $37,519 (down + closing). Projections, not guarantees.
Landlord ↔ Tenant lean methodology
- Overall (STATE)
- 90 Strongly Landlord-Friendly
- State Georgia
- 90 Strongly Landlord-Friendly · R+3
- County
- — inherits STATE
- City
- — inherits STATE
ZIP-level market 30427
- Home prices YoY
- -7.3%
- Active inventory
- 76
- Price-to-rent
- 8.7×
Monthly cashflow live
- Estimated rent
- $1,282 medium interval (Pro) →
- Mortgage (P&I)
- −$703
- Tax from tax record
- −$82 /mo · $985/yr
- Insurance
- −$56
- HOA
- −$0
- Vacancy / Maint / Mgmt
- −$269
- Net cashflow
- $172
Break-even live
UW: 25.0% down · 7.5% · 30yr · 1.5% tax · 5.0% vac · 8.0% maint · 8.0% mgmt
Financing live
Cash to close
- Down payment
- $33,500
- Closing costs
- $4,020
- Reserves months
- —
- Total cash needed
- —
Loan-product check · same deal, 3 products live
Conventional
25% down · 7.5% · 30yr
- Down + closing
- —
- Monthly P&I
- —
- Monthly cashflow
- —
- DSCR
- —
- Eligible?
- —
Personal DTI + credit; lowest rate.
DSCR
20% down · 8.5% · 30yr
- Down + closing
- —
- Monthly P&I
- —
- Monthly cashflow
- —
- DSCR
- —
- Eligible?
- —
No personal income docs; deal must DSCR.
Hard money
10% down · 12.0% · 12mo
- Down + closing
- —
- Monthly P&I
- —
- Monthly cashflow
- —
- DSCR
- —
- Eligible?
- —
Short-term bridge; refi at stabilization.
Listing history 9 events
-
2026-06-18status $133,998 Under Contract 7 DOM
-
2026-06-17days on market $133,998 Active 7 DOM
-
2026-06-16days on market $133,998 Active 6 DOM
-
2026-06-15statusdays on market $133,998 Active 5 DOM
-
2026-06-14days on market $133,998 Back On Market 3 DOM
-
2026-06-13statusdays on market $133,998 Back On Market 2 DOM
-
2026-06-05status $133,998 Under Contract 1 DOM
-
2026-06-03remarks 140-char remark
-
2026-06-03$133,998 New 1 DOM
ⓘ Source: listings_history table (triggers on properties + properties_extension) + one-shot
backfill from property_details.listing_events for pre-trigger history.
Tax reassessment forecast GA · Resets to sale price
- Current annual tax
- $985 · $82/mo
- Projected year-2 tax
- $1,233 · $103/mo
- Expected delta
- +$248/yr (+$21/mo · 25.2%)
ⓘ Screening estimate from a state-policy table — verify with the county assessor before closing.
Climate risk First Street
- Flood 1/10 Low FEMA zone X (unshaded) · 0% chance over 30 yrs
- Wildfire 5/10 Major
- Heat 8/10 Severe 7 d/yr ≥108°F today · 18 d/yr by 30 yrs out
- Wind 8/10 Severe 97% chance of damaging wind over 30 yrs
- Air quality 2/10 Low 2 unhealthy d/yr today · 2 by 30 yrs out
Nearby sold comps map
Loading sold comps map…
Walkable amenities ~0.75 mi
Loading nearby amenities…
Taxation est. · year 1
- Rental income
- $15,386
- − Mortgage interest
- −$7,506
- − Property taxes
- −$985
- − Insurance
- −$670
- − Repairs & maintenance
- −$1,231
- − Management
- −$1,231
- − Depreciation
- −$3,898
- Taxable loss
- −$135
- Est. tax savings @ 24.0%
- +$32
- After-tax cash flow
- $2,100/yr
For passive investors: Depreciation is non-cash, so a rental often shows a tax loss while cash-flowing — sheltering income. Rental losses are passive: they offset passive income freely, and up to $25,000/yr can offset ordinary (W-2) income if you actively participate and your MAGI is under $100k (phasing out to $0 by $150k); unused losses carry forward. On sale, claimed depreciation is recaptured at up to 25%, and gains may owe capital-gains tax (a 1031 exchange can defer both). Figures are a year-1 estimate at your 24.0% rate — not tax advice; consult a CPA.
Schools (NCES district)
- District
- Tattnall County
- NCES district ID
- 1304770
- Math proficiency
- 29% ▼ -9.00%
- Reading proficiency
- 28% ▼ -1.00%
- Median HH income
- $36,214
- Composite
- 23.65/100
- National rank
- #7843
- State rank
- #103 of 174 in GA
Livability — Glennville
- Score
- 63/100
- State rank
- #280
- US rank
- #15005
Category grades
Schools grade is shown separately in the Schools card above.
Census & demographics
- Census place
- Glennville, GA
- Population (ZIP)
- 11,892
Population outlook (Tattnall County) Hauer SSP2
- Today (2025)
- 24,831 people
- By 2030
- 24,823 · +-0.0%
- By 2040
- 25,225 · +1.6%
- By 2050
- 25,678 · +3.4%
- By 2075
- 24,210 · -2.5%
- By 2100
- 21,404 · -13.8%
Race, ethnicity, and origin ACS 2023
- Neighborhood character
- Diverse neighborhood (Simpson 0.57)
- Race & ethnicity
- White 60% Black 23% Hispanic / Latino 13% Two or more races 4%
- Hispanic origin (detail)
- Mexican 10%
- Common ancestry
- Slovak 2% Lithuanian 2% Italian 1%
- Foreign-born
- 5% · Canada, China
- Languages at home
- 91% English-only · Spanish 8%
Political lean MEDSL · Tattnall
- 2024 margin
- Solid R (+53.4) · D 23.1% · R 76.5%
- 2008→2024 swing
- -11.8pp toward R · 2008: -41.7pp · 2024: -53.4pp
- All cycles
- 2024: R+53.4 2020: R+48.8 2016: R+49.6 2012: R+42.2 2008: R+41.7
Not yet ingested
- Civics
- —
Market trends
- HPI YoY
- ▼ -19.04%
- Current HPI
- 240.8632
- Rent YoY
- —
- Metro
- —
- State GDP YoY
- ▲ 2.66%
- F500 in state
- 28
Industry mix (Fortune 500 HQ in GA)
| Industry | F500 HQs | Revenue |
|---|---|---|
| Paper / Packaging | 2 | $29B |
|
||
| Retail | 1 | $160B |
|
||
| Transportation / Logistics | 1 | $91B |
|
||
| Airlines | 1 | $62B |
|
||
| Consumer Goods | 1 | $47B |
|
||
| Utilities | 1 | $25B |
|
||
Price history
+71.8% since first listed4 events — show timeline
- 2026-06-02 Listed $133,998 GAMLS
- 2011-04-04 Sold (Public Records) $78,000 Public Records
- 2011-04-01 Sold (MLS) $78,000 GAMLS
- 2011-02-24 Listed $78,000 GAMLS
Property tax history
+4.5%/yrLatest (2025): $985 · +0.0% YoY. Source: county tax records.
Cash-flow waterfall
monthlySold comps — $/sqft
last 12 mo · ≤1 miLoading sold comps…