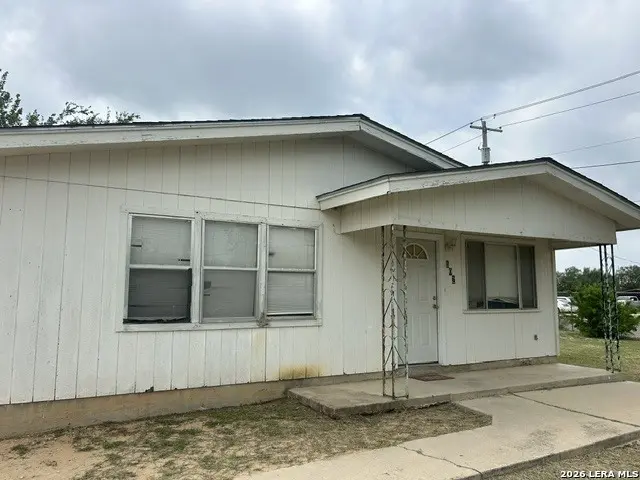
502 Alamo St · Crystal City, TX
Flood risk 1/10 · Minimal
- FEMA flood zone
- X
- Chance of flooding over 30 yrs
- 0.0%
- Est. flood insurance / yr
- $507 – $1,088
Fire risk 7/10 · Major
- Est. fire insurance / yr
- $1,222 – $2,270
Heat risk 8/10 · Major
- Hot days now (above 111°F)
- 7 days/yr
- Hot days in 30 yrs
- 21 days/yr
Wind risk 6/10 · Moderate
- Chance of severe wind over 30 yrs
- 60.0%
Air-quality risk 1/10 · Minimal
- Unhealthy air days now
- 0 days/yr
- Unhealthy air days in 30 yrs
- 0 days/yr
Risk factors via First Street. Map © Google.
Why this score? — see what drove the D+ grade
The composite is a weighted blend of 9 inputs, each scored 0–100. Each bar is that input's sub-score; the figure is the points it added to the 100-point composite (weight × sub-score).
- Cash flow +15.8/30.0
- ARV discount +7.5/15.0
- Appreciation +7.5/10.0
- DSCR +4.9/10.0
- 1% rule +4.5/10.0
- Livability +3.1/5.0
- Rent growth +2.5/5.0
- Condition / age +2.5/5.0
- Schools +1.2/10.0
$100,000
🖨 Deal sheet 📄 Offer letter ✓ Due diligence
Listing remarks
Opportunity awaits with this 2-bedroom, 1.5-bath home situated on a spacious corner lot in Crystal City. This property offers great potential for buyers looking to add their personal touch and make it their own. Featuring approximately 1,024 square feet of living space, this home includes several recent improvements, including a newer roof and updated water heater, providing a solid foundation for future updates. The fenced yard offers added privacy, and the concrete slab provides convenient off-street parking. Whether you're a first-time homebuyer, investor, or someone searching for an affordable property with potential, this home is worth a look. Seller will not provide owner financing. H
Key facts
- Large corner lot
- Fenced
- Concrete slab
Tags
Property features AI
Finance
- Other:
- Financial info:
- HOA & community: Subdivision: CRYSTAL CITY
Exterior
- Parking:
- Security:
- Utilities: Public water; Public sewer
- Home design: Pre-owned single-family home; Siding exterior; Composition roof
- Construction: Approximately 33 years old; Slab foundation
- Exterior features: Corner lot; Paved street
Interior
- Kitchen: Kitchen (approx. 10 x 10); Refrigerator included
- Bedrooms: Master bedroom on lower level (approx. 12 x 12); Second bedroom (approx. 10 x 10)
- Flooring: Linoleum flooring
- Bathrooms: 1 full bath; 1 half bath; Master bath with tub/shower combination (approx. 8 x 8)
- Heating & cooling: Electric heating
- Interior features: Single living area; All window coverings remain
- Laundry & utility: Washer connection; Dryer connection
Neighborhood map
What this means for you Summary
Snapshot
- This is a 2-bed/1.0-bath single-family listed at $100k.
Deal economics
- At list price, monthly cash flow is $45 ($539/yr) — positive.
- The deal already cash-flows at list — no discount required.
- To meet the 1% rule (rent ≥ 1% of price), the offer needs to be $95k (5.1% below list).
- Recommended offer: $95k (5.1% below list) — sets the bar for 1% rule.
Location & tenants
- Location reads 62/100 on livability (#910 in TX) — a middle-class / working-renter tenant base. Strengths: cost of living A+, housing A+; Watch: health & safety C-, crime F, amenities F.
- Crystal City ISD (town): math 10% / reading 22% proficiency, ranked #813 of 826 in TX (top 98%) — low school quality limits family demand, transient renter base, plan for 1-2y turnover; 78% free/reduced lunch — lower-income household profile, screen leases tightly.
- Zoned schools: Crystal City H S (math 2% / reading 32%, grade F, #1,460 of 1,632 statewide, top 91%, 551 students, 82% FRL) — zoned schools at 82% FRL track the district average.
- Market conditions: 20 active listings in the ZIP; 3 units permitted in Zavala County in 2024 (0 in 5+ unit buildings).
Forward outlook
- In year one you build about $6k of equity ($691 loan paydown + $5k appreciation (5.0% local appreciation)).
- Zavala County population projected at +22% by 2050 — long-run rental-demand tailwind backs the buy-and-hold thesis.
- At projected returns (5.0% appreciation + 3.0% rent growth), your $28k cash investment doubles in ~4 years — after that, you're playing with house money.
- By year 6, paydown + projected appreciation supports a ~$31k cash-out refi (75% LTV) — recoverable capital for the next deal without selling this one.
Negotiation context
- It's been on market 31 days — a 3% lower offer ($97k) is reasonable based on typical stale-listing flexibility.
Risks & watch-outs
- Climate carrying-cost: major wind risk, 60% chance of damaging wind over 30y; major wildfire risk; extreme-heat days projected 7→21/yr by 2055 (HVAC capex compounding) — expect insurance premiums to compound above CPI over the hold.
Questions for the listing agent
- It's been on market 31 days. Have you received any prior offers? Is the seller open to a 5% concession, seller financing, or rate buy-down credit?
- Is there a deadline driving the sale (1031 exchange, divorce, estate, relocation)? That informs how much negotiation room exists.
- Schools are F-rated, which usually means shorter tenancies and higher turnover. Who's the typical renter profile here, and what's been the actual vacancy rate?
- Crime grade is F in this area — have there been break-ins, vandalism, or insurance claims at this property in the last 3 years? What carrier currently insures it and at what premium?
- The area grade is low — what's the realistic commute time and amenity access for the typical tenant pool here? Any planned neighborhood developments (good or bad) we should know about?
- What's the average days-on-market for RENTAL listings here right now (not sales)? A rising rental-DOM trend means longer vacancies and softer asking-rent achievability than the comps imply.
- What's the recent tenant-quality profile in this submarket — average credit score on applications, eviction rate, late-payment / NSF rate, and stable-employment percentage? A property-management company in the area should have these aggregated.
- How much new for-sale + rental construction is in the pipeline within 1–3 miles? Heavy new supply typically softens prices + rents 12–24 months out; constrained supply supports both.
Investment metrics
- 1% rule
- 0.95% ✗
- Cap rate
- 6.83%
- Cash-on-cash
- 1.93%
- DSCR
- 1.09
- GRM
- 8.8
CMA / ARV
No comps found within radius.
Projected returns pro-forma
5.02% appreciation · 3.0% rent growth · sell at horizon
- IRR
- 14.6%
- Equity multiple
- 1.93×
- Total profit
- $26,046
- Equity at exit
- $56,788
- IRR
- 15.2%
- Equity multiple
- 3.72×
- Total profit
- $76,273
- Equity at exit
- $98,107
Cash invested: $28,000 (down + closing). Projections, not guarantees.
Landlord ↔ Tenant lean methodology
- Overall (STATE)
- 87 Strongly Landlord-Friendly
- State Texas
- 87 Strongly Landlord-Friendly · R+5
- County
- — inherits STATE
- City
- — inherits STATE
ZIP-level market 78839
- Home prices YoY
- 3.9%
- Active inventory
- 20
- Price-to-rent
- 8.8×
Monthly cashflow live
- Estimated rent
- $949 medium interval (Pro) →
- Mortgage (P&I)
- −$524
- Tax from tax record
- −$139 /mo · $1,662/yr
- Insurance
- −$42
- HOA
- −$0
- Vacancy / Maint / Mgmt
- −$199
- Net cashflow
- $45
Break-even live
UW: 25.0% down · 7.5% · 30yr · 1.5% tax · 5.0% vac · 8.0% maint · 8.0% mgmt
Financing live
Cash to close
- Down payment
- $25,000
- Closing costs
- $3,000
- Reserves months
- —
- Total cash needed
- —
Loan-product check · same deal, 3 products live
Conventional
25% down · 7.5% · 30yr
- Down + closing
- —
- Monthly P&I
- —
- Monthly cashflow
- —
- DSCR
- —
- Eligible?
- —
Personal DTI + credit; lowest rate.
DSCR
20% down · 8.5% · 30yr
- Down + closing
- —
- Monthly P&I
- —
- Monthly cashflow
- —
- DSCR
- —
- Eligible?
- —
No personal income docs; deal must DSCR.
Hard money
10% down · 12.0% · 12mo
- Down + closing
- —
- Monthly P&I
- —
- Monthly cashflow
- —
- DSCR
- —
- Eligible?
- —
Short-term bridge; refi at stabilization.
Listing history 19 events
-
2026-06-19days on market $100,000 Active 31 DOM
-
2026-06-18days on market $100,000 Active 30 DOM
-
2026-06-17remarks 699-char remark
-
2026-06-17days on market $100,000 Active 29 DOM
-
2026-06-16days on market $100,000 Active 28 DOM
-
2026-06-15days on market $100,000 Active 27 DOM
-
2026-06-14days on market $100,000 Active 25 DOM
-
2026-06-13days on market $100,000 Active 24 DOM
-
2026-06-10days on market $100,000 Active 22 DOM
-
2026-06-09days on market $100,000 Active 21 DOM
-
2026-06-08days on market $100,000 Active 20 DOM
-
2026-06-07days on market $100,000 Active 19 DOM
-
2026-06-05days on market $100,000 Active 16 DOM
-
2026-06-03days on market $100,000 Active 15 DOM
-
2026-06-02days on market $100,000 Active 14 DOM
-
2026-06-01days on market $100,000 Active 13 DOM
-
2026-05-31days on market $100,000 Active 12 DOM
-
2026-05-30statusdays on market $100,000 Active 11 DOM
-
2026-05-19$100,000 New
ⓘ Source: listings_history table (triggers on properties + properties_extension) + one-shot
backfill from property_details.listing_events for pre-trigger history.
Tax reassessment forecast TX · Resets to sale price
- Current annual tax
- $1,662 · $139/mo
- Projected year-2 tax
- $1,830 · $152/mo
- Expected delta
- +$168/yr (+$14/mo · 10.1%)
ⓘ Screening estimate from a state-policy table — verify with the county assessor before closing.
Climate risk First Street
- Flood 1/10 Low FEMA zone X · 0% chance over 30 yrs
- Wildfire 7/10 Severe
- Heat 8/10 Severe 7 d/yr ≥111°F today · 21 d/yr by 30 yrs out
- Wind 6/10 Major 60% chance of damaging wind over 30 yrs
- Air quality 1/10 Low 0 unhealthy d/yr today · 0 by 30 yrs out
Nearby sold comps map
Loading sold comps map…
Walkable amenities ~0.75 mi
Loading nearby amenities…
Taxation est. · year 1
- Rental income
- $11,386
- − Mortgage interest
- −$5,602
- − Property taxes
- −$1,662
- − Insurance
- −$500
- − Repairs & maintenance
- −$911
- − Management
- −$911
- − Depreciation
- −$2,909
- Taxable loss
- −$1,109
- Est. tax savings @ 24.0%
- +$266
- After-tax cash flow
- $806/yr
For passive investors: Depreciation is non-cash, so a rental often shows a tax loss while cash-flowing — sheltering income. Rental losses are passive: they offset passive income freely, and up to $25,000/yr can offset ordinary (W-2) income if you actively participate and your MAGI is under $100k (phasing out to $0 by $150k); unused losses carry forward. On sale, claimed depreciation is recaptured at up to 25%, and gains may owe capital-gains tax (a 1031 exchange can defer both). Figures are a year-1 estimate at your 24.0% rate — not tax advice; consult a CPA.
Schools (NCES district)
- District
- Crystal City ISD
- NCES district ID
- 4815930
- Math proficiency
- 10% ▼ -19.00%
- Reading proficiency
- 22% ▼ -9.00%
- Median HH income
- $27,757
- Composite
- 12.43/100
- National rank
- #9631
- State rank
- #813 of 826 in TX
Livability — Crystal City
- Score
- 62/100
- State rank
- #910
- US rank
- #16330
Category grades
Schools grade is shown separately in the Schools card above.
Census & demographics
- Census place
- Crystal City, TX
- Population (ZIP)
- 7,333
Population outlook (Zavala County) Hauer SSP2
- Today (2025)
- 13,393 people
- By 2030
- 13,993 · +4.5%
- By 2040
- 15,186 · +13.4%
- By 2050
- 16,332 · +21.9%
- By 2075
- 18,742 · +39.9%
- By 2100
- 18,814 · +40.5%
Race, ethnicity, and origin ACS 2023
- Neighborhood character
- Predominantly Hispanic (92%)
- Race & ethnicity
- Hispanic / Latino 92% Two or more races 57% White 7%
- Hispanic origin (detail)
- Mexican 90%
- Foreign-born
- 6% · Canada
- Languages at home
- 26% English-only · Spanish 74%
Political lean MEDSL · Zavala
- 2024 margin
- D (+14.4) · D 56.8% · R 42.4%
- 2008→2024 swing
- -54.4pp toward R · 2008: 68.8pp · 2024: 14.4pp
- All cycles
- 2024: D+14.4 2020: D+31.4 2016: D+57.3 2012: D+67.6 2008: D+68.8
Not yet ingested
- Civics
- —
Market trends
- HPI YoY
- ▲ 5.02%
- Current HPI
- 134.0218
- Rent YoY
- —
- Metro
- —
- State GDP YoY
- ▲ 3.95%
- F500 in state
- 110
Industry mix (Fortune 500 HQ in TX)
| Industry | F500 HQs | Revenue |
|---|---|---|
| Energy | 16 | $1,198B |
|
||
| Technology | 5 | $198B |
|
||
| Engineering / Construction | 4 | $72B |
|
||
| Energy Services | 3 | $60B |
|
||
| Utilities | 3 | $41B |
|
||
| Healthcare | 2 | $330B |
|
||
Price history
1 event — show timeline
- 2026-05-19 Listed $100,000 LERA
Property tax history
+2.9%/yrLatest (2025): $1,662 · +17.5% YoY. Source: county tax records.
Cash-flow waterfall
monthlySold comps — $/sqft
last 12 mo · ≤1 miLoading sold comps…