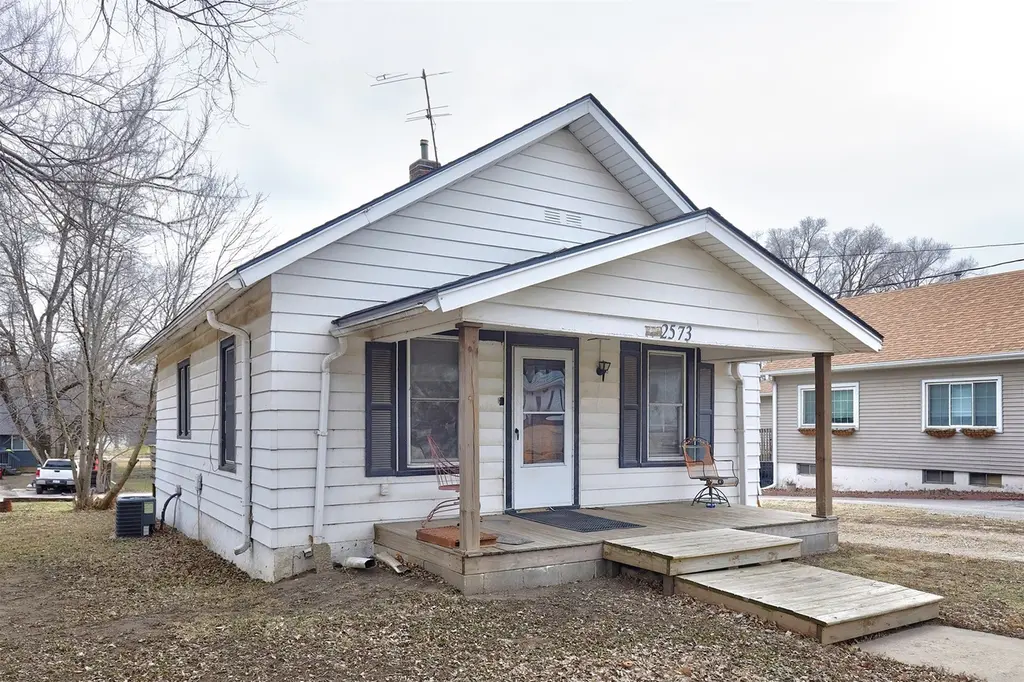
2573 Onawa St · Des Moines, IA
Flood risk 1/10 · Minimal
- FEMA flood zone
- X (unshaded)
- Chance of flooding over 30 yrs
- 0.0%
- Est. flood insurance / yr
- $473 – $860
Fire risk 2/10 · Minimal
- Est. fire insurance / yr
- $902 – $1,676
Heat risk 3/10 · Minor
- Hot days now (above 103°F)
- 7 days/yr
- Hot days in 30 yrs
- 15 days/yr
Wind risk 2/10 · Minimal
- Chance of severe wind over 30 yrs
- —
Air-quality risk 2/10 · Minimal
- Unhealthy air days now
- 1 days/yr
- Unhealthy air days in 30 yrs
- 2 days/yr
Risk factors via First Street. Map © Google.
Why this score? — see what drove the C+ grade
The composite is a weighted blend of 9 inputs, each scored 0–100. Each bar is that input's sub-score; the figure is the points it added to the 100-point composite (weight × sub-score).
- Cash flow +24.6/30.0
- ARV discount +11.0/15.0
- DSCR +7.9/10.0
- 1% rule +6.0/10.0
- Livability +4.0/5.0
- Schools +3.8/10.0
- Rent growth +3.1/5.0
- Condition / age +2.5/5.0
- Appreciation +0.0/10.0
$125,000
🖨 Deal sheet (PDF) 📄 Offer letter ✓ Due diligence
Listing remarks MLS
Attention Investors, this is a tenant occupied listing, with a current lease agreement that expires in May 2027. Seasoned or first time real estate investors! SELLER FINANCING OR CONTRACT TERMS may be available, making this an attractive option for buyers seeking flexible purchase terms, easier qualification, or creative financing solutions. This opens the door for first-time homebuyers, house hackers, and investors looking to acquire property with potentially lower upfront capital requirements. Excellent opportunity to own a 2-bedroom, 1 partial-bath home offering 768 square feet of efficient living space on a generous . 2690-acre lot, located just a couple blocks south of the new MLK Jr. Parkway with an easy 9-minute commute to downtown Des Moines per Google Maps. An open front porch adds charm and curb appeal, while off-street parking provides everyday convenience. Currently tenant-occupied at $1,050 per month, this property offers immediate cash flow potential for investors, along with long-term upside driven by continued development and infrastructure improvements along the MLK Jr. Parkway corridor. The large lot size creates flexibility for outdoor use, future expansion, or additional value-add strategies. Whether you’re searching for an affordable primary residence, a buy-and-hold rental, or a property to add to a growing portfolio, this home combines location, income potential, lot size, and financing flexibility in one opportunity.
Key facts
- 0.27 acre lot
- Garage
- Built 1918
Neighborhood map
What this means for you Summary
Snapshot
- This is a 2-bed/1.0-bath single-family listed at $125k.
Deal economics
- At list price, monthly cash flow is $258 ($3k/yr) — positive.
- The deal already cash-flows at list — no discount required.
- Meets the 1% rule at list price ($1k rent vs $125k).
- Recommended offer: $110k (12.0% below list) — sets the bar for market timing.
- Cap rate 8.8% vs local median 3.1% in Des Moines — top-decile yield for the area; either an underpriced asset or a hidden risk that comps aren't pricing in. Stress-test before assuming the spread holds.
Location & tenants
- Location reads 81/100 on livability (#63 in IA, #1,432 nationally) — a professional / high-income tenant draw. Strengths: commute A+, cost of living A+, housing A+; Watch: employment C-, schools D+, crime F.
- Des Moines Independent Community School District (urban): math 43% / reading 46% proficiency, ranked #289 of 289 in IA (top 100%) — families likely to look elsewhere, expect single-tenant / working-renter base with shorter leases; 63% free/reduced lunch — lower-income household profile, screen leases tightly.
- Market conditions: Rents rising (+2.3%/yr); 362 active listings in the ZIP; 3 comparable units currently listed for rent nearby; rentals lingering (median 45d on market — plan ~5-8 weeks vacancy on turnover, expect pricing pressure); 100% of comp listings sitting > 30 days — soft ceiling on asking rent; 2,953 units permitted in Polk County in 2024 (540 in 5+ unit buildings).
Forward outlook
- Local home prices are declining (-3.0%/yr); year-one equity from $864 of loan paydown is wiped out by about $4k of value loss. Plan a longer hold.
- Polk County population projected at +37% by 2050 — long-run rental-demand tailwind backs the buy-and-hold thesis.
Negotiation context
- It's been on market 121 days — a 12% lower offer ($110k) is reasonable based on typical stale-listing flexibility.
- 4 sale attempts since 13y ago with the ask held roughly flat each time — persistent listings suggest the price (not the market) is what's stuck; bring a comps-based counter.
Risks & watch-outs
- Watch-outs: built in 1918 — expect roof / HVAC / electrical / plumbing capex.
Questions for the listing agent
- It's been on market 121 days. Have you received any prior offers? Is the seller open to a 12% concession, seller financing, or rate buy-down credit?
- Built in 1918 — when were the roof, HVAC, electrical panel, plumbing, and water heater last replaced?
- Why hasn't it sold? Are there any deal-killer items the seller is aware of (foundation, flood, title, zoning, code violations)?
- Is there a deadline driving the sale (1031 exchange, divorce, estate, relocation)? That informs how much negotiation room exists.
- Schools are D-rated, which usually means shorter tenancies and higher turnover. Who's the typical renter profile here, and what's been the actual vacancy rate?
- Crime grade is F in this area — have there been break-ins, vandalism, or insurance claims at this property in the last 3 years? What carrier currently insures it and at what premium?
- What's the average days-on-market for RENTAL listings here right now (not sales)? A rising rental-DOM trend means longer vacancies and softer asking-rent achievability than the comps imply.
- What's the recent tenant-quality profile in this submarket — average credit score on applications, eviction rate, late-payment / NSF rate, and stable-employment percentage? A property-management company in the area should have these aggregated.
- How much new for-sale + rental construction is in the pipeline within 1–3 miles? Heavy new supply typically softens prices + rents 12–24 months out; constrained supply supports both.
Investment metrics
- 1% rule
- 1.10% ✓
- Cap rate
- 8.77%
- Cash-on-cash
- 8.86%
- DSCR
- 1.39
- GRM
- 7.6
CMA / ARV
- ARV (median comp)
- $135,495
- List price
- $125,000
- Delta
- -7.75%
- Verdict
- FAIR
- Comps
- 20 within 1.0 mi
Show comp detail 10 sales within ~0.75 mi
| Address | Dist | Beds/Ba | Sqft | Sold | Price | $/sf | Match |
|---|---|---|---|---|---|---|---|
| 722 SE 27th St | 0.10mi | 2/1.0 | 756 (-2%) | 1mo | $65,000 | $86 | 92 |
| 2553 Maury St | 0.07mi | 2/1.0 | 688 (-10%) | 0mo | $80,500 | $117 | 79 |
| 725 SE 27th St | 0.14mi | 2/1.0 | 756 (-2%) | 20mo | $141,000 | $187 | 75 |
| 2552 Onawa St | 0.06mi | 3/2.0 (+1) | 864 (+12%) | 4mo | $264,900 | $307 | 64 |
| 2613 E Elm St | 0.32mi | 2/1.0 | 844 (+10%) | 17mo | $132,500 | $157 | 54 |
| 638 SE 27th Ct | 0.20mi | 2/1.0 | 864 (+12%) | 21mo | $95,000 | $110 | 52 |
| 2618 Raccoon St | 0.29mi | 3/— (+1) | 875 (+14%) | 9mo | $120,000 | $137 | 51 |
| 626 SE 28th St | 0.27mi | 3/1.0 (+1) | 874 (+14%) | 20mo | $189,900 | $217 | 42 |
| 2616 Dean Ave | 0.72mi | 2/1.0 | 838 (+9%) | 14mo | $167,500 | $200 | 40 |
| 3041 Scott Ave | 0.64mi | 3/1.0 (+1) | 871 (+13%) | 24mo | $176,000 | $202 | 23 |
Match score weights: distance 35% · size 25% · config 20% · recency 20%. Top-matched comps best support the ARV.
Projected returns pro-forma
-3.0% appreciation · 2.29% rent growth · sell at horizon
- IRR
- -3.7%
- Equity multiple
- 0.86×
- Total profit
- $-4,780
- Equity at exit
- $18,638
- IRR
- 5.2%
- Equity multiple
- 1.37×
- Total profit
- $13,070
- Equity at exit
- $10,808
Cash invested: $35,000 (down + closing). Projections, not guarantees.
Landlord ↔ Tenant lean methodology
- Overall (STATE)
- 83 Strongly Landlord-Friendly
- State Iowa
- 83 Strongly Landlord-Friendly · R+6
- County
- — inherits STATE
- City
- — inherits STATE
ZIP-level market 50317
- Rents YoY
- 2.3%
- Active inventory
- 362
- Price-to-rent
- 7.6×
Monthly cashflow live
- Estimated rent
- $1,377 medium interval (Pro) →
- Mortgage (P&I)
- −$656
- Tax from tax record
- −$122 /mo · $1,462/yr
- Insurance
- −$52
- HOA
- −$0
- Vacancy / Maint / Mgmt
- −$289
- Net cashflow
- $258
Break-even live
Sensitivity live
| Price | -10% $329 | -5% $294 | +0% $258 | +5% $223 | +10% $188 |
|---|---|---|---|---|---|
| Rent | -10% $150 | -5% $204 | +0% $258 | +5% $313 | +10% $367 |
| Rate | -1.0pp $321 | -0.5pp $290 | base $258 | +0.5pp $226 | +1.0pp $193 |
UW: 25.0% down · 7.5% · 30yr · 1.5% tax · 5.0% vac · 8.0% maint · 8.0% mgmt
Financing live
Cash to close
- Down payment
- $31,250
- Closing costs
- $3,750
- Reserves months
- —
- Total cash needed
- —
Loan-product check · same deal, 3 products live
Conventional
25% down · 7.5% · 30yr
- Down + closing
- —
- Monthly P&I
- —
- Monthly cashflow
- —
- DSCR
- —
- Eligible?
- —
Personal DTI + credit; lowest rate.
DSCR
20% down · 8.5% · 30yr
- Down + closing
- —
- Monthly P&I
- —
- Monthly cashflow
- —
- DSCR
- —
- Eligible?
- —
No personal income docs; deal must DSCR.
Hard money
10% down · 12.0% · 12mo
- Down + closing
- —
- Monthly P&I
- —
- Monthly cashflow
- —
- DSCR
- —
- Eligible?
- —
Short-term bridge; refi at stabilization.
Rent comps 3 comps
| Address | Beds | Baths | Sqft | Rent | $/sqft | DOM | Units | Dist |
|---|---|---|---|---|---|---|---|---|
| 2120 Capitol Ave Des Moines, IA | 3.0 | 1.0 | 973 | $1,395 | $1.43 | 45d | 1 | 1.10mi |
| 2726 Des Moines St Des Moines, IA | 2.0 | 1.0 | 975 | $1,295 | $1.33 | 45d | 1 | 1.10mi |
| 410 E 17th St Des Moines, IA | 3.0 | 1.0 | 1000 | $1,695 | $1.70 | 45d | 1 | 1.47mi |
Listing history 7 events
-
2026-01-23$125,000 Active 1470-char remark
Show marketing remark (1470 chars)
Attention Investors, this is a tenant occupied listing, with a current lease agreement that expires in May 2027. Seasoned or first time real estate investors! SELLER FINANCING OR CONTRACT TERMS may be available, making this an attractive option for buyers seeking flexible purchase terms, easier qualification, or creative financing solutions. This opens the door for first-time homebuyers, house hackers, and investors looking to acquire property with potentially lower upfront capital requirements. Excellent opportunity to own a 2-bedroom, 1 partial-bath home offering 768 square feet of efficient living space on a generous . 2690-acre lot, located just a couple blocks south of the new MLK Jr. Parkway with an easy 9-minute commute to downtown Des Moines per Google Maps. An open front porch adds charm and curb appeal, while off-street parking provides everyday convenience. Currently tenant-occupied at $1,050 per month, this property offers immediate cash flow potential for investors, along with long-term upside driven by continued development and infrastructure improvements along the MLK Jr. Parkway corridor. The large lot size creates flexibility for outdoor use, future expansion, or additional value-add strategies. Whether you’re searching for an affordable primary residence, a buy-and-hold rental, or a property to add to a growing portfolio, this home combines location, income potential, lot size, and financing flexibility in one opportunity.
-
2024-03-29historical
-
2024-02-13$120,000 Active
-
2015-11-17historical
-
2015-05-19$65,000
-
2013-12-04historical
-
2013-07-09$55,000
ⓘ Source: listings_history table (triggers on properties + properties_extension) + one-shot
backfill from property_details.listing_events for pre-trigger history.
Tax reassessment forecast IA · Partial reset (capped growth)
- Current annual tax
- $1,462 · $122/mo
- Projected year-2 tax
- $1,712 · $143/mo
- Expected delta
- +$250/yr (+$21/mo · 17.1%)
ⓘ Screening estimate from a state-policy table — verify with the county assessor before closing.
Climate risk First Street
- Flood 1/10 Low FEMA zone X (unshaded) · 0% chance over 30 yrs
- Wildfire 2/10 Low
- Heat 3/10 Moderate 7 d/yr ≥103°F today · 15 d/yr by 30 yrs out
- Wind 2/10 Low
- Air quality 2/10 Low 1 unhealthy d/yr today · 2 by 30 yrs out
Nearby sold comps map
Loading sold comps map…
Walkable amenities ~0.75 mi
Loading nearby amenities…
Taxation est. · year 1
- Rental income
- $16,523
- − Mortgage interest
- −$7,002
- − Property taxes
- −$1,462
- − Insurance
- −$625
- − Repairs & maintenance
- −$1,322
- − Management
- −$1,322
- − Depreciation
- −$3,636
- Taxable income
- $1,154
- Est. tax owed @ 24.0%
- −$277
- After-tax cash flow
- $2,823/yr
For passive investors: Depreciation is non-cash, so a rental often shows a tax loss while cash-flowing — sheltering income. Rental losses are passive: they offset passive income freely, and up to $25,000/yr can offset ordinary (W-2) income if you actively participate and your MAGI is under $100k (phasing out to $0 by $150k); unused losses carry forward. On sale, claimed depreciation is recaptured at up to 25%, and gains may owe capital-gains tax (a 1031 exchange can defer both). Figures are a year-1 estimate at your 24.0% rate — not tax advice; consult a CPA.
Schools (NCES district)
- District
- Des Moines Independent Community School District
- NCES district ID
- 1908970
- Math proficiency
- 43% ▼ -6.00%
- Reading proficiency
- 46% ▼ -1.00%
- Median HH income
- $45,905
- Composite
- 37.83/100
- National rank
- #4331
- State rank
- #289 of 289 in IA
Livability — Des Moines
- Score
- 81/100
- State rank
- #63
- US rank
- #1432
Category grades
Schools grade is shown separately in the Schools card above.
Census & demographics
- Census place
- Des Moines, IA
- County
- Polk County · 453,298 people
- City population
- 203,612
- Metro
- Des Moines-West Des Moines, IA
- Population (ZIP)
- 36,548
- Household income
- $65,617
- Rent vs Own
- Severe rent burden
- 716.0
Population outlook (Polk County) Hauer SSP2
- Today (2025)
- 548,042 people
- By 2030
- 588,557 · +7.4%
- By 2040
- 670,629 · +22.4%
- By 2050
- 752,830 · +37.4%
- By 2075
- 955,069 · +74.3%
- By 2100
- 1,115,436 · +103.5%
Race, ethnicity, and origin ACS 2023
- Neighborhood character
- Majority White (65%)
- Race & ethnicity
- White 65% Hispanic / Latino 19% Two or more races 10% Black 10% Asian 3%
- Hispanic origin (detail)
- Mexican 15% Puerto Rican 1%
- Common ancestry
- Portuguese 3% Iranian 2% Swiss 1%
- Foreign-born
- 12% · Canada
- Languages at home
- 80% English-only · Spanish 13% Other Asian/Pacific 2%
Political lean MEDSL · Polk
- 2024 margin
- D (+10.9) · D 54.8% · R 43.9% · Other 1.3%
- 2008→2024 swing
- -3.7pp toward R · 2008: 14.6pp · 2024: 10.9pp
- All cycles
- 2024: D+10.9 2020: D+15.2 2016: D+11.5 2012: D+14.2 2008: D+14.6
Not yet ingested
- Civics
- —
Market trends
- HPI YoY
- ▼ -235.00%
- Current HPI
- 281.7409
- Rent YoY
- ▲ 2.29%
- Metro
- Des Moines-West Des Moines, IA
- State GDP YoY
- ▲ 2.48%
- F500 in state
- 4
Industry mix (Fortune 500 HQ in IA)
| Industry | F500 HQs | Revenue |
|---|---|---|
| Financial Services | 1 | $16B |
|
||
| Retail / Convenience | 1 | $15B |
|
||
Price history
+127.3% since first listed7 events — show timeline
- 2026-01-23 Listed $125,000 DMMLS
- 2024-03-29 Listing Removed — DMMLS
- 2024-02-13 Listed $120,000 DMMLS
- 2015-11-17 Listing Removed — DMMLS
- 2015-05-19 Listed $65,000 DMMLS
- 2013-12-04 Listing Removed — DMMLS
- 2013-07-09 Listed $55,000 DMMLS
Property tax history
+1.4%/yrLatest (2025): $1,462 · +2.1% YoY. Source: county tax records.
Cash-flow waterfall
monthlySold comps — $/sqft
last 12 mo · ≤1 miLoading sold comps…