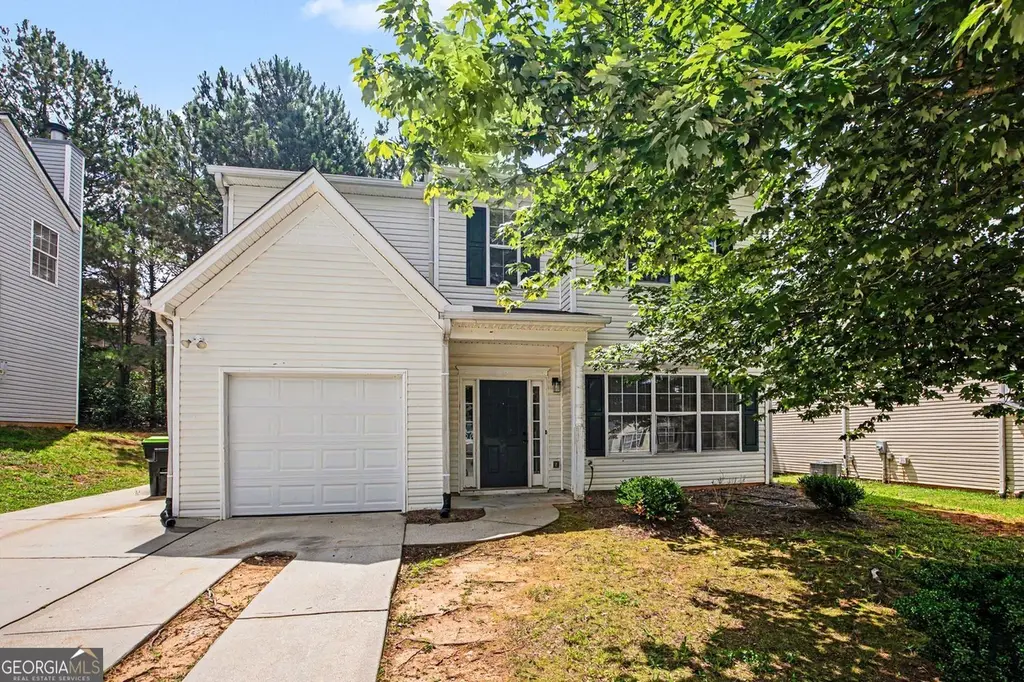
4518 Swan Trce · Union City, GA
Flood risk 1/10 · Minimal
- FEMA flood zone
- X (unshaded)
- Chance of flooding over 30 yrs
- 0.0%
- Est. flood insurance / yr
- $507 – $1,088
Fire risk 3/10 · Minor
- Est. fire insurance / yr
- $963 – $1,789
Heat risk 6/10 · Moderate
- Hot days now (above 103°F)
- 7 days/yr
- Hot days in 30 yrs
- 19 days/yr
Wind risk 6/10 · Moderate
- Chance of severe wind over 30 yrs
- 27.0%
Air-quality risk 3/10 · Minor
- Unhealthy air days now
- 3 days/yr
- Unhealthy air days in 30 yrs
- 4 days/yr
Risk factors via First Street. Map © Google.
Why this score? — see what drove the C+ grade
The composite is a weighted blend of 9 inputs, each scored 0–100. Each bar is that input's sub-score; the figure is the points it added to the 100-point composite (weight × sub-score).
- Cash flow +19.5/30.0
- ARV discount +11.8/15.0
- Appreciation +10.0/10.0
- DSCR +6.2/10.0
- 1% rule +4.6/10.0
- Schools +4.5/10.0
- Livability +2.9/5.0
- Rent growth +2.7/5.0
- Condition / age +2.5/5.0
$225,000
🖨 Deal sheet (PDF) 📄 Offer letter ✓ Due diligence
Listing remarks MLS
Discover the freedom of homeownership with NO HOA at 4518 Swan Trace in Atlanta! This charming home offers a spacious floor plan, comfortable living spaces, and endless potential for buyers looking to add their personal touch. Whether you're a first-time homebuyer, investor, or someone simply looking for a property without community restrictions, this home is a rare find. Enjoy the flexibility to park your vehicles, personalize your property, and live without monthly HOA fees or HOA regulations. Conveniently located near shopping, dining, schools, parks, and major highways, you'll have easy access to everything Atlanta has to offer. Property is being sold AS-IS. Opportunities like this don't come along often-schedule your showing today and experience the benefits of NO HOA living!
Key facts
- Spacious floor plan
- No hoa
- 6,011 sq ft lot
Tags
Property features AI
Exterior
- Parking: Garage (1 space); Total parking for 1 vehicle
- Utilities: Public water; Public sewer; 220-volt electric service; Other utilities
- Home design: Two levels; Resale property; Composition roof
- Construction: Vinyl siding; Slab foundation; Other additional structures
- Exterior features: Other exterior features
Interior
- Kitchen: White cabinets; Other appliances
- Bedrooms: Three upper-level bedrooms; Bedrooms with no special features listed
- Flooring: Carpet; Vinyl
- Bathrooms: Two full bathrooms; One half bathroom; Master bath with double vanity
- Heating & cooling: Central heating; Central air conditioning
- Interior features: One fireplace located in the living room; Double-pane windows; Other interior features
- Laundry & utility: Laundry area (other features)
Neighborhood map
What this means for you Summary
Snapshot
- This is a 4-bed/2.5-bath single-family listed at $225k.
Deal economics
- At list price, monthly cash flow is $255 ($3k/yr) — positive.
- The deal already cash-flows at list — no discount required.
- To meet the 1% rule (rent ≥ 1% of price), the offer needs to be $215k (4.3% below list).
- Recommended offer: $215k (4.3% below list) — sets the bar for 1% rule.
- Cap rate 7.7% vs local median 5.4% in Union City — top-decile yield for the area; either an underpriced asset or a hidden risk that comps aren't pricing in. Stress-test before assuming the spread holds.
Location & tenants
- Location reads 58/100 on livability (#443 in GA) — a working-class tenant base; expect higher turnover. Strengths: cost of living A+, housing A+; Watch: crime D+, amenities F, commute F.
- Fulton County (suburban): math 49% / reading 53% proficiency, ranked #12 of 174 in GA (top 7%) — acceptable for families but not a draw, mixed tenant base, ~2y average lease.
- Zoned schools: Liberty Point Elementary School (math 37% / reading 31%, grade F, #554 of 1,228 statewide, top 46%, 694 students, 100% FRL); Renaissance Middle School (math 22% / reading 27%, grade F, #301 of 470 statewide, top 66%, 1,166 students, 71% FRL); Langston Hughes High School (math 8% / reading 17%, grade F, #336 of 424 statewide, top 80%, 1,964 students, 65% FRL) — zoned schools average 78% FRL vs 41% district-wide (37 pts higher); higher-poverty schools than district average — tighter screening recommended.
- Zoned-school proficiency averages 24% at this address vs 51% district-wide (-27 pts) — the specific schools serving this property underperform the Fulton County average; the district grade overstates school quality for this exact location.
- Market conditions: Rents flat; 656 active listings in the ZIP; 34 comparable units currently listed for rent nearby; rentals at typical pace (median 27d on market — plan ~3-4 weeks tenant-placement turnaround); 11,565 units permitted in Fulton County in 2024 (8,159 in 5+ unit buildings).
Forward outlook
- In year one you build about $24k of equity ($2k loan paydown + $22k appreciation (10.0% local appreciation)).
- Fulton County population projected at +38% by 2050 — long-run rental-demand tailwind backs the buy-and-hold thesis.
- At projected returns (10.0% appreciation + 0.9% rent growth), your $63k cash investment doubles in ~3 years — after that, you're playing with house money.
- By year 2, paydown + projected appreciation supports a ~$39k cash-out refi (75% LTV) — recoverable capital for the next deal without selling this one.
Negotiation context
- It's been on market 16 days — a 2% lower offer ($222k) is reasonable based on typical stale-listing flexibility.
- 5 sale attempts with the ask held roughly flat each time — persistent listings suggest the price (not the market) is what's stuck; bring a comps-based counter.
Risks & watch-outs
- Climate carrying-cost: major wind risk, 27% chance of damaging wind over 30y; extreme-heat days projected 7→19/yr by 2055 (HVAC capex compounding) — expect insurance premiums to compound above CPI over the hold.
Questions for the listing agent
- Is there a deadline driving the sale (1031 exchange, divorce, estate, relocation)? That informs how much negotiation room exists.
- Schools are F-rated, which usually means shorter tenancies and higher turnover. Who's the typical renter profile here, and what's been the actual vacancy rate?
- Crime grade is D in this area — have there been break-ins, vandalism, or insurance claims at this property in the last 3 years? What carrier currently insures it and at what premium?
- What's the average days-on-market for RENTAL listings here right now (not sales)? A rising rental-DOM trend means longer vacancies and softer asking-rent achievability than the comps imply.
- What's the recent tenant-quality profile in this submarket — average credit score on applications, eviction rate, late-payment / NSF rate, and stable-employment percentage? A property-management company in the area should have these aggregated.
- How much new for-sale + rental construction is in the pipeline within 1–3 miles? Heavy new supply typically softens prices + rents 12–24 months out; constrained supply supports both.
Investment metrics
- 1% rule
- 0.96% ✗
- Cap rate
- 7.65%
- Cash-on-cash
- 4.86%
- DSCR
- 1.22
- GRM
- 8.7
CMA / ARV
- ARV (on-the-fly)
- $248,640
- Comps found
- 12
Show comp detail 12 sales within ~0.75 mi
| Address | Dist | Beds/Ba | Sqft | Sold | Price | $/sf | Match |
|---|---|---|---|---|---|---|---|
| 4510 Swan Trce | 0.05mi | 3/2.5 (-1) | 1,744 (+4%) | 4mo | $200,000 | $115 | 83 |
| 4410 Roche St | 0.08mi | 3/3.5 (-1) | 1,680 (0%) | 6mo | $235,000 | $140 | 82 |
| 4108 Robin Cir | 0.13mi | 3/2.5 (-1) | 1,786 (+6%) | 3mo | $240,000 | $134 | 76 |
| 10314 Deep Creek Cv | 0.33mi | 3/2.5 (-1) | 1,721 (+2%) | 7mo | $210,000 | $122 | 70 |
| 4040 Robin Cir | 0.15mi | 3/2.5 (-1) | 1,644 (-2%) | 21mo | $244,000 | $148 | 67 |
| 5945 Raventree Ct | 0.60mi | 4/2.0 | 1,724 (+3%) | 2mo | $265,000 | $154 | 64 |
| 4121 Ravenwood Ct | 0.37mi | 3/3.0 (-1) | 1,556 (-7%) | 4mo | $232,000 | $149 | 60 |
| 4654 Ravenwood Loop | 0.66mi | 3/2.5 (-1) | 1,711 (+2%) | 3mo | $230,000 | $134 | 58 |
| 4205 Reeshemah St | 0.12mi | 4/3.0 | 1,881 (+12%) | 18mo | $290,000 | $154 | 57 |
| 3426 Newgold Trce | 0.63mi | 3/2.5 (-1) | 1,832 (+9%) | 5mo | $265,000 | $145 | 47 |
| 9441 Lakeview Rd | 0.45mi | 3/2.5 (-1) | 1,550 (-8%) | 20mo | $250,700 | $162 | 45 |
| 4432 Ravenwood Dr | 0.68mi | 3/2.5 (-1) | 1,479 (-12%) | 17mo | $249,900 | $169 | 29 |
Match score weights: distance 35% · size 25% · config 20% · recency 20%. Top-matched comps best support the ARV.
Projected returns pro-forma
10.0% appreciation · 0.95% rent growth · sell at horizon
- IRR
- 27.1%
- Equity multiple
- 3.13×
- Total profit
- $134,401
- Equity at exit
- $202,698
- IRR
- 23.1%
- Equity multiple
- 6.95×
- Total profit
- $374,834
- Equity at exit
- $437,126
Cash invested: $63,000 (down + closing). Projections, not guarantees.
Landlord ↔ Tenant lean methodology
- Overall (STATE)
- 90 Strongly Landlord-Friendly
- State Georgia
- 90 Strongly Landlord-Friendly · R+3
- County
- — inherits STATE
- City
- — inherits STATE
ZIP-level market 30349
- Home prices YoY
- 4.6%
- Rents YoY
- 0.9%
- Active inventory
- 656
- Price-to-rent
- 8.7×
Monthly cashflow live
- Estimated rent
- $2,152 high interval (Pro) →
- Mortgage (P&I)
- −$1,180
- Tax from tax record
- −$172 /mo · $2,059/yr
- Insurance
- −$94
- HOA
- −$0
- Lot rent
- −$0
- Vacancy / Maint / Mgmt
- −$452
- Net cashflow
- $255
Break-even live
Sensitivity live
| Price | -10% $382 | -5% $319 | +0% $255 | +5% $191 | +10% $128 |
|---|---|---|---|---|---|
| Rent | -10% $85 | -5% $170 | +0% $255 | +5% $340 | +10% $425 |
| Rate | -1.0pp $368 | -0.5pp $312 | base $255 | +0.5pp $197 | +1.0pp $137 |
UW: 25.0% down · 7.5% · 30yr · 1.5% tax · 5.0% vac · 8.0% maint · 8.0% mgmt
Financing live
Cash to close
- Down payment
- $56,250
- Closing costs
- $6,750
- Reserves months
- —
- Total cash needed
- —
Loan-product check · same deal, 3 products live
Conventional
25% down · 7.5% · 30yr
- Down + closing
- —
- Monthly P&I
- —
- Monthly cashflow
- —
- DSCR
- —
- Eligible?
- —
Personal DTI + credit; lowest rate.
DSCR
20% down · 8.5% · 30yr
- Down + closing
- —
- Monthly P&I
- —
- Monthly cashflow
- —
- DSCR
- —
- Eligible?
- —
No personal income docs; deal must DSCR.
Hard money
10% down · 12.0% · 12mo
- Down + closing
- —
- Monthly P&I
- —
- Monthly cashflow
- —
- DSCR
- —
- Eligible?
- —
Short-term bridge; refi at stabilization.
Rent comps 34 comps
| Address | Beds | Baths | Sqft | Rent | $/sqft | DOM | Units | Dist |
|---|---|---|---|---|---|---|---|---|
| 4420 Roche St Atlanta, GA | 3.0 | 2.5 | 1622 | $2,130 | $1.31 | 46d | 1 | 0.06mi |
| 4095 Robin Cir Atlanta, GA | 3.0 | 2.5 | 2196 | $2,023 | $0.92 | 46d | 1 | 0.07mi |
| 4223 Reeshemah St Atlanta, GA | 3.0 | 2.5 | 1843 | $1,995 | $1.08 | 7d | 1 | 0.08mi |
| 4064 Robin Cir Atlanta, GA | 3.0 | 2.5 | 1874 | $1,895 | $1.01 | 26d | 1 | 0.09mi |
| 4062 Robin Cir Atlanta, GA | 3.0 | 3.0 | 1874 | $1,910 | $1.02 | 26d | 1 | 0.10mi |
| 4407 Roche St Atlanta, GA | 3.0 | 2.0 | 1650 | $1,875 | $1.14 | 46d | 1 | 0.10mi |
| 4056 Robin Cir Atlanta, GA | 3.0 | 2.5 | 1174 | $1,895 | $1.61 | 26d | 1 | 0.12mi |
| 4108 Robin Cir Atlanta, GA | 3.0 | 2.5 | 1786 | $2,400 | $1.34 | 46d | 1 | 0.15mi |
| 4122 Ravenwood Ct Union City, GA | 3.0 | 3.0 | 1394 | $1,849 | $1.33 | 26d | 1 | 0.40mi |
| 4509 Ravenwood Pl Union City, GA | 3.0 | 2.5 | 1394 | $1,970 | $1.41 | 15d | 1 | 0.43mi |
| 12076 Crosswicks Rd Union City, GA | 3.0–4.0 | 2.0–2.5 | 1617 | $2,831 | $1.75 | 1d | 5 | 0.67mi |
| 4666 Ravenwood Loop Union City, GA | 4.0 | 3.0 | 1916 | $2,175 | $1.14 | 26d | 1 | 0.71mi |
| 12006 Crosswicks Rd Unit 105 Union City, GA | 3.0 | 2.5 | 1413 | $2,455 | $1.74 | 46d | 1 | 0.71mi |
| 12006 Crosswicks Rd Union City, GA | 3.0 | 2.0 | 1413 | $2,545 | $1.80 | 17d | 1 | 0.71mi |
| 12006 Crosswicks Rd Union City, GA | 4.0 | 3.0 | 1821 | $3,468 | $1.90 | 46d | 1 | 0.71mi |
| 12006 Crosswicks Rd Unit Sunshine Union City, GA | 4.0 | 2.5 | 1821 | $2,770 | $1.52 | 6d | 1 | 0.72mi |
| 4681 Ravenwood Loop Union City, GA | 4.0 | 2.5 | 1593 | $1,999 | $1.25 | 46d | 1 | 0.76mi |
| 3206 Diamond Blf Union City, GA | 5.0 | 2.0 | 1900 | $2,275 | $1.20 | 26d | 1 | 0.80mi |
| 4497 Ravenwood Dr Union City, GA | 3.0 | 2.5 | 1694 | $2,000 | $1.18 | 46d | 1 | 0.84mi |
| 4497 Ravenwood Dr Union City, GA | 3.0 | 2.5 | 1694 | $2,000 | $1.18 | 23d | 1 | 0.84mi |
| 3228 Diamond Blf Union City, GA | 4.0 | 2.5 | 1922 | $2,195 | $1.14 | 46d | 1 | 0.84mi |
| 3234 Diamond Blf Union City, GA | 4.0 | 2.5 | 1922 | $2,360 | $1.23 | 7d | 1 | 0.85mi |
| 8317 Hunters Grove Rd Union City, GA | 4.0 | 2.5 | 1821 | $5,500 | $3.02 | 46d | 1 | 1.00mi |
| 6329 Wellington Dr Union City, GA | 4.0 | 2.5 | 1227 | $1,700 | $1.39 | 1d | 1 | 1.06mi |
| 5791 Blacktop Ct Fairburn, GA | 4.0 | 2.5 | 1991 | $2,423 | $1.22 | 46d | 1 | 1.08mi |
| 3416 Stonewall Ct Atlanta, GA | 3.0 | 2.5 | 1690 | $2,450 | $1.45 | 26d | 1 | 1.22mi |
| 5458 Union Hill Ct Union City, GA | 3.0 | 2.5 | 1650 | $2,011 | $1.22 | 1d | 1 | 1.26mi |
| 5548 Union Pointe Pl Union City, GA | 4.0 | 2.5 | 1763 | $2,400 | $1.36 | 46d | 1 | 1.29mi |
| 5530 Union Pointe Pl Union City, GA | 3.0 | 2.0 | 1293 | $1,650 | $1.28 | 20d | 1 | 1.32mi |
| 6115 Forrest Ave Union City, GA | 4.0 | 2.0 | 1368 | $1,690 | $1.24 | 46d | 1 | 1.38mi |
| 4812 Station Ln Atlanta, GA | 3.0 | 2.5 | 1695 | $2,100 | $1.24 | 4d | 1 | 1.38mi |
| 5950 Stonewall Dr Unit 4 Union City, GA | 3.0 | 1.0 | 1320 | $1,425 | $1.08 | 1d | 1 | 1.39mi |
| 5950 Stonewall Dr Unit 2 Union City, GA | 3.0 | 1.5 | 1320 | $1,495 | $1.13 | 17d | 1 | 1.39mi |
| 5131 Forest Downs Ln Atlanta, GA | 4.0 | 2.0 | 2112 | $1,580 | $0.75 | 6d | 1 | 1.48mi |
Listing history 13 events
-
2026-06-22statusdays on market $225,000 Pending 16 DOM
-
2026-06-22status $225,000 Active 15 DOM
-
2026-06-18status $225,000 Pending 15 DOM
-
2026-06-18days on market $225,000 Active 15 DOM
-
2026-06-17days on market $225,000 Active 14 DOM
-
2026-06-16days on market $225,000 Active 13 DOM
-
2026-06-15days on market $225,000 Active 12 DOM
-
2026-06-13days on market $225,000 Active 10 DOM
-
2026-06-09days on market $225,000 Active 6 DOM
-
2026-06-08days on market $225,000 Active 5 DOM
-
2026-06-07days on market $225,000 Active 4 DOM
-
2026-06-04remarks 687-char remark
-
2026-06-04$225,000 Active 1 DOM
ⓘ Source: listings_history table (triggers on properties + properties_extension) + one-shot
backfill from property_details.listing_events for pre-trigger history.
Tax reassessment forecast GA · Resets to sale price
- Current annual tax
- $2,059 · $172/mo
- Projected year-2 tax
- $2,070 · $172/mo
- Expected delta
- +$11/yr (+$1/mo · 0.5%)
ⓘ Screening estimate from a state-policy table — verify with the county assessor before closing.
Climate risk First Street
- Flood 1/10 Low FEMA zone X (unshaded) · 0% chance over 30 yrs
- Wildfire 3/10 Moderate
- Heat 6/10 Major 7 d/yr ≥103°F today · 19 d/yr by 30 yrs out
- Wind 6/10 Major 27% chance of damaging wind over 30 yrs
- Air quality 3/10 Moderate 3 unhealthy d/yr today · 4 by 30 yrs out
Nearby sold comps map
Loading sold comps map…
Walkable amenities ~0.75 mi
Loading nearby amenities…
Taxation est. · year 1
- Rental income
- $25,827
- − Mortgage interest
- −$12,603
- − Property taxes
- −$2,059
- − Insurance
- −$1,125
- − Repairs & maintenance
- −$2,066
- − Management
- −$2,066
- − Depreciation
- −$6,545
- Taxable loss
- −$638
- Est. tax savings @ 24.0%
- +$153
- After-tax cash flow
- $3,214/yr
For passive investors: Depreciation is non-cash, so a rental often shows a tax loss while cash-flowing — sheltering income. Rental losses are passive: they offset passive income freely, and up to $25,000/yr can offset ordinary (W-2) income if you actively participate and your MAGI is under $100k (phasing out to $0 by $150k); unused losses carry forward. On sale, claimed depreciation is recaptured at up to 25%, and gains may owe capital-gains tax (a 1031 exchange can defer both). Figures are a year-1 estimate at your 24.0% rate — not tax advice; consult a CPA.
Schools (NCES district)
- District
- Fulton County
- NCES district ID
- 1302280
- Math proficiency
- 49% ▼ -2.00%
- Reading proficiency
- 53% ▬ 0.00%
- Median HH income
- $68,035
- Composite
- 45.33/100
- National rank
- #2640
- State rank
- #12 of 174 in GA
Livability — Union City
- Score
- 58/100
- State rank
- #443
- US rank
- #21281
Category grades
Schools grade is shown separately in the Schools card above.
Census & demographics
- Census place
- Union City, GA
- County
- Fulton County · 1,094,430 people
- City population
- 25,130
- Metro
- Atlanta-Sandy Springs-Alpharetta, GA
- Population (ZIP)
- 79,872
- Household income
- $67,023
- Rent vs Own
- Severe rent burden
- 4258.0
Population outlook (Fulton County) Hauer SSP2
- Today (2025)
- 1,203,707 people
- By 2030
- 1,299,706 · +8.0%
- By 2040
- 1,488,256 · +23.6%
- By 2050
- 1,664,580 · +38.3%
- By 2075
- 2,036,072 · +69.2%
- By 2100
- 2,222,402 · +84.6%
Race, ethnicity, and origin ACS 2023
- Neighborhood character
- Predominantly Black (89%)
- Race & ethnicity
- Black 89% Hispanic / Latino 5% Two or more races 4% White 3%
- Foreign-born
- 9% · Canada
- Languages at home
- 88% English-only · Spanish 6% French/Haitian/Cajun 1%
Political lean MEDSL · Fulton
- 2024 margin
- Solid D (+44.9) · D 71.9% · R 27.0% · Other 1.1%
- 2008→2024 swing
- +9.8pp toward D · 2008: 35.0pp · 2024: 44.9pp
- All cycles
- 2024: D+44.9 2020: D+46.4 2016: D+42.1 2012: D+29.6 2008: D+35.0
Not yet ingested
- Civics
- —
Market trends
- HPI YoY
- ▲ 18.01%
- Current HPI
- 407.99
- Rent YoY
- ▲ 0.95%
- Metro
- Atlanta-Sandy Springs-Alpharetta, GA
- State GDP YoY
- ▲ 2.66%
- F500 in state
- 28
Industry mix (Fortune 500 HQ in GA)
| Industry | F500 HQs | Revenue |
|---|---|---|
| Paper / Packaging | 2 | $29B |
|
||
| Retail | 1 | $160B |
|
||
| Transportation / Logistics | 1 | $91B |
|
||
| Airlines | 1 | $62B |
|
||
| Consumer Goods | 1 | $47B |
|
||
| Utilities | 1 | $25B |
|
||
Price history
+11150.0% since first listed10 events — show timeline
- 2026-06-03 Listed $225,000 GAMLS
- 2026-06-03 Listed $225,000 FMLS
- 2025-08-04 Rental Removed $1,650 RENTALBEAST
- 2025-08-01 Listed for Rent $1,650 RENTALBEAST
- 2025-07-31 Rental Removed $1,650 RentEngineListings
- 2025-07-26 Listed for Rent $1,650 RentEngineListings
- 2025-07-18 Rental Removed $1,800 PROPERTYWARE
- 2025-07-03 Price Changed $1,800 PROPERTYWARE
- 2025-06-25 Price Changed $1,900 PROPERTYWARE
- 2025-06-15 Listed for Rent $2,000 PROPERTYWARE
Property tax history
+4.8%/yrLatest (2025): $2,059 · +123.2% YoY. Source: county tax records.
Cash-flow waterfall
monthlySold comps — $/sqft
last 12 mo · ≤1 miLoading sold comps…