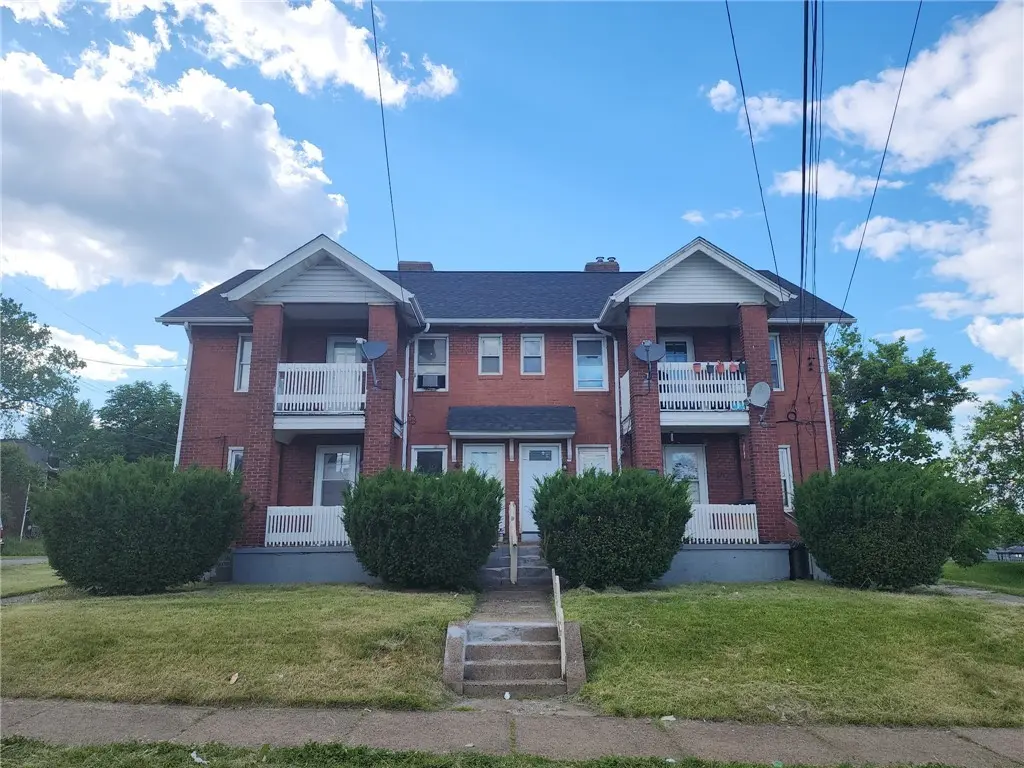
 Fourplex
816-822 Crawford Ave · Duquesne, PA
Flood risk 1/10 · Minimal
- FEMA flood zone
- X (unshaded)
- Chance of flooding over 30 yrs
- 0.0%
- Est. flood insurance / yr
- $473 – $860
Fire risk 1/10 · Minimal
- Est. fire insurance / yr
- $511 – $949
Heat risk 4/10 · Minor
- Hot days now (above 97°F)
- 7 days/yr
- Hot days in 30 yrs
- 18 days/yr
Wind risk 2/10 · Minimal
- Chance of severe wind over 30 yrs
- 0.0%
Air-quality risk 4/10 · Minor
- Unhealthy air days now
- 4 days/yr
- Unhealthy air days in 30 yrs
- 5 days/yr
Risk factors via First Street. Map © Google.
Why this score? — see what drove the B- grade
The composite is a weighted blend of 9 inputs, each scored 0–100. Each bar is that input's sub-score; the figure is the points it added to the 100-point composite (weight × sub-score).
- Cash flow +30.0/30.0
- 1% rule +10.0/10.0
- DSCR +10.0/10.0
- ARV discount +7.5/15.0
- Livability +3.4/5.0
- Rent growth +2.5/5.0
- Condition / age +2.2/5.0
- Appreciation +2.1/10.0
- Schools +1.3/10.0
$238,000
🖨 Deal sheet 📄 Offer letter ✓ Due diligence
Multi-family units
County records classify this as Multi-Family (2-4 Unit). Listing-text estimate: 4 units. confirmed
Listing remarks MLS
Separate entrance and utilities. Tenant pay all utilities. To be sold as is. Taxes and lot size are estimed. All sales and condition subject to third party approval.
Key facts
- Large corner lot
- Newer roof
- Newer hvac systems
Tags
Property features AI
Finance
- Financial info: Gross annual income reported at $34,835; Unit rents reported approximately $825, $761.25, $656.25, and $660.38
Exterior
- Utilities: Electricity available; Natural gas available; Public water available; Sewer available
- Home design: Multi-family property (4 units)
- Construction: Brick construction; Asphalt roof
- Exterior features: Multipurpose/multi-unit zoning; Public transportation nearby
Interior
- Bedrooms: Four 2-bedroom units
- Bathrooms: One unit with 2 full bathrooms; three units with 1 full bathroom each
- Interior features: Basement present
Neighborhood map
What this means for you Summary
Snapshot
- This is a 4 × 2-bed/1.2-bath units multifamily listed at $238k. Condition is rated fair.
Deal economics
- At list price, monthly cash flow is $2k ($26k/yr) — positive. Per door: $549/mo.
- The deal already cash-flows at list — no discount required.
- Meets the 1% rule at list price ($5k rent vs $238k).
- Recommended offer: $234k (1.5% below list) — sets the bar for market timing.
Location & tenants
- Location reads 68/100 on livability (#927 in PA) — a middle-class / working-renter tenant base. Strengths: commute A+, cost of living A+, housing A+; Watch: health & safety D+, schools F, crime F.
- Duquesne City SD (suburban): math 10% / reading 15% proficiency, ranked #611 of 658 in PA (top 93%) — low school quality limits family demand, transient renter base, plan for 1-2y turnover; 97% free/reduced lunch — lower-income household profile, screen leases tightly.
- Market conditions: 19 active listings in the ZIP; 2,996 units permitted in Allegheny County in 2024 (1,588 in 5+ unit buildings).
Forward outlook
- Local home prices are declining (-3.0%/yr); year-one equity from $2k of loan paydown is wiped out by about $7k of value loss. Plan a longer hold.
- At projected returns (-3.0% appreciation + 3.0% rent growth), your $67k cash investment doubles in ~3 years — after that, you're playing with house money.
Negotiation context
- It's been on market 15 days — a 2% lower offer ($234k) is reasonable based on typical stale-listing flexibility.
- 4 sale attempts since 32y ago with the ask held roughly flat each time — persistent listings suggest the price (not the market) is what's stuck; bring a comps-based counter.
- Current owner paid $30k; list at $238k implies a 696% gain — meaningful room to come down on a strong offer.
Risks & watch-outs
- Watch-outs: built in 1930 — expect roof / HVAC / electrical / plumbing capex.
Questions for the listing agent
- Can we see the unit-by-unit rent roll, current vacancy, and any below-market leases? What's the average tenancy length?
- What capital expenditures (roof, boiler, parking lot, exteriors) have been made in the last 5 years, and what's planned in the next 2?
- Have any recent inspections been done? Can we get a copy of the seller's disclosures and any deferred-maintenance estimates?
- Built in 1930 — when were the roof, HVAC, electrical panel, plumbing, and water heater last replaced?
- Is there a deadline driving the sale (1031 exchange, divorce, estate, relocation)? That informs how much negotiation room exists.
- Schools are F-rated, which usually means shorter tenancies and higher turnover. Who's the typical renter profile here, and what's been the actual vacancy rate?
- Crime grade is F in this area — have there been break-ins, vandalism, or insurance claims at this property in the last 3 years? What carrier currently insures it and at what premium?
- What's the average days-on-market for RENTAL listings here right now (not sales)? A rising rental-DOM trend means longer vacancies and softer asking-rent achievability than the comps imply.
- What's the recent tenant-quality profile in this submarket — average credit score on applications, eviction rate, late-payment / NSF rate, and stable-employment percentage? A property-management company in the area should have these aggregated.
- How much new apartment / multifamily construction is in the pipeline within 1–3 miles? Heavy new supply (>2% of stock underway) typically softens rents 12–24 months out; light construction supports rent growth.
Investment metrics
- 1% rule
- 2.04% ✓
- Cap rate
- 17.36%
- Cash-on-cash
- 39.52%
- DSCR
- 2.76
- GRM
- 4.1
CMA / ARV
No comps found within radius.
Projected returns pro-forma
-3.0% appreciation · 3.0% rent growth · sell at horizon
- IRR
- 35.8%
- Equity multiple
- 2.52×
- Total profit
- $101,285
- Equity at exit
- $35,487
- IRR
- 42.5%
- Equity multiple
- 5.03×
- Total profit
- $268,481
- Equity at exit
- $20,578
Cash invested: $66,640 (down + closing). Projections, not guarantees.
Landlord ↔ Tenant lean methodology
- Overall (STATE)
- 62 Landlord-Friendly
- State Pennsylvania
- 62 Landlord-Friendly · EVEN
- County
- — inherits STATE
- City
- — inherits STATE
ZIP-level market 15110
- Home prices YoY
- -4.0%
- Active inventory
- 19
- Price-to-rent
- 16.3×
Monthly cashflow live
- Estimated rent
- $4,860 high interval (Pro) →
- Mortgage (P&I)
- −$1,248
- Tax est. 1.5%
- −$298 /mo · $3,570/yr
- Insurance
- −$99
- HOA
- −$0
- Vacancy / Maint / Mgmt
- −$1,021
- Net cashflow
- $2,195
Break-even live
4-unit breakdown (identical units grouped — click to expand)
| Units | Beds | Baths | Est. rent |
|---|---|---|---|
| 4× units | 2 | 1.2 | $4,860 |
| #1 | 2 | 1.2 | $1,215 |
| #2 | 2 | 1.2 | $1,215 |
| #3 | 2 | 1.2 | $1,215 |
| #4 | 2 | 1.2 | $1,215 |
| Total (4 units) | $4,860 | ||
UW: 25.0% down · 7.5% · 30yr · 1.5% tax · 5.0% vac · 8.0% maint · 8.0% mgmt
Financing live
Cash to close
- Down payment
- $59,500
- Closing costs
- $7,140
- Reserves months
- —
- Total cash needed
- —
Loan-product check · same deal, 3 products live
Conventional
25% down · 7.5% · 30yr
- Down + closing
- —
- Monthly P&I
- —
- Monthly cashflow
- —
- DSCR
- —
- Eligible?
- —
Personal DTI + credit; lowest rate.
DSCR
20% down · 8.5% · 30yr
- Down + closing
- —
- Monthly P&I
- —
- Monthly cashflow
- —
- DSCR
- —
- Eligible?
- —
No personal income docs; deal must DSCR.
Hard money
10% down · 12.0% · 12mo
- Down + closing
- —
- Monthly P&I
- —
- Monthly cashflow
- —
- DSCR
- —
- Eligible?
- —
Short-term bridge; refi at stabilization.
Listing history 10 events
-
2026-06-18days on market $238,000 Active 15 DOM
-
2026-06-17days on market $238,000 Active 14 DOM
-
2026-06-16days on market $238,000 Active 13 DOM
-
2026-06-15days on market $238,000 Active 12 DOM
-
2026-06-13days on market $238,000 Active 10 DOM
-
2026-06-09days on market $238,000 Active 6 DOM
-
2026-06-08days on market $238,000 Active 5 DOM
-
2026-06-07days on market $238,000 Active 4 DOM
-
2026-06-05remarks 693-char remark
-
2026-06-05$238,000 Active 1 DOM
ⓘ Source: listings_history table (triggers on properties + properties_extension) + one-shot
backfill from property_details.listing_events for pre-trigger history.
Climate risk First Street
- Flood 1/10 Low FEMA zone X (unshaded) · 0% chance over 30 yrs
- Wildfire 1/10 Low
- Heat 4/10 Moderate 7 d/yr ≥97°F today · 18 d/yr by 30 yrs out
- Wind 2/10 Low 0% chance of damaging wind over 30 yrs
- Air quality 4/10 Moderate 4 unhealthy d/yr today · 5 by 30 yrs out
Nearby sold comps map
Loading sold comps map…
Walkable amenities ~0.75 mi
Loading nearby amenities…
Taxation est. · year 1
- Rental income
- $58,320
- − Mortgage interest
- −$13,332
- − Property taxes
- −$3,570
- − Insurance
- −$1,190
- − Repairs & maintenance
- −$4,666
- − Management
- −$4,666
- − Depreciation
- −$6,924
- Taxable income
- $23,973
- Est. tax owed @ 24.0%
- −$5,754
- After-tax cash flow
- $20,582/yr
For passive investors: Depreciation is non-cash, so a rental often shows a tax loss while cash-flowing — sheltering income. Rental losses are passive: they offset passive income freely, and up to $25,000/yr can offset ordinary (W-2) income if you actively participate and your MAGI is under $100k (phasing out to $0 by $150k); unused losses carry forward. On sale, claimed depreciation is recaptured at up to 25%, and gains may owe capital-gains tax (a 1031 exchange can defer both). Figures are a year-1 estimate at your 24.0% rate — not tax advice; consult a CPA.
Condition & rehab AI · 14 photos
This multi-family property requires moderate repairs and maintenance, including painting, landscaping, and updating kitchen and bathroom fixtures. The property has a good roof and HVAC systems, but the exterior and interior show signs of wear and tear. With some updates, the property has the potential to increase its resale and rental value.
Repairs flagged
- Minor Landscaping — The landscaping is overgrown and could benefit from trimming and maintenance.
- Moderate Exterior paint — The exterior brick and siding show signs of discoloration and wear, indicating a need for repainting.
- Moderate Interior paint — The interior walls and ceilings show signs of discoloration and wear, indicating a need for repainting.
- Moderate Kitchen cabinets — The kitchen cabinets appear dated and could benefit from updating or repainting.
- Moderate Bathroom fixtures — The bathroom fixtures appear dated and could benefit from updating or repainting.
Value-add opportunities
- Both Painting — Painting the exterior and interior will improve the curb appeal and the overall condition of the property, making it more attractive to potential buyers or renters.
- Both Landscaping — Landscaping the property will improve the curb appeal and the overall condition of the property, making it more attractive to potential buyers or renters.
- Both Kitchen appliances — Upgrading the kitchen appliances will improve the functionality and appeal of the kitchen, making it more attractive to potential buyers or renters.
- Both Bathroom fixtures — Upgrading the bathroom fixtures will improve the functionality and appeal of the bathrooms, making it more attractive to potential buyers or renters.
Renovation cost estimate screening
| Repair item | Severity | Est. cost |
|---|---|---|
| Landscaping · The landscaping is overgrown and could benefit from trimming and maintenance. | Minor | $500–3,000 |
| Exterior paint · The exterior brick and siding show signs of discoloration and wear, indicating a need for repainting. | Moderate | $3,000–15,000 |
| Interior paint · The interior walls and ceilings show signs of discoloration and wear, indicating a need for repainting. | Moderate | $3,000–15,000 |
| Kitchen cabinets · The kitchen cabinets appear dated and could benefit from updating or repainting. | Moderate | $3,000–15,000 |
| Bathroom fixtures · The bathroom fixtures appear dated and could benefit from updating or repainting. | Moderate | $3,000–15,000 |
| Total estimated repair cost · 5 items | $12,500–63,000 |
Value-add ROI direction
- Both Painting — Painting the exterior and interior will improve the curb appeal and the overall condition of the property, making it more attractive to potential buyers or renters. ↑
- Both Landscaping — Landscaping the property will improve the curb appeal and the overall condition of the property, making it more attractive to potential buyers or renters. ↑
- Both Kitchen appliances — Upgrading the kitchen appliances will improve the functionality and appeal of the kitchen, making it more attractive to potential buyers or renters. ↑
- Both Bathroom fixtures — Upgrading the bathroom fixtures will improve the functionality and appeal of the bathrooms, making it more attractive to potential buyers or renters. ↑
ⓘ Cost ranges are severity-bucket heuristics (US national rule-of-thumb). Get contractor quotes + a written scope before underwriting a rehab budget.
Schools (NCES district)
- District
- Duquesne City SD
- NCES district ID
- 4208010
- Math proficiency
- 10% ▲ 4.00%
- Reading proficiency
- 15% ▬ 0.00%
- Median HH income
- $24,173
- Composite
- 12.77/100
- National rank
- #14546
- State rank
- #611 of 658 in PA
Livability — Duquesne
- Score
- 68/100
- State rank
- #927
- US rank
- #10089
Category grades
Schools grade is shown separately in the Schools card above.
Census & demographics
- Census place
- Duquesne, PA
- City population
- 5,186
- Population (ZIP)
- 5,186
Population outlook (Allegheny County) Hauer SSP2
- Today (2025)
- 1,250,282 people
- By 2030
- 1,256,482 · +0.5%
- By 2040
- 1,256,318 · +0.5%
- By 2050
- 1,244,169 · -0.5%
- By 2075
- 1,197,693 · -4.2%
- By 2100
- 1,093,187 · -12.6%
Race, ethnicity, and origin ACS 2023
- Neighborhood character
- Diverse neighborhood (Simpson 0.67)
- Race & ethnicity
- Black 44% White 37% Two or more races 16% Hispanic / Latino 3%
- Common ancestry
- Romanian 3% Lithuanian 2% Slovene 1%
- Foreign-born
- 1% · Canada
- Languages at home
- 96% English-only · Spanish 3%
Political lean MEDSL · Allegheny
- 2024 margin
- Strong D (+20.3) · D 59.7% · R 39.4%
- 2008→2024 swing
- +4.8pp toward D · 2008: 15.5pp · 2024: 20.3pp
- All cycles
- 2024: D+20.3 2020: D+20.4 2016: D+16.4 2012: D+14.4 2008: D+15.5
Not yet ingested
- Civics
- —
Market trends
- HPI YoY
- ▼ -5.75%
- Current HPI
- 138.4974
- Rent YoY
- —
- Metro
- —
- State GDP YoY
- ▲ 1.68%
- F500 in state
- 34
Industry mix (Fortune 500 HQ in PA)
| Industry | F500 HQs | Revenue |
|---|---|---|
| Healthcare | 2 | $309B |
|
||
| Insurance | 2 | $27B |
|
||
| Telecommunications / Media | 1 | $124B |
|
||
| Industrial Distribution | 1 | $22B |
|
||
| Financial Services | 1 | $20B |
|
||
| Chemicals / Materials | 1 | $18B |
|
||
Price history
+496.5% since first listed6 events — show timeline
- 2026-06-03 Listed $238,000 West Penn MLS
- 2024-04-10 Rental Removed $825 APPFOLIO
- 2024-01-12 Listed for Rent $825 APPFOLIO
- 2011-01-28 Listed $69,900 West Penn MLS
- 1995-01-17 Sold (MLS) $29,900 West Penn MLS
- 1994-08-30 Listed $39,900 West Penn MLS
Cash-flow waterfall
monthlySold comps — $/sqft
last 12 mo · ≤1 miLoading sold comps…