314 Hornel St · Baltimore, MD
Flood risk 1/10 · Minimal
- FEMA flood zone
- X (unshaded)
- Chance of flooding over 30 yrs
- 0.0%
- Est. flood insurance / yr
- $473 – $860
Fire risk 1/10 · Minimal
- Est. fire insurance / yr
- $755 – $1,403
Heat risk 8/10 · Major
- Hot days now (above 103°F)
- 7 days/yr
- Hot days in 30 yrs
- 15 days/yr
Wind risk 6/10 · Moderate
- Chance of severe wind over 30 yrs
- 27.0%
Air-quality risk 5/10 · Moderate
- Unhealthy air days now
- 6 days/yr
- Unhealthy air days in 30 yrs
- 8 days/yr
Risk factors via First Street. Map © Google.
Why this score? — see what drove the F grade
The composite is a weighted blend of 9 inputs, each scored 0–100. Each bar is that input's sub-score; the figure is the points it added to the 100-point composite (weight × sub-score).
- Cash flow +13.6/30.0
- DSCR +4.1/10.0
- Livability +3.8/5.0
- 1% rule +3.5/10.0
- Rent growth +2.8/5.0
- Condition / age +2.5/5.0
- Schools +1.0/10.0
- ARV discount +0.0/15.0
- Appreciation +0.0/10.0
$215,000
🖨 Deal sheet 📄 Offer letter ✓ Due diligence
Listing remarks MLS
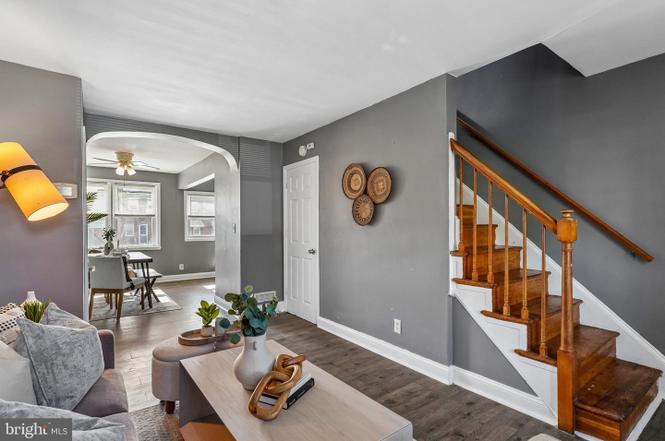
* * * BEAUTIFUL! * * * MOVE RIGHT INTO THIS SPACIOUS PORCH FRONT TOWNHOME! NEW LAMINATE FLOORING ON 1ST FLOOR. UPDATED KITCHEN W/ OAK CABINETS, DISHWASHER, NEW REFRIGERATOR & NEW STOVE. RENOVATED BATHS. FRESHLY PAINTED. LOWER LEVEL FEATURES RECROOM W/ NEW CARPET (COULD BE 3RD BEDROOM), POWDER ROOM, NEW WINDOW, LAUNDRY (NEW WASHER!), EXTRA FRIG, AND ACCESS TO REAR YARD W/ NEWLY POURED CONCRETE, COVERED PATIO & PARKING PAD. SECONDS TO I-95 & THE BELTWAY. * * TRULY A GREAT BUY! * *
Key facts
- Renovated home
- Remodeled bathroom
- Updated kitchen
Tags
Property features AI
Finance
- Financial info: Owned with ground rent (semi-annual payment)
Exterior
- Parking: Off-street parking via concrete driveway; Driveway available
- Utilities: Public water; Public sewer; Electric cooling; Natural gas heating and hot water
- Home design: Interior townhouse/rowhouse; Above-grade and below-grade finished space
- Construction: Brick construction; Block foundation; Built-up and shingle roof; Double-pane windows; Fully finished basement
- Exterior features: Awning(s); Sidewalks; Patio(s); Porch(es); Partially fenced yard; Front yard landscaping
Interior
- Kitchen: Gas range/oven (self-cleaning); Dishwasher; Refrigerator
- Bedrooms: Two bedrooms on the first upper level
- Flooring: Laminate flooring; Luxury vinyl plank
- Bathrooms: One full bathroom; One half bathroom on the lower level
- Heating & cooling: Forced air heating (natural gas); Central air conditioning (electric); Natural gas hot water
- Interior features: Ceiling fans; Combination kitchen/dining area; Storm door(s)
- Laundry & utility: Washer and dryer; Laundry located in the basement
Neighborhood map
What this means for you Summary
Snapshot
- This is a 2-bed/1.5-bath townhouse listed at $215k.
Deal economics
- At list price, monthly cash flow is $13 ($161/yr) — positive.
- The deal already cash-flows at list — no discount required.
- To meet the 1% rule (rent ≥ 1% of price), the offer needs to be $183k (15.1% below list).
- Recommended offer: $183k (15.1% below list) — sets the bar for 1% rule.
Location & tenants
- Location reads 76/100 on livability (#90 in MD, #3,396 nationally) — a middle-class / working-renter tenant base. Strengths: amenities A+, commute A+, housing A+; Watch: schools D, crime F.
- Baltimore City Public Schools (urban): math 7% / reading 16% proficiency, ranked #24 of 24 in MD (top 100%) — low school quality limits family demand, transient renter base, plan for 1-2y turnover; 79% free/reduced lunch — lower-income household profile, screen leases tightly.
- Market conditions: Rents rising (+1.3%/yr); 391 active listings in the ZIP; 40 comparable units currently listed for rent nearby; rentals at typical pace (median 24d on market — plan ~3-4 weeks tenant-placement turnaround); solid renter incomes; 1,273 units permitted in Baltimore city in 2024 (1,104 in 5+ unit buildings).
Forward outlook
- Local home prices are declining (-3.0%/yr); year-one equity from $1k of loan paydown is wiped out by about $6k of value loss. Plan a longer hold.
- Baltimore County population projected to shrink 4% by 2050 — rents likely to lag national; underwrite the cash flow, not the appreciation.
Negotiation context
- Only 1 days on market — expect competitive offers; lowballing is unlikely to land.
- 2 sale attempts since 4y ago with the ask held roughly flat each time — persistent listings suggest the price (not the market) is what's stuck; bring a comps-based counter.
- Current owner paid $146k; 47% above their basis — modest negotiation headroom, anchor on the comps not their cost.
Risks & watch-outs
- Watch-outs: built in 1950 — expect roof / HVAC / electrical / plumbing capex.
- Climate carrying-cost: major wind risk, 27% chance of damaging wind over 30y; extreme-heat days projected 7→15/yr by 2055 (HVAC capex compounding) — expect insurance premiums to compound above CPI over the hold.
Questions for the listing agent
- Built in 1950 — when were the roof, HVAC, electrical panel, plumbing, and water heater last replaced?
- Is there a deadline driving the sale (1031 exchange, divorce, estate, relocation)? That informs how much negotiation room exists.
- Schools are D-rated, which usually means shorter tenancies and higher turnover. Who's the typical renter profile here, and what's been the actual vacancy rate?
- Crime grade is F in this area — have there been break-ins, vandalism, or insurance claims at this property in the last 3 years? What carrier currently insures it and at what premium?
- The area grade is low — what's the realistic commute time and amenity access for the typical tenant pool here? Any planned neighborhood developments (good or bad) we should know about?
- What's the average days-on-market for RENTAL listings here right now (not sales)? A rising rental-DOM trend means longer vacancies and softer asking-rent achievability than the comps imply.
- What's the recent tenant-quality profile in this submarket — average credit score on applications, eviction rate, late-payment / NSF rate, and stable-employment percentage? A property-management company in the area should have these aggregated.
- How much new for-sale + rental construction is in the pipeline within 1–3 miles? Heavy new supply typically softens prices + rents 12–24 months out; constrained supply supports both.
Investment metrics
- 1% rule
- 0.85% ✗
- Cap rate
- 6.37%
- Cash-on-cash
- 0.27%
- DSCR
- 1.01
- GRM
- 9.8
CMA / ARV
- ARV (on-the-fly)
- $172,095
- Comps found
- 12
Show comp detail 12 sales within ~0.75 mi
| Address | Dist | Beds/Ba | Sqft | Sold | Price | $/sf | Match |
|---|---|---|---|---|---|---|---|
| 316 Hornel St | 0.00mi | 2/1.0 | 990 (-14%) | 0mo | $140,000 | $141 | 74 |
| 340 Kane St | 0.16mi | 2/1.5 | 1,240 (+7%) | 8mo | $185,000 | $149 | 73 |
| 400 Imla St | 0.09mi | 3/2.0 (+1) | 1,264 (+9%) | 3mo | $155,000 | $123 | 71 |
| 319 Joplin St | 0.13mi | 2/1.0 | 1,050 (-9%) | 7mo | $154,000 | $147 | 71 |
| 334 Kane St | 0.16mi | 2/2.0 | 1,050 (-9%) | 9mo | $195,000 | $186 | 68 |
| 7039 Eastbrook Ave | 0.69mi | 2/1.5 | 1,196 (+4%) | 1mo | $215,000 | $180 | 61 |
| 6811 Bank St | 0.51mi | 2/2.0 | 1,084 (-6%) | 4mo | $178,000 | $164 | 61 |
| 404 Cornwall St | 0.26mi | 3/1.0 (+1) | 1,260 (+9%) | 6mo | $180,000 | $143 | 60 |
| 320 Joplin St | 0.10mi | 3/1.0 (+1) | 1,324 (+15%) | 5mo | $200,000 | $151 | 59 |
| 620 Savage St | 0.71mi | 3/2.0 (+1) | 1,128 (-2%) | 2mo | $91,000 | $81 | 55 |
| 618 Umbra St | 0.62mi | 3/1.0 (+1) | 1,024 (-11%) | 0mo | $209,900 | $205 | 45 |
| 1108 Steelton Ave | 0.65mi | 3/1.0 (+1) | 1,080 (-6%) | 8mo | $110,000 | $102 | 45 |
Match score weights: distance 35% · size 25% · config 20% · recency 20%. Top-matched comps best support the ARV.
Projected returns pro-forma
-3.0% appreciation · 1.31% rent growth · sell at horizon
- IRR
- -17.7%
- Equity multiple
- 0.38×
- Total profit
- $-37,045
- Equity at exit
- $32,057
- IRR
- -13.3%
- Equity multiple
- 0.28×
- Total profit
- $-43,297
- Equity at exit
- $18,589
Cash invested: $60,200 (down + closing). Projections, not guarantees.
Landlord ↔ Tenant lean methodology
- Overall (CITY)
- 12 Strongly Tenant-Friendly
- State Maryland
- 27 Tenant-Leaning · D+14
- County
- — inherits STATE
- City Baltimore
- 12 Strongly Tenant-Friendly · D+58
ZIP-level market 21224
- Rents YoY
- 1.3%
- Active inventory
- 391
- Price-to-rent
- 9.8×
Monthly cashflow live
- Estimated rent
- $1,826 high interval (Pro) →
- Mortgage (P&I)
- −$1,127
- Tax from tax record
- −$212 /mo · $2,541/yr
- Insurance
- −$90
- HOA
- −$0
- Vacancy / Maint / Mgmt
- −$383
- Net cashflow
- $13
Break-even live
UW: 25.0% down · 7.5% · 30yr · 1.5% tax · 5.0% vac · 8.0% maint · 8.0% mgmt
Financing live
Cash to close
- Down payment
- $53,750
- Closing costs
- $6,450
- Reserves months
- —
- Total cash needed
- —
Loan-product check · same deal, 3 products live
Conventional
25% down · 7.5% · 30yr
- Down + closing
- —
- Monthly P&I
- —
- Monthly cashflow
- —
- DSCR
- —
- Eligible?
- —
Personal DTI + credit; lowest rate.
DSCR
20% down · 8.5% · 30yr
- Down + closing
- —
- Monthly P&I
- —
- Monthly cashflow
- —
- DSCR
- —
- Eligible?
- —
No personal income docs; deal must DSCR.
Hard money
10% down · 12.0% · 12mo
- Down + closing
- —
- Monthly P&I
- —
- Monthly cashflow
- —
- DSCR
- —
- Eligible?
- —
Short-term bridge; refi at stabilization.
Rent comps 40 comps
| Address | Beds | Baths | Sqft | Rent | $/sqft | DOM | Units | Dist |
|---|---|---|---|---|---|---|---|---|
| 363 Gusryan St Baltimore, MD | 2.0 | 2.0 | 840 | $1,950 | $2.32 | 12d | 1 | 0.07mi |
| 338 Gusryan St Baltimore, MD | 2.0 | 1.5 | 1218 | $1,700 | $1.40 | 23d | 1 | 0.07mi |
| 340 Gusryan St Baltimore, MD | 3.0 | 2.0 | 1300 | $2,500 | $1.92 | 43d | 1 | 0.07mi |
| 416 Hornel St Unit 2 Baltimore, MD | 2.0 | 1.0 | 1470 | $1,400 | $0.95 | 23d | 1 | 0.10mi |
| 328 Folcroft St Baltimore, MD | 3.0 | 2.0 | 1460 | $2,300 | $1.58 | 23d | 1 | 0.12mi |
| 334 Kane St Baltimore, MD | 2.0 | 2.0 | 1050 | $1,675 | $1.60 | 23d | 1 | 0.14mi |
| 434 Folcroft St Unit A Baltimore, MD | 3.0 | 1.5 | 1260 | $1,500 | $1.19 | 43d | 1 | 0.16mi |
| 442 Folcroft St Unit A Baltimore, MD | 2.0 | 1.5 | 1071 | $1,600 | $1.49 | 3d | 1 | 0.17mi |
| 421 Elrino St Unit B Baltimore, MD | 1.0 | 1.0 | 750 | $995 | $1.33 | 23d | 1 | 0.17mi |
| 335 Drew St Unit 1 Baltimore, MD | 2.0 | 1.0 | 1460 | $1,600 | $1.10 | 23d | 1 | 0.20mi |
| 335 Drew St Unit 2 Baltimore, MD | 1.0 | 1.0 | 1460 | $1,200 | $0.82 | 23d | 1 | 0.20mi |
| 339 Drew St Baltimore, MD | 1.0 | 1.0 | 1460 | $1,200 | $0.82 | 23d | 1 | 0.20mi |
| 440 Elrino St Unit 2 Baltimore, MD | 1.0 | 1.0 | 750 | $1,050 | $1.40 | 23d | 1 | 0.21mi |
| 456 Elrino St Unit B Baltimore, MD | 2.0 | 1.0 | 800 | $1,600 | $2.00 | 43d | 1 | 0.23mi |
| 6802 Conley St Baltimore, MD | 2.0 | 1.5 | 939 | $1,750 | $1.86 | 21d | 1 | 0.46mi |
| 6905 Bank St Baltimore, MD | 2.0 | 1.5 | 784 | $1,650 | $2.10 | 43d | 1 | 0.52mi |
| 560 Bayview Blvd Baltimore, MD | 1.0–3.0 | 1.0–3.0 | 1108 | $2,515 | $2.27 | 2d | 25 | 0.53mi |
| 7124 Gough St Baltimore, MD | 2.0 | 1.5 | 1096 | $1,700 | $1.55 | 21d | 1 | 0.66mi |
| 708 Umbra St Baltimore, MD | 3.0 | 1.5 | 1274 | $2,000 | $1.57 | 17d | 1 | 0.66mi |
| 7058 Eastbrook Ave Baltimore, MD | 3.0 | 2.0 | 1228 | $1,700 | $1.38 | 11d | 1 | 0.70mi |
| 530 47th St Baltimore, MD | 3.0 | 1.0 | 1424 | $1,750 | $1.23 | 23d | 1 | 0.73mi |
| 1207 Anglesea St Baltimore, MD | 2.0 | 2.0 | 1162 | $2,150 | $1.85 | 4d | 1 | 0.74mi |
| 7230 Conley St Unit 1 Baltimore, MD | 3.0 | 1.5 | 1144 | $2,100 | $1.84 | 3d | 1 | 0.82mi |
| 7230 Conley St Unit 1 Baltimore, MD | 3.0 | 1.5 | 1144 | $2,100 | $1.84 | 23d | 1 | 0.82mi |
| 628 47th St Apt RW2 Baltimore, MD | 2.0 | 1.0 | 750 | $1,200 | $1.60 | 10d | 1 | 0.88mi |
| 630 47th St Unit B Baltimore, MD | 2.0 | 1.0 | 750 | $1,200 | $1.60 | 43d | 1 | 0.88mi |
| 611 Oldham St Baltimore, MD | 2.0 | 1.0 | 1148 | $1,800 | $1.57 | 12d | 1 | 0.88mi |
| 410 S Newkirk St Baltimore, MD | 2.0 | 1.5 | 1330 | $1,580 | $1.19 | 43d | 1 | 0.91mi |
| 7261 Bridgewood Dr Baltimore, MD | 3.0 | 2.0 | 896 | $2,495 | $2.78 | 23d | 1 | 0.92mi |
| 133 S Macon St Baltimore, MD | 2.0 | 2.5 | 1440 | $2,400 | $1.67 | 17d | 1 | 0.93mi |
| 7319 Conley St Baltimore, MD | 3.0 | 2.0 | 1080 | $1,950 | $1.81 | 17d | 1 | 0.94mi |
| 7325 Conley St Baltimore, MD | 3.0 | 2.0 | 1290 | $1,950 | $1.51 | 17d | 1 | 0.95mi |
| 1504 Elrino St Baltimore, MD | 2.0 | 2.0 | 1050 | $1,650 | $1.57 | 4d | 1 | 0.96mi |
| 527 S Lehigh St Baltimore, MD | 3.0 | 2.0 | 1320 | $2,325 | $1.76 | 43d | 1 | 0.99mi |
| 4505 Foster Ave Baltimore, MD | 3.0 | 3.0 | 1376 | $2,650 | $1.93 | 23d | 1 | 1.04mi |
| 1613 Elrino St Baltimore, MD | 2.0 | 1.0 | 700 | $1,350 | $1.93 | 43d | 1 | 1.12mi |
| 505 Northpoint Rd Baltimore, MD | 3.0 | 2.0 | 1300 | $2,195 | $1.69 | 11d | 1 | 1.19mi |
| 7716 Wynbrook Rd Baltimore, MD | 2.0 | 1.0 | 1232 | $1,800 | $1.46 | 43d | 1 | 1.19mi |
| 502 S Haven St Baltimore, MD | 2.0 | 2.5 | 1440 | $2,400 | $1.67 | 16d | 1 | 1.24mi |
| 502 S Haven St Baltimore, MD | 2.0 | 2.5 | 1440 | $2,400 | $1.67 | 23d | 1 | 1.24mi |
Listing history 2 events
-
2026-06-19remarks 699-char remark
-
2026-06-19$215,000 Active 1 DOM
ⓘ Source: listings_history table (triggers on properties + properties_extension) + one-shot
backfill from property_details.listing_events for pre-trigger history.
Tax reassessment forecast MD · Partial reset (capped growth)
- Current annual tax
- $2,541 · $212/mo
- Projected year-2 tax
- $2,541 · $212/mo
- Expected delta
- $0/yr ($0/mo · 0.0%)
ⓘ Screening estimate from a state-policy table — verify with the county assessor before closing.
Climate risk First Street
- Flood 1/10 Low FEMA zone X (unshaded) · 0% chance over 30 yrs
- Wildfire 1/10 Low
- Heat 8/10 Severe 7 d/yr ≥103°F today · 15 d/yr by 30 yrs out
- Wind 6/10 Major 27% chance of damaging wind over 30 yrs
- Air quality 5/10 Major 6 unhealthy d/yr today · 8 by 30 yrs out
Nearby sold comps map
Loading sold comps map…
Walkable amenities ~0.75 mi
Loading nearby amenities…
Taxation est. · year 1
- Rental income
- $21,908
- − Mortgage interest
- −$12,043
- − Property taxes
- −$2,541
- − Insurance
- −$1,075
- − Repairs & maintenance
- −$1,753
- − Management
- −$1,753
- − Depreciation
- −$6,255
- Taxable loss
- −$3,512
- Est. tax savings @ 24.0%
- +$843
- After-tax cash flow
- $1,004/yr
For passive investors: Depreciation is non-cash, so a rental often shows a tax loss while cash-flowing — sheltering income. Rental losses are passive: they offset passive income freely, and up to $25,000/yr can offset ordinary (W-2) income if you actively participate and your MAGI is under $100k (phasing out to $0 by $150k); unused losses carry forward. On sale, claimed depreciation is recaptured at up to 25%, and gains may owe capital-gains tax (a 1031 exchange can defer both). Figures are a year-1 estimate at your 24.0% rate — not tax advice; consult a CPA.
Schools (NCES district)
- District
- Baltimore City Public Schools
- NCES district ID
- 2400090
- Math proficiency
- 7% ▼ -9.00%
- Reading proficiency
- 16% ▼ -5.00%
- Median HH income
- $42,108
- Composite
- 10.08/100
- National rank
- #9805
- State rank
- #24 of 24 in MD
Livability — Baltimore
- Score
- 76/100
- State rank
- #90
- US rank
- #3396
Category grades
Schools grade is shown separately in the Schools card above.
Census & demographics
- Census place
- Baltimore, MD
- County
- Baltimore City · 558,601 people
- City population
- 588,727
- Metro
- Baltimore-Columbia-Towson, MD
- Population (ZIP)
- 47,465
- Household income
- $89,017
- Rent vs Own
- Severe rent burden
- 1786.0
Population outlook (Baltimore County) Hauer SSP2
- Today (2025)
- 624,249 people
- By 2030
- 621,541 · -0.4%
- By 2040
- 609,756 · -2.3%
- By 2050
- 597,249 · -4.3%
- By 2075
- 552,236 · -11.5%
- By 2100
- 513,934 · -17.7%
Race, ethnicity, and origin ACS 2023
- Neighborhood character
- Diverse neighborhood (Simpson 0.62)
- Race & ethnicity
- White 55% Hispanic / Latino 21% Black 16% Two or more races 7% Asian 4%
- Hispanic origin (detail)
- Mexican 4% Puerto Rican 2% Dominican 1%
- Common ancestry
- Romanian 5% Lithuanian 2% Italian 1%
- Foreign-born
- 17% · Canada, China, Vietnam
- Languages at home
- 76% English-only · Spanish 18% Other Indo-European 2% Russian/Polish/Slavic 1%
Political lean MEDSL · Baltimore
- 2024 margin
- Solid D (+73.0) · D 85.2% · R 12.2% · Other 2.6%
- 2008→2024 swing
- -2.5pp toward R · 2008: 75.5pp · 2024: 73.0pp
- All cycles
- 2024: D+73.0 2020: D+76.6 2016: D+74.6 2012: D+76.4 2008: D+75.5
Not yet ingested
- Civics
- —
Market trends
- HPI YoY
- ▼ -332.23%
- Current HPI
- 241.284
- Rent YoY
- ▲ 1.31%
- Metro
- Baltimore-Columbia-Towson, MD
- State GDP YoY
- ▲ 2.97%
- F500 in state
- 12
Industry mix (Fortune 500 HQ in MD)
| Industry | F500 HQs | Revenue |
|---|---|---|
| Aerospace / Defense | 1 | $71B |
|
||
| Utilities | 1 | $25B |
|
||
| Hotels | 1 | $24B |
|
||
| Consumer Goods | 1 | $7B |
|
||
| Real Estate | 1 | $6B |
|
||
| Chemicals | 1 | $2B |
|
||
Price history
+30.3% since first listed7 events — show timeline
- 2026-06-18 Listed $215,000 BRIGHT MLS
- 2023-02-15 Sold (Public Records) $146,250 Public Records
- 2022-12-15 Listing Removed — BRIGHT MLS
- 2022-12-15 Sold (MLS) $146,250 BRIGHT MLS
- 2022-11-07 Pending — BRIGHT MLS
- 2022-11-07 Listing Removed — BRIGHT MLS
- 2022-11-01 Listed $165,000 BRIGHT MLS
Property tax history
+0.4%/yrLatest (2025): $2,541 · +8.0% YoY. Source: county tax records.
Cash-flow waterfall
monthlySold comps — $/sqft
last 12 mo · ≤1 miLoading sold comps…