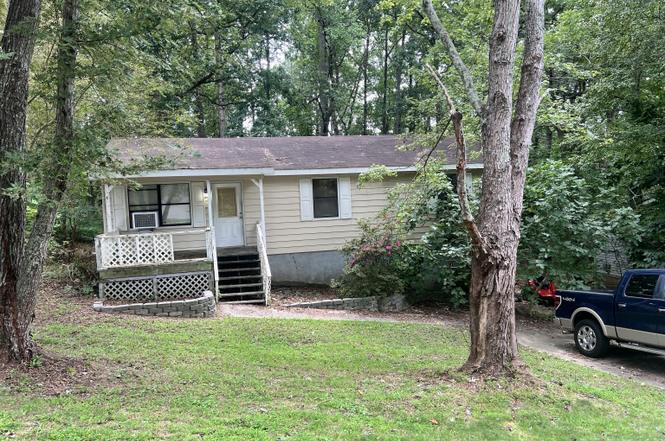
3825 Bentley Dr · Douglasville, GA
Flood risk 1/10 · Minimal
- FEMA flood zone
- X (unshaded)
- Chance of flooding over 30 yrs
- 0.0%
- Est. flood insurance / yr
- $507 – $1,088
Fire risk 3/10 · Minor
- Est. fire insurance / yr
- $963 – $1,789
Heat risk 5/10 · Moderate
- Hot days now (above 103°F)
- 7 days/yr
- Hot days in 30 yrs
- 18 days/yr
Wind risk 4/10 · Minor
- Chance of severe wind over 30 yrs
- 23.0%
Air-quality risk 3/10 · Minor
- Unhealthy air days now
- 4 days/yr
- Unhealthy air days in 30 yrs
- 4 days/yr
Risk factors via First Street. Map © Google.
Why this score? — see what drove the B grade
The composite is a weighted blend of 9 inputs, each scored 0–100. Each bar is that input's sub-score; the figure is the points it added to the 100-point composite (weight × sub-score).
- Cash flow +29.6/30.0
- ARV discount +15.0/15.0
- DSCR +10.0/10.0
- 1% rule +9.0/10.0
- Livability +3.6/5.0
- Schools +2.6/10.0
- Rent growth +2.5/5.0
- Condition / age +2.5/5.0
- Appreciation +0.0/10.0
$145,000
🖨 Deal sheet 📄 Offer letter ✓ Due diligence
Listing remarks
Investment opportunity. Fixer upper. 3BR, 1BA with basement, level lot, large back yard with nice hardwoods. Property is being sold in "as is" condition. Note: The sale of this property is subject to the approval of Douglas County Probate Court.
Key facts
- Large back yard
- Fixer upper
- 0.5 acre lot
Tags
Neighborhood map
What this means for you Summary
Snapshot
- This is a 3-bed/2.0-bath single-family listed at $145k.
Deal economics
- At list price, monthly cash flow is $522 ($6k/yr) — positive.
- The deal already cash-flows at list — no discount required.
- Meets the 1% rule at list price ($2k rent vs $145k).
- Recommended offer: $141k (3.0% below list) — sets the bar for market timing.
- Cap rate 10.6% vs local median 4.5% in Douglasville — top-decile yield for the area; either an underpriced asset or a hidden risk that comps aren't pricing in. Stress-test before assuming the spread holds.
Location & tenants
- Location reads 71/100 on livability (#82 in GA) — a middle-class / working-renter tenant base. Strengths: cost of living A+, housing A+, health & safety B; Watch: crime F, amenities F.
- Douglas County (suburban): math 23% / reading 35% proficiency, ranked #92 of 174 in GA (top 53%) — low school quality limits family demand, transient renter base, plan for 1-2y turnover.
- Zoned schools: Mount Carmel Elementary School (math 27% / reading 27%, grade F, #689 of 1,228 statewide, top 58%, 419 students, 73% FRL); Chestnut Log Middle School (math 17% / reading 27%, grade F, #333 of 470 statewide, top 72%, 726 students, 78% FRL) — zoned schools average 76% FRL vs 53% district-wide (22 pts higher); higher-poverty schools than district average — tighter screening recommended.
- Market conditions: Rents flat; 595 active listings in the ZIP; 7 comparable units currently listed for rent nearby; rentals leasing fast (median 13d on market — plan ~1-2 weeks tenant-placement turnaround); solid renter incomes; 595 units permitted in Douglas County in 2024 (72 in 5+ unit buildings).
Forward outlook
- Local home prices are declining (-3.0%/yr); year-one equity from $1k of loan paydown is wiped out by about $4k of value loss. Plan a longer hold.
- Douglas County population projected at +35% by 2050 — long-run rental-demand tailwind backs the buy-and-hold thesis.
Negotiation context
- It's been on market 36 days — a 3% lower offer ($141k) is reasonable based on typical stale-listing flexibility.
- 9 sale attempts since 16y ago; this cycle's ask has dropped $20k (12%) from the opening price — seller is motivated, your offer sets the floor, not the list.
- Current owner paid $30k; list at $145k implies a 383% gain — meaningful room to come down on a strong offer.
Risks & watch-outs
- Climate carrying-cost: extreme-heat days projected 7→18/yr by 2055 (HVAC capex compounding) — expect insurance premiums to compound above CPI over the hold.
Questions for the listing agent
- It's been on market 36 days. Have you received any prior offers? Is the seller open to a 3% concession, seller financing, or rate buy-down credit?
- Is there a deadline driving the sale (1031 exchange, divorce, estate, relocation)? That informs how much negotiation room exists.
- Crime grade is F in this area — have there been break-ins, vandalism, or insurance claims at this property in the last 3 years? What carrier currently insures it and at what premium?
- What's the average days-on-market for RENTAL listings here right now (not sales)? A rising rental-DOM trend means longer vacancies and softer asking-rent achievability than the comps imply.
- What's the recent tenant-quality profile in this submarket — average credit score on applications, eviction rate, late-payment / NSF rate, and stable-employment percentage? A property-management company in the area should have these aggregated.
- How much new for-sale + rental construction is in the pipeline within 1–3 miles? Heavy new supply typically softens prices + rents 12–24 months out; constrained supply supports both.
Investment metrics
- 1% rule
- 1.40% ✓
- Cap rate
- 10.62%
- Cash-on-cash
- 15.44%
- DSCR
- 1.69
- GRM
- 6.0
CMA / ARV
- ARV (on-the-fly)
- $238,004
- Comps found
- 12
Show comp detail 12 sales within ~0.75 mi
| Address | Dist | Beds/Ba | Sqft | Sold | Price | $/sf | Match |
|---|---|---|---|---|---|---|---|
| 3811 Paul St | 0.09mi | 3/2.0 | 1,251 (+5%) | 6mo | $199,500 | $159 | 83 |
| 3881 Bentley Dr | 0.11mi | 3/2.0 | 1,276 (+7%) | 5mo | $254,000 | $199 | 79 |
| 2436 Eric Ln | 0.22mi | 3/1.5 | 1,112 (-7%) | 2mo | $218,900 | $197 | 74 |
| 3930 Paul St | 0.18mi | 3/2.0 | 1,170 (-2%) | 19mo | $219,000 | $187 | 72 |
| 3765 Cindy Dr | 0.15mi | 3/2.0 | 1,259 (+5%) | 17mo | $271,000 | $215 | 70 |
| 3757 Cindy Dr | 0.16mi | 4/2.0 (+1) | 1,259 (+5%) | 12mo | $285,000 | $226 | 69 |
| 2280 Pope Rd | 0.48mi | 3/1.0 | 1,190 (-0%) | 8mo | $212,500 | $179 | 66 |
| 2501 Eric Ln | 0.27mi | 3/2.0 | 1,146 (-4%) | 19mo | $255,000 | $223 | 64 |
| 2483 Pope Rd | 0.23mi | 3/1.5 | 1,107 (-7%) | 14mo | $235,000 | $212 | 63 |
| 3580 Dorris Cir | 0.55mi | 3/2.0 | 1,098 (-8%) | 5mo | $169,900 | $155 | 56 |
| 3770 Longview Dr | 0.42mi | 3/2.0 | 1,279 (+7%) | 20mo | $245,000 | $192 | 53 |
| 2290 Pope Rd | 0.46mi | 3/1.0 | 1,075 (-10%) | 9mo | $223,000 | $207 | 50 |
Match score weights: distance 35% · size 25% · config 20% · recency 20%. Top-matched comps best support the ARV.
Projected returns pro-forma
-3.0% appreciation · 0.08% rent growth · sell at horizon
- IRR
- 2.7%
- Equity multiple
- 1.10×
- Total profit
- $4,072
- Equity at exit
- $21,620
- IRR
- 9.1%
- Equity multiple
- 1.60×
- Total profit
- $24,324
- Equity at exit
- $12,537
Cash invested: $40,600 (down + closing). Projections, not guarantees.
Landlord ↔ Tenant lean methodology
- Overall (STATE)
- 90 Strongly Landlord-Friendly
- State Georgia
- 90 Strongly Landlord-Friendly · R+3
- County
- — inherits STATE
- City
- — inherits STATE
ZIP-level market 30135
- Rents YoY
- 0.1%
- Active inventory
- 595
- Price-to-rent
- 6.0×
Monthly cashflow live
- Estimated rent
- $2,025 high interval (Pro) →
- Mortgage (P&I)
- −$760
- Tax from tax record
- −$257 /mo · $3,079/yr
- Insurance
- −$60
- HOA
- −$0
- Vacancy / Maint / Mgmt
- −$425
- Net cashflow
- $522
Break-even live
UW: 25.0% down · 7.5% · 30yr · 1.5% tax · 5.0% vac · 8.0% maint · 8.0% mgmt
Financing live
Cash to close
- Down payment
- $36,250
- Closing costs
- $4,350
- Reserves months
- —
- Total cash needed
- —
Loan-product check · same deal, 3 products live
Conventional
25% down · 7.5% · 30yr
- Down + closing
- —
- Monthly P&I
- —
- Monthly cashflow
- —
- DSCR
- —
- Eligible?
- —
Personal DTI + credit; lowest rate.
DSCR
20% down · 8.5% · 30yr
- Down + closing
- —
- Monthly P&I
- —
- Monthly cashflow
- —
- DSCR
- —
- Eligible?
- —
No personal income docs; deal must DSCR.
Hard money
10% down · 12.0% · 12mo
- Down + closing
- —
- Monthly P&I
- —
- Monthly cashflow
- —
- DSCR
- —
- Eligible?
- —
Short-term bridge; refi at stabilization.
Rent comps 7 comps
| Address | Beds | Baths | Sqft | Rent | $/sqft | DOM | Units | Dist |
|---|---|---|---|---|---|---|---|---|
| 2378 Iron Horse Dr Douglasville, GA | 3.0 | 2.0 | 1160 | $1,679 | $1.45 | 3d | 1 | 0.19mi |
| 2301 Carlton Pkwy Douglasville, GA | 1.0–3.0 | 1.0–2.0 | 1050 | $2,465 | $2.35 | 1d | 12 | 0.84mi |
| 3009 Acacia Cir Douglasville, GA | 3.0 | 2.5 | 1421 | $2,200 | $1.55 | 13d | 1 | 0.97mi |
| 2010 Ayla Dr Douglasville, GA | 3.0 | 2.5 | 1421 | $2,000 | $1.41 | 13d | 1 | 0.98mi |
| 4085 Midway Rd Douglasville, GA | 2.0 | 2.0 | 832 | $1,200 | $1.44 | 5d | 1 | 1.14mi |
| 1750 Nutmeg St Douglasville, GA | 2.0 | 1.5 | 900 | $1,380 | $1.53 | 24d | 1 | 1.36mi |
| 3175 Wallace Lake Rd Douglasville, GA | 3.0 | 1.0 | 1500 | $1,900 | $1.27 | 43d | 1 | 1.47mi |
Listing history 31 events
-
2025-10-10status Under Contract
-
2025-10-01status Back On Market
-
2025-09-13status Under Contract
-
2025-09-09status Back On Market
-
2025-09-03status Under Contract
-
2025-08-15price $145,000
-
2025-08-15price $149,000
-
2025-08-07$165,000 New
-
2020-12-15status Under Contract
-
2020-12-11historical
-
2020-12-01status Back on Market
-
2020-11-24status Under Contract
-
2020-11-13status Back on Market
-
2020-11-12status Under Contract
-
2020-11-04$129,900 New
-
2020-10-15historical
-
2020-10-02$129,900 New
-
2019-03-27historical
-
2018-10-26$95,000 New
-
2010-07-22historical
-
2010-07-09soldstatus $30,000 Sold
-
2010-06-28status Pending
-
2010-06-04price $33,900
-
2010-06-03price $33,900
-
2010-05-14price $36,900
-
2010-05-12price $36,900
-
2010-04-22price $39,900
-
2010-04-21price $39,900
-
2010-03-30$49,900 Active
-
1991-07-26soldstatus $62,953
-
1983-04-11soldstatus $38,200
ⓘ Source: listings_history table (triggers on properties + properties_extension) + one-shot
backfill from property_details.listing_events for pre-trigger history.
Tax reassessment forecast GA · Resets to sale price
- Current annual tax
- $3,079 · $257/mo
- Projected year-2 tax
- $3,079 · $257/mo
- Expected delta
- $0/yr ($0/mo · 0.0%)
ⓘ Screening estimate from a state-policy table — verify with the county assessor before closing.
Climate risk First Street
- Flood 1/10 Low FEMA zone X (unshaded) · 0% chance over 30 yrs
- Wildfire 3/10 Moderate
- Heat 5/10 Major 7 d/yr ≥103°F today · 18 d/yr by 30 yrs out
- Wind 4/10 Moderate 23% chance of damaging wind over 30 yrs
- Air quality 3/10 Moderate 4 unhealthy d/yr today · 4 by 30 yrs out
Nearby sold comps map
Loading sold comps map…
Walkable amenities ~0.75 mi
Loading nearby amenities…
Taxation est. · year 1
- Rental income
- $24,300
- − Mortgage interest
- −$8,122
- − Property taxes
- −$3,079
- − Insurance
- −$725
- − Repairs & maintenance
- −$1,944
- − Management
- −$1,944
- − Depreciation
- −$4,218
- Taxable income
- $4,268
- Est. tax owed @ 24.0%
- −$1,024
- After-tax cash flow
- $5,244/yr
For passive investors: Depreciation is non-cash, so a rental often shows a tax loss while cash-flowing — sheltering income. Rental losses are passive: they offset passive income freely, and up to $25,000/yr can offset ordinary (W-2) income if you actively participate and your MAGI is under $100k (phasing out to $0 by $150k); unused losses carry forward. On sale, claimed depreciation is recaptured at up to 25%, and gains may owe capital-gains tax (a 1031 exchange can defer both). Figures are a year-1 estimate at your 24.0% rate — not tax advice; consult a CPA.
Schools (NCES district)
- District
- Douglas County
- NCES district ID
- 1301860
- Math proficiency
- 23% ▼ -16.00%
- Reading proficiency
- 35% ▼ -11.00%
- Median HH income
- $55,335
- Composite
- 25.84/100
- National rank
- #7353
- State rank
- #92 of 174 in GA
Livability — Douglasville
- Score
- 71/100
- State rank
- #82
- US rank
- #6971
Category grades
Schools grade is shown separately in the Schools card above.
Census & demographics
- Census place
- Douglasville, GA
- County
- Douglas County · 141,416 people
- City population
- 114,380
- Metro
- Atlanta-Sandy Springs-Alpharetta, GA
- Population (ZIP)
- 66,800
- Household income
- $94,526
- Rent vs Own
- Severe rent burden
- 890.0
Population outlook (Douglas County) Hauer SSP2
- Today (2025)
- 163,022 people
- By 2030
- 173,956 · +6.7%
- By 2040
- 196,859 · +20.8%
- By 2050
- 220,017 · +35.0%
- By 2075
- 279,831 · +71.7%
- By 2100
- 322,702 · +97.9%
Race, ethnicity, and origin ACS 2023
- Neighborhood character
- Diverse neighborhood (Simpson 0.63)
- Race & ethnicity
- Black 49% White 35% Hispanic / Latino 9% Two or more races 6% Asian 2%
- Hispanic origin (detail)
- Mexican 4% Puerto Rican 2%
- Common ancestry
- Hispanic 2% Slovak 1% Italian 1%
- Foreign-born
- 10% · Canada, Vietnam, Jamaica
- Languages at home
- 88% English-only · Spanish 7% French/Haitian/Cajun 2% Vietnamese 1%
Political lean MEDSL · Douglas
- 2024 margin
- Solid D (+31.4) · D 65.4% · R 33.9%
- 2008→2024 swing
- +29.6pp toward D · 2008: 1.8pp · 2024: 31.4pp
- All cycles
- 2024: D+31.4 2020: D+25.1 2016: D+10.8 2012: D+4.0 2008: D+1.8
Not yet ingested
- Civics
- —
Market trends
- HPI YoY
- ▼ -225.50%
- Current HPI
- 223.9534
- Rent YoY
- ▲ 0.08%
- Metro
- Atlanta-Sandy Springs-Alpharetta, GA
- State GDP YoY
- ▲ 2.66%
- F500 in state
- 28
Industry mix (Fortune 500 HQ in GA)
| Industry | F500 HQs | Revenue |
|---|---|---|
| Paper / Packaging | 2 | $29B |
|
||
| Retail | 1 | $160B |
|
||
| Transportation / Logistics | 1 | $91B |
|
||
| Airlines | 1 | $62B |
|
||
| Consumer Goods | 1 | $47B |
|
||
| Utilities | 1 | $25B |
|
||
Price history
+279.6% since first listed31 events — show timeline
- 2025-10-10 Pending — GAMLS
- 2025-10-01 Relisted — GAMLS
- 2025-09-13 Pending — GAMLS
- 2025-09-09 Relisted — GAMLS
- 2025-09-03 Pending — GAMLS
- 2025-08-15 Price Changed $145,000 GAMLS
- 2025-08-15 Price Changed $149,000 GAMLS
- 2025-08-07 Listed $165,000 GAMLS
- 2020-12-15 Pending — GAMLS
- 2020-12-11 Listing Removed — GAMLS
- 2020-12-01 Relisted — GAMLS
- 2020-11-24 Pending — GAMLS
- 2020-11-13 Relisted — GAMLS
- 2020-11-12 Pending — GAMLS
- 2020-11-04 Listed $129,900 GAMLS
- 2020-10-15 Listing Removed — GAMLS
- 2020-10-02 Listed $129,900 GAMLS
- 2019-03-27 Listing Removed — GAMLS
- 2018-10-26 Listed $95,000 GAMLS
- 2010-07-22 Listing Removed — FMLS
- 2010-07-09 Sold (MLS) $30,000 FMLS
- 2010-06-28 Pending — FMLS
- 2010-06-04 Price Changed $33,900 GAMLS
- 2010-06-03 Price Changed $33,900 FMLS
- 2010-05-14 Price Changed $36,900 GAMLS
- 2010-05-12 Price Changed $36,900 FMLS
- 2010-04-22 Price Changed $39,900 GAMLS
- 2010-04-21 Price Changed $39,900 FMLS
- 2010-03-30 Listed $49,900 FMLS
- 1991-07-26 Sold (Public Records) $62,953 Public Records
- 1983-04-11 Sold (Public Records) $38,200 Public Records
Property tax history
+5.6%/yrLatest (2025): $3,079 · +7.1% YoY. Source: county tax records.
Cash-flow waterfall
monthlySold comps — $/sqft
last 12 mo · ≤1 miLoading sold comps…