2104 New Jersey St · Baytown, TX
Flood risk 5/10 · Moderate
- FEMA flood zone
- X (unshaded)
- Chance of flooding over 30 yrs
- 0.42%
- Est. flood insurance / yr
- $507 – $1,088
Fire risk 1/10 · Minimal
- Est. fire insurance / yr
- $1,222 – $2,270
Heat risk 9/10 · Severe
- Hot days now (above 108°F)
- 7 days/yr
- Hot days in 30 yrs
- 25 days/yr
Wind risk 9/10 · Severe
- Chance of severe wind over 30 yrs
- 99.0%
Air-quality risk 2/10 · Minimal
- Unhealthy air days now
- 1 days/yr
- Unhealthy air days in 30 yrs
- 2 days/yr
Risk factors via First Street. Map © Google.
Why this score? — see what drove the B+ grade
The composite is a weighted blend of 9 inputs, each scored 0–100. Each bar is that input's sub-score; the figure is the points it added to the 100-point composite (weight × sub-score).
- Cash flow +30.0/30.0
- ARV discount +15.0/15.0
- 1% rule +10.0/10.0
- DSCR +10.0/10.0
- Livability +3.5/5.0
- Schools +3.2/10.0
- Rent growth +2.8/5.0
- Condition / age +2.5/5.0
- Appreciation +0.0/10.0
$95,000
🖨 Deal sheet 📄 Offer letter ✓ Due diligence
Listing remarks
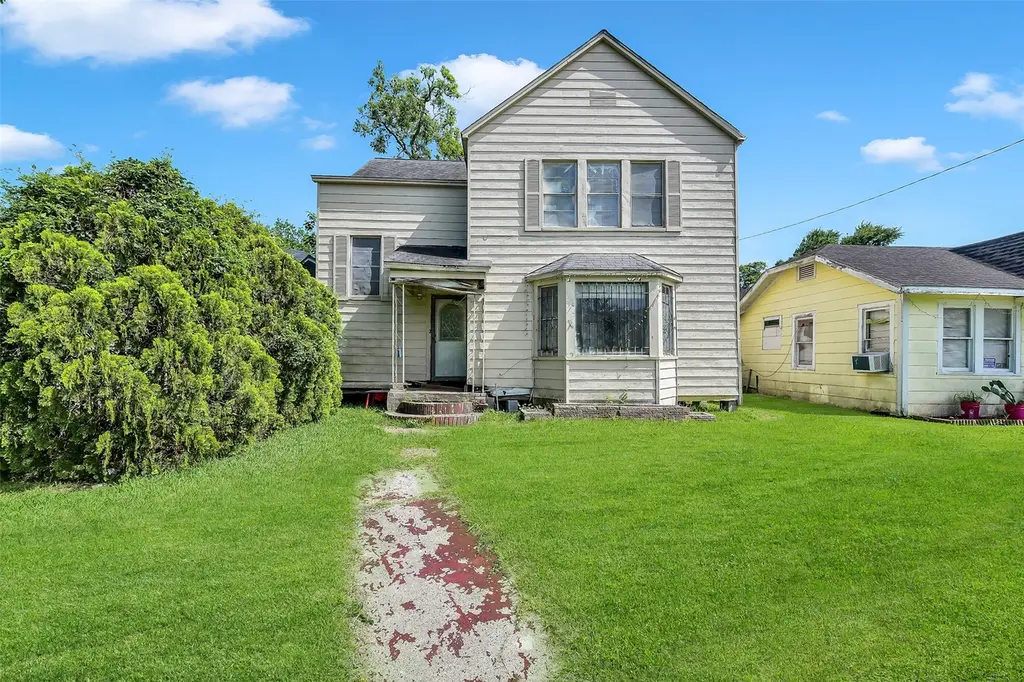
INVESTOR OPPORTUNITY! Property sold as-is, offering a great opportunity to add value through renovation. Ideal for a rental hold or project for buyers looking to bring their vision to life. Per seller, property has not flooded and is not in a flood zone. Buyer to verify all information independently. Located in the heart of East Baytown, this 3-bedroom, 2-bath single-family home offers approximately 1,992 sq ft of living space on a 0.11-acre lot. Built in 1932, the home features a traditional layout with all bedrooms located upstairs and a functional floor plan suited for renovation or investment potential. Conveniently located near W Main St and TX-146, the home provides quick access to ma
Key facts
- Not in a flood zone
- Investor opportunity
- 5,000 sq ft lot
Tags
Property features AI
Finance
- Other: Approximately 1,992 livable area; Lot about 5,000 square feet (0.1148 acres); Seller disclosure available; Lease not considered
Exterior
- Utilities: Public water; Public sewer
- Home design: Residential property; Built in 1932; Pillar/post/pier foundation
- Construction: Wood siding; Composition roof
- Exterior features: Private yard; Subdivision lot
Interior
- Kitchen: Free-standing range; Gas oven; Gas range; Oven
- Bedrooms: 6 total rooms (includes bedrooms and living spaces)
- Flooring: Wood floors
- Bathrooms: 2 full bathrooms
- Heating & cooling: Central heating (gas); Central electric air conditioning
- Interior features: Washer hookup; Gas dryer hookup; Free-standing range; Gas oven; Gas range; Oven
- Laundry & utility: Washer hookup; Gas dryer hookup
Neighborhood map
What this means for you Summary
Snapshot
- This is a 3-bed/2.0-bath single-family listed at $95k.
Deal economics
- At list price, monthly cash flow is $429 ($5k/yr) — positive.
- The deal already cash-flows at list — no discount required.
- Meets the 1% rule at list price ($2k rent vs $95k).
- Recommended offer: $94k (1.5% below list) — sets the bar for market timing.
- Cap rate 11.7% vs local median 4.2% in Baytown — top-decile yield for the area; either an underpriced asset or a hidden risk that comps aren't pricing in. Stress-test before assuming the spread holds.
Location & tenants
- Location reads 69/100 on livability (#412 in TX) — a middle-class / working-renter tenant base. Strengths: cost of living A+, housing A+; Watch: employment D+, crime F, amenities F.
- Goose Creek CISD (urban): math 37% / reading 36% proficiency, ranked #473 of 826 in TX (top 57%) — families likely to look elsewhere, expect single-tenant / working-renter base with shorter leases; 61% free/reduced lunch — lower-income household profile, screen leases tightly.
- Zoned schools: San Jacinto El (math 32% / reading 27%, grade F, #2,525 of 4,322 statewide, top 62%, 657 students, 91% FRL); High Point School (12 students, 75% FRL) — zoned schools average 83% FRL vs 61% district-wide (22 pts higher); higher-poverty schools than district average — tighter screening recommended.
- Market conditions: Rents rising (+1.3%/yr); 271 active listings in the ZIP; 29,883 units permitted in Harris County in 2024 (8,621 in 5+ unit buildings).
Forward outlook
- Local home prices are declining (-3.0%/yr); year-one equity from $657 of loan paydown is wiped out by about $3k of value loss. Plan a longer hold.
- Harris County population projected at +47% by 2050 — long-run rental-demand tailwind backs the buy-and-hold thesis.
- At projected returns (-3.0% appreciation + 1.3% rent growth), your $27k cash investment doubles in ~8 years — after that, you're playing with house money.
Negotiation context
- It's been on market 20 days — a 2% lower offer ($94k) is reasonable based on typical stale-listing flexibility.
- 4 sale attempts with the ask held roughly flat each time — persistent listings suggest the price (not the market) is what's stuck; bring a comps-based counter.
- Current owner paid $21k; list at $95k implies a 352% gain — meaningful room to come down on a strong offer.
Risks & watch-outs
- Watch-outs: property tax is 2.9% of price; built in 1932 — expect roof / HVAC / electrical / plumbing capex.
- Climate carrying-cost: moderate flood risk; severe wind risk, 99% chance of damaging wind over 30y; extreme-heat days projected 7→25/yr by 2055 (HVAC capex compounding) — expect insurance premiums to compound above CPI over the hold.
Questions for the listing agent
- Built in 1932 — when were the roof, HVAC, electrical panel, plumbing, and water heater last replaced?
- Property tax is high relative to price — has the assessment been appealed recently, and will the sale trigger a re-assessment?
- Is there a deadline driving the sale (1031 exchange, divorce, estate, relocation)? That informs how much negotiation room exists.
- Schools are D-rated, which usually means shorter tenancies and higher turnover. Who's the typical renter profile here, and what's been the actual vacancy rate?
- Crime grade is F in this area — have there been break-ins, vandalism, or insurance claims at this property in the last 3 years? What carrier currently insures it and at what premium?
- What's the average days-on-market for RENTAL listings here right now (not sales)? A rising rental-DOM trend means longer vacancies and softer asking-rent achievability than the comps imply.
- What's the recent tenant-quality profile in this submarket — average credit score on applications, eviction rate, late-payment / NSF rate, and stable-employment percentage? A property-management company in the area should have these aggregated.
- How much new for-sale + rental construction is in the pipeline within 1–3 miles? Heavy new supply typically softens prices + rents 12–24 months out; constrained supply supports both.
Investment metrics
- 1% rule
- 1.59% ✓
- Cap rate
- 11.71%
- Cash-on-cash
- 19.33%
- DSCR
- 1.86
- GRM
- 5.2
CMA / ARV
- ARV (median comp)
- $170,707
- List price
- $95,000
- Delta
- -32.63%
- Verdict
- UNDERPRICED
- Comps
- 20 within 1.0 mi
Show comp detail 9 sales within ~0.75 mi
| Address | Dist | Beds/Ba | Sqft | Sold | Price | $/sf | Match |
|---|---|---|---|---|---|---|---|
| 1908 Mississippi St | 0.51mi | 3/2.0 | 1,898 (-5%) | 2mo | $185,000 | $97 | 67 |
| 1917 Utah St | 0.20mi | 3/2.0 | 1,742 (-13%) | 5mo | $191,000 | $110 | 65 |
| 1406 N Dakota St | 0.65mi | 4/2.0 (+1) | 1,995 (+0%) | 1mo | $165,000 | $83 | 64 |
| 1904 Kansas St | 0.43mi | 4/2.0 (+1) | 1,880 (-6%) | 10mo | $214,000 | $114 | 57 |
| 2103 Britton St | 0.54mi | 3/2.0 | 2,123 (+7%) | 14mo | $259,999 | $122 | 52 |
| 1505 Missouri St | 0.68mi | 4/2.0 (+1) | 2,144 (+8%) | 2mo | $330,000 | $154 | 49 |
| 3214 Indiana St | 0.25mi | 3/2.5 | 1,695 (-15%) | 19mo | $273,000 | $161 | 46 |
| 1700 Mississippi St | 0.52mi | 4/3.5 (+1) | 1,970 (-1%) | 22mo | $260,000 | $132 | 45 |
| 1815 Oregon St | 0.41mi | 4/2.5 (+1) | 1,767 (-11%) | 23mo | $214,999 | $122 | 36 |
Match score weights: distance 35% · size 25% · config 20% · recency 20%. Top-matched comps best support the ARV.
Projected returns pro-forma
-3.0% appreciation · 1.3% rent growth · sell at horizon
- IRR
- 9.2%
- Equity multiple
- 1.36×
- Total profit
- $9,445
- Equity at exit
- $14,165
- IRR
- 16.8%
- Equity multiple
- 2.26×
- Total profit
- $33,638
- Equity at exit
- $8,214
Cash invested: $26,600 (down + closing). Projections, not guarantees.
Landlord ↔ Tenant lean methodology
- Overall (STATE)
- 87 Strongly Landlord-Friendly
- State Texas
- 87 Strongly Landlord-Friendly · R+5
- County
- — inherits STATE
- City
- — inherits STATE
ZIP-level market 77520
- Rents YoY
- 1.3%
- Active inventory
- 271
- Price-to-rent
- 5.2×
Monthly cashflow live
- Estimated rent
- $1,515 medium interval (Pro) →
- Mortgage (P&I)
- −$498
- Tax from tax record
- −$230 /mo · $2,764/yr
- Insurance
- −$40
- HOA
- −$0
- Vacancy / Maint / Mgmt
- −$318
- Net cashflow
- $429
Break-even live
UW: 25.0% down · 7.5% · 30yr · 1.5% tax · 5.0% vac · 8.0% maint · 8.0% mgmt
Financing live
Cash to close
- Down payment
- $23,750
- Closing costs
- $2,850
- Reserves months
- —
- Total cash needed
- —
Loan-product check · same deal, 3 products live
Conventional
25% down · 7.5% · 30yr
- Down + closing
- —
- Monthly P&I
- —
- Monthly cashflow
- —
- DSCR
- —
- Eligible?
- —
Personal DTI + credit; lowest rate.
DSCR
20% down · 8.5% · 30yr
- Down + closing
- —
- Monthly P&I
- —
- Monthly cashflow
- —
- DSCR
- —
- Eligible?
- —
No personal income docs; deal must DSCR.
Hard money
10% down · 12.0% · 12mo
- Down + closing
- —
- Monthly P&I
- —
- Monthly cashflow
- —
- DSCR
- —
- Eligible?
- —
Short-term bridge; refi at stabilization.
Listing history 18 events
-
2026-06-18days on market $95,000 Active 20 DOM
-
2026-06-17days on market $95,000 Active 19 DOM
-
2026-06-16days on market $95,000 Active 18 DOM
-
2026-06-15days on market $95,000 Active 17 DOM
-
2026-06-13days on market $95,000 Active 15 DOM
-
2026-06-09days on market $95,000 Active 11 DOM
-
2026-06-07days on market $95,000 Active 9 DOM
-
2026-06-04days on market $95,000 Active 6 DOM
-
2026-06-03days on market $95,000 Active 5 DOM
-
2026-06-02days on market $95,000 Active 4 DOM
-
2026-06-01days on market $95,000 Active 3 DOM
-
2026-05-31days on market $95,000 Active 2 DOM
-
2026-05-07status Pending 783-char remark
-
2026-04-24$115,000 Active 783-char remark
-
2025-08-16historical
-
2025-07-17$130,000 Active
-
2016-03-30soldstatus
-
1998-10-23soldstatus $21,000
ⓘ Source: listings_history table (triggers on properties + properties_extension) + one-shot
backfill from property_details.listing_events for pre-trigger history.
Tax reassessment forecast TX · Resets to sale price
- Current annual tax
- $2,764 · $230/mo
- Projected year-2 tax
- $2,764 · $230/mo
- Expected delta
- $0/yr ($0/mo · 0.0%)
ⓘ Screening estimate from a state-policy table — verify with the county assessor before closing.
Climate risk First Street
- Flood 5/10 Major FEMA zone X (unshaded) · 42% chance over 30 yrs
- Wildfire 1/10 Low
- Heat 9/10 Extreme 7 d/yr ≥108°F today · 25 d/yr by 30 yrs out
- Wind 9/10 Extreme 99% chance of damaging wind over 30 yrs
- Air quality 2/10 Low 1 unhealthy d/yr today · 2 by 30 yrs out
Nearby sold comps map
Loading sold comps map…
Walkable amenities ~0.75 mi
Loading nearby amenities…
Taxation est. · year 1
- Rental income
- $18,177
- − Mortgage interest
- −$5,321
- − Property taxes
- −$2,764
- − Insurance
- −$475
- − Repairs & maintenance
- −$1,454
- − Management
- −$1,454
- − Depreciation
- −$2,764
- Taxable income
- $3,945
- Est. tax owed @ 24.0%
- −$947
- After-tax cash flow
- $4,196/yr
For passive investors: Depreciation is non-cash, so a rental often shows a tax loss while cash-flowing — sheltering income. Rental losses are passive: they offset passive income freely, and up to $25,000/yr can offset ordinary (W-2) income if you actively participate and your MAGI is under $100k (phasing out to $0 by $150k); unused losses carry forward. On sale, claimed depreciation is recaptured at up to 25%, and gains may owe capital-gains tax (a 1031 exchange can defer both). Figures are a year-1 estimate at your 24.0% rate — not tax advice; consult a CPA.
Schools (NCES district)
- District
- Goose Creek CISD
- NCES district ID
- 4821150
- Math proficiency
- 37% ▼ -11.00%
- Reading proficiency
- 36% ▼ -4.00%
- Median HH income
- $52,468
- Composite
- 31.84/100
- National rank
- #5877
- State rank
- #473 of 826 in TX
Livability — Baytown
- Score
- 69/100
- State rank
- #412
- US rank
- #8494
Category grades
Schools grade is shown separately in the Schools card above.
Census & demographics
- Census place
- Baytown, TX
- County
- Harris County · 4,702,590 people
- City population
- 135,579
- Metro
- Houston-The Woodlands-Sugar Land, TX
- Population (ZIP)
- 36,355
- Household income
- $54,278
- Rent vs Own
- Severe rent burden
- 1559.0
Population outlook (Harris County) Hauer SSP2
- Today (2025)
- 5,571,493 people
- By 2030
- 6,089,821 · +9.3%
- By 2040
- 7,142,806 · +28.2%
- By 2050
- 8,185,864 · +46.9%
- By 2075
- 10,574,329 · +89.8%
- By 2100
- 12,109,958 · +117.4%
Race, ethnicity, and origin ACS 2023
- Neighborhood character
- Diverse neighborhood (Simpson 0.60)
- Race & ethnicity
- Hispanic / Latino 55% White 30% Two or more races 19% Black 10% Asian 2%
- Hispanic origin (detail)
- Mexican 48%
- Common ancestry
- Italian 1% Lithuanian 1% Romanian 1%
- Foreign-born
- 21% · Canada, Vietnam
- Languages at home
- 55% English-only · Spanish 43% Other Asian/Pacific 1% Other Indo-European 1%
Political lean MEDSL · Harris
- 2024 margin
- Lean D (+5.5) · D 52.0% · R 46.4% · Other 1.6%
- 2008→2024 swing
- +3.9pp toward D · 2008: 1.6pp · 2024: 5.5pp
- All cycles
- 2024: D+5.5 2020: D+13.3 2016: D+12.4 2012: D+0.1 2008: D+1.6
Not yet ingested
- Civics
- —
Market trends
- HPI YoY
- ▼ -143.36%
- Current HPI
- 262.066
- Rent YoY
- ▲ 1.30%
- Metro
- Houston-The Woodlands-Sugar Land, TX
- State GDP YoY
- ▲ 3.95%
- F500 in state
- 110
Industry mix (Fortune 500 HQ in TX)
| Industry | F500 HQs | Revenue |
|---|---|---|
| Energy | 16 | $1,198B |
|
||
| Technology | 5 | $198B |
|
||
| Engineering / Construction | 4 | $72B |
|
||
| Energy Services | 3 | $60B |
|
||
| Utilities | 3 | $41B |
|
||
| Healthcare | 2 | $330B |
|
||
Price history
+352.4% since first listed9 events — show timeline
- 2026-05-29 Relisted — HARMLS
- 2026-05-29 Listed $95,000 HARMLS
- 2026-05-29 Listing Removed — HARMLS
- 2026-05-07 Pending — HARMLS
- 2026-04-24 Listed $115,000 HARMLS
- 2025-08-16 Listing Removed — HARMLS
- 2025-07-17 Listed $130,000 HARMLS
- 2016-03-30 Sold (Public Records) — Public Records
- 1998-10-23 Sold (Public Records) $21,000 Public Records
Property tax history
+7.6%/yrLatest (2025): $2,764 · +10.3% YoY. Source: county tax records.
Cash-flow waterfall
monthlySold comps — $/sqft
last 12 mo · ≤1 miLoading sold comps…