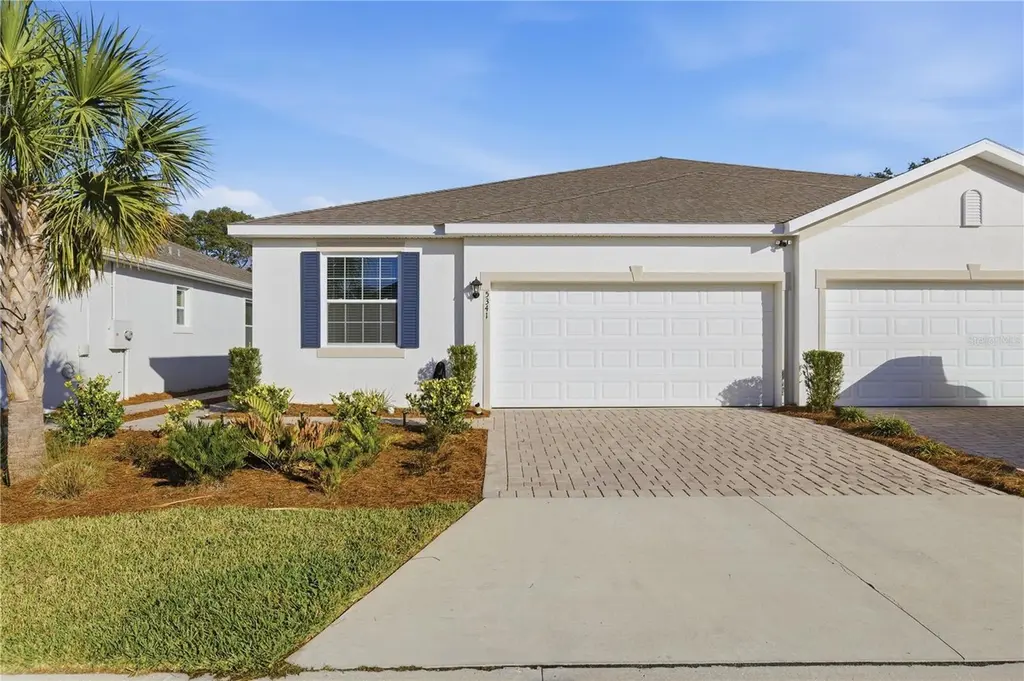
5341 NW 48th Pl · Ocala, FL
Flood risk 1/10 · Minimal
- FEMA flood zone
- X (unshaded)
- Chance of flooding over 30 yrs
- 0.0%
- Est. flood insurance / yr
- $507 – $1,088
Fire risk 5/10 · Moderate
- Est. fire insurance / yr
- $947 – $1,759
Heat risk 8/10 · Major
- Hot days now (above 107°F)
- 7 days/yr
- Hot days in 30 yrs
- 22 days/yr
Wind risk 9/10 · Severe
- Chance of severe wind over 30 yrs
- 99.0%
Air-quality risk 3/10 · Minor
- Unhealthy air days now
- 3 days/yr
- Unhealthy air days in 30 yrs
- 3 days/yr
Risk factors via First Street. Map © Google.
Why this score? — see what drove the D- grade
The composite is a weighted blend of 9 inputs, each scored 0–100. Each bar is that input's sub-score; the figure is the points it added to the 100-point composite (weight × sub-score).
- ARV discount +8.0/15.0
- Cash flow +7.8/30.0
- Rent growth +5.0/5.0
- Condition / age +4.0/5.0
- 1% rule +3.9/10.0
- Schools +3.6/10.0
- Livability +3.5/5.0
- DSCR +1.9/10.0
- Appreciation +0.0/10.0
$285,000
🖨 Deal sheet (PDF) 📄 Offer letter ✓ Due diligence
Listing remarks MLS
Experience resort-style living in one of Ocala’s most desirable communities—Ocala Preserve. This beautifully upgraded home sits steps from miles of walking, hiking, and biking trails, with exclusive access to premier amenities including tennis and pickleball courts, a resort-style pool, athletic center, golf club, clubhouse, day spa, dog park, and the scenic community lake where you can enjoy peaceful sunrise kayaking. Dine on-site at the acclaimed Salt Brick Restaurant or unwind on the expansive community veranda with stunning sunset views. Designed for modern living, this home features an open-concept layout with a chef-inspired kitchen offering a large granite island, high-end appliances, and recently updated refrigerator and washer/dryer. The great room opens to an enclosed lanai, creating seamless indoor-outdoor living with tranquil views of the private nature walking trail behind the property. The primary suite includes a generous walk-in closet and en-suite bathroom. A versatile third bedroom functions perfectly as an office, den, or flex space. Interior enhancements include fresh paint, updated lighting, new hardware, updated doors and refined design touches throughout. Perfectly located near WEC, downtown Ocala, restaurants, and shopping, this home offers the ideal blend of luxury, convenience, and natural beauty—truly resort living at its finest.
Key facts
- Exclusive access
- Resort style pool
- Athletic center
Tags
Neighborhood map
What this means for you Summary
Snapshot
- This is a 2-bed/2.0-bath single-family listed at $285k. Condition is rated good.
Deal economics
- At list price, monthly cash flow is $-316 ($-4k/yr) — negative.
- To cash-flow at today's rent, offer at most $229k (19.6% below list).
- To meet the 1% rule (rent ≥ 1% of price), the offer needs to be $254k (11.0% below list).
- Recommended offer: $229k (19.6% below list) — sets the bar for cash-flow.
Location & tenants
- Location reads 69/100 on livability (#476 in FL) — a middle-class / working-renter tenant base. Strengths: cost of living A+, housing A+, health & safety A+; Watch: crime F, amenities F, commute F.
- Marion (rural): math 42% / reading 43% proficiency, ranked #61 of 73 in FL (top 84%) — families likely to look elsewhere, expect single-tenant / working-renter base with shorter leases; 61% free/reduced lunch — lower-income household profile, screen leases tightly.
- Zoned schools: Fessenden Elementary School (math 37% / reading 37%, grade F, #1,609 of 2,144 statewide, top 77%, 417 students, 79% FRL); Howard Middle School (math 47% / reading 50%, grade C-, #274 of 571 statewide, top 50%, 980 students, 60% FRL); West Port High School (math 34% / reading 52%, grade F, #255 of 667 statewide, top 39%, 2,906 students, 52% FRL) — zoned schools at 64% FRL track the district average.
- Market conditions: Rents rising fast (+11.1%/yr); 670 active listings in the ZIP; 31 comparable units currently listed for rent nearby; rentals at typical pace (median 23d on market — plan ~3-4 weeks tenant-placement turnaround); 7,071 units permitted in Marion County in 2024 (534 in 5+ unit buildings).
- At $2,536/mo this rent would consume 46% of the median local household income ($66k/yr) (locally 282% of renters already pay >50% of income on rent) — very limited rent-growth headroom before tenants either downsize or default.
Forward outlook
- Local home prices are declining (-3.0%/yr); year-one equity from $2k of loan paydown is wiped out by about $9k of value loss. Plan a longer hold.
- Marion County population projected at +13% by 2050 — modest demand growth; plan on rents tracking national, not racing it.
Negotiation context
- It's been on market 177 days — a 12% lower offer ($251k) is reasonable based on typical stale-listing flexibility.
- 4 sale attempts since 3y ago with the ask held roughly flat each time — persistent listings suggest the price (not the market) is what's stuck; bring a comps-based counter.
Risks & watch-outs
- Climate carrying-cost: severe wind risk, 99% chance of damaging wind over 30y; moderate wildfire risk; extreme-heat days projected 7→22/yr by 2055 (HVAC capex compounding) — expect insurance premiums to compound above CPI over the hold.
Questions for the listing agent
- What do current leases actually rent for vs. the listed asking? Can we see a recent rent roll and the last 12 months of T-12 income?
- It's been on market 177 days. Have you received any prior offers? Is the seller open to a 20% concession, seller financing, or rate buy-down credit?
- What does the HOA fee cover, when was the last increase, and are there any pending special assessments or reserve-fund shortfalls?
- Why hasn't it sold? Are there any deal-killer items the seller is aware of (foundation, flood, title, zoning, code violations)?
- Is there a deadline driving the sale (1031 exchange, divorce, estate, relocation)? That informs how much negotiation room exists.
- Crime grade is F in this area — have there been break-ins, vandalism, or insurance claims at this property in the last 3 years? What carrier currently insures it and at what premium?
- The area grade is low — what's the realistic commute time and amenity access for the typical tenant pool here? Any planned neighborhood developments (good or bad) we should know about?
- What's the average days-on-market for RENTAL listings here right now (not sales)? A rising rental-DOM trend means longer vacancies and softer asking-rent achievability than the comps imply.
- What's the recent tenant-quality profile in this submarket — average credit score on applications, eviction rate, late-payment / NSF rate, and stable-employment percentage? A property-management company in the area should have these aggregated.
- How much new for-sale + rental construction is in the pipeline within 1–3 miles? Heavy new supply typically softens prices + rents 12–24 months out; constrained supply supports both.
Investment metrics
- 1% rule
- 0.89% ✗
- Cap rate
- 4.96%
- Cash-on-cash
- -4.76%
- DSCR
- 0.79
- GRM
- 9.4
CMA / ARV
- ARV (median comp)
- $288,027
- List price
- $285,000
- Delta
- -1.05%
- Verdict
- FAIR
- Comps
- 20 within 1.0 mi
Show comp detail 12 sales within ~0.75 mi
| Address | Dist | Beds/Ba | Sqft | Sold | Price | $/sf | Match |
|---|---|---|---|---|---|---|---|
| 5268 NW 48th Pl | 0.08mi | 3/2.0 (+1) | 1,552 (0%) | 3mo | $215,000 | $139 | 89 |
| 5217 NW 43rd Lane Rd | 0.14mi | 2/2.0 | 1,565 (+1%) | 15mo | $262,990 | $168 | 80 |
| 5472 NW 46th Lane Rd | 0.13mi | 3/2.0 (+1) | 1,505 (-3%) | 8mo | $264,900 | $176 | 78 |
| 5463 NW 56th Ter | 0.48mi | 3/2.0 (+1) | 1,473 (-5%) | 1mo | $292,000 | $198 | 63 |
| 4802 NW 39th Street Rd | 0.75mi | 2/2.0 | 1,565 (+1%) | 1mo | $256,150 | $164 | 63 |
| 5200 NW 54th Pl | 0.45mi | 3/2.0 (+1) | 1,568 (+1%) | 15mo | $309,900 | $198 | 60 |
| 5585 NW 56th Ter | 0.55mi | 3/2.0 (+1) | 1,473 (-5%) | 2mo | $295,000 | $200 | 59 |
| 5430 NW 55th Pl | 0.48mi | 3/2.0 (+1) | 1,384 (-11%) | 10mo | $247,000 | $178 | 46 |
| 5320 NW 56th Ter | 0.42mi | 3/2.0 (+1) | 1,399 (-10%) | 17mo | $264,000 | $189 | 45 |
| 5414 NW 55 Ct | 0.44mi | 3/2.0 (+1) | 1,381 (-11%) | 21mo | $269,900 | $195 | 38 |
| 5632 NW 57th St | 0.62mi | 3/2.0 (+1) | 1,331 (-14%) | 8mo | $239,900 | $180 | 36 |
| 5668 NW 57 St | 0.63mi | 3/2.0 (+1) | 1,331 (-14%) | 20mo | $239,900 | $180 | 26 |
Match score weights: distance 35% · size 25% · config 20% · recency 20%. Top-matched comps best support the ARV.
Projected returns pro-forma
-3.0% appreciation · 8.0% rent growth · sell at horizon
- IRR
- -17.8%
- Equity multiple
- 0.34×
- Total profit
- $-52,681
- Equity at exit
- $42,494
- IRR
- -1.4%
- Equity multiple
- 0.88×
- Total profit
- $-9,807
- Equity at exit
- $24,642
Cash invested: $79,800 (down + closing). Projections, not guarantees.
Landlord ↔ Tenant lean methodology
- Overall (STATE)
- 87 Strongly Landlord-Friendly
- State Florida
- 87 Strongly Landlord-Friendly · R+3
- County
- — inherits STATE
- City
- — inherits STATE
ZIP-level market 34482
- Rents YoY
- 11.1%
- Active inventory
- 670
- Price-to-rent
- 9.4×
Monthly cashflow live
- Estimated rent
- $2,536 high interval (Pro) →
- Mortgage (P&I)
- −$1,495
- Tax from tax record
- −$269 /mo · $3,230/yr
- Insurance
- −$119
- HOA
- −$437
- Vacancy / Maint / Mgmt
- −$532
- Net cashflow
- $-316
Break-even live
Sensitivity live
| Price | -10% $-155 | -5% $-236 | +0% $-316 | +5% $-397 | +10% $-478 |
|---|---|---|---|---|---|
| Rent | -10% $-517 | -5% $-417 | +0% $-316 | +5% $-216 | +10% $-116 |
| Rate | -1.0pp $-173 | -0.5pp $-244 | base $-316 | +0.5pp $-390 | +1.0pp $-465 |
UW: 25.0% down · 7.5% · 30yr · 1.5% tax · 5.0% vac · 8.0% maint · 8.0% mgmt
Financing live
Cash to close
- Down payment
- $71,250
- Closing costs
- $8,550
- Reserves months
- —
- Total cash needed
- —
Loan-product check · same deal, 3 products live
Conventional
25% down · 7.5% · 30yr
- Down + closing
- —
- Monthly P&I
- —
- Monthly cashflow
- —
- DSCR
- —
- Eligible?
- —
Personal DTI + credit; lowest rate.
DSCR
20% down · 8.5% · 30yr
- Down + closing
- —
- Monthly P&I
- —
- Monthly cashflow
- —
- DSCR
- —
- Eligible?
- —
No personal income docs; deal must DSCR.
Hard money
10% down · 12.0% · 12mo
- Down + closing
- —
- Monthly P&I
- —
- Monthly cashflow
- —
- DSCR
- —
- Eligible?
- —
Short-term bridge; refi at stabilization.
Rent comps 31 comps
| Address | Beds | Baths | Sqft | Rent | $/sqft | DOM | Units | Dist |
|---|---|---|---|---|---|---|---|---|
| 5375 NW 48th Pl Ocala, FL | 2.0 | 2.0 | 1565 | $2,350 | $1.50 | 22d | 1 | 0.05mi |
| 5389 NW 48th Pl Ocala, FL | 2.0 | 2.0 | 1552 | $2,300 | $1.48 | 22d | 1 | 0.06mi |
| 5358 NW 48th Pl Ocala, FL | 3.0 | 2.0 | 1565 | $2,500 | $1.60 | 22d | 1 | 0.06mi |
| 5293 NW 48th Pl Ocala, FL | 2.0 | 2.0 | 1552 | $2,450 | $1.58 | 22d | 1 | 0.06mi |
| 5237 NW 48th Pl Ocala, FL | 3.0 | 2.0 | 1552 | $4,500 | $2.90 | 22d | 1 | 0.12mi |
| 5416 NW 46th Lane Rd Ocala, FL | 3.0 | 2.0 | 1590 | $2,300 | $1.45 | 15d | 1 | 0.13mi |
| 5347 NW 46th Lane Rd Ocala, FL | 3.0 | 2.0 | 1552 | $2,550 | $1.64 | 22d | 1 | 0.13mi |
| 5254 NW 43rd Lane Rd Ocala, FL | 3.0 | 2.0 | 1728 | $3,500 | $2.03 | 22d | 1 | 0.16mi |
| 5521 NW 45th Ln Ocala, FL | 3.0 | 2.0 | 1862 | $2,600 | $1.40 | 15d | 1 | 0.28mi |
| 5391 NW 55th Ct Ocala, FL | 3.0 | 2.0 | 1332 | $1,650 | $1.24 | 22d | 1 | 0.39mi |
| 4395 NW 55th Ter Ocala, FL | 3.0 | 2.0 | 1853 | $2,700 | $1.46 | 22d | 1 | 0.41mi |
| 4342 NW 55th Ct Ocala, FL | 3.0 | 2.5 | 2172 | $2,600 | $1.20 | 15d | 1 | 0.43mi |
| 5530 NW 40th Loop Ocala, FL | 3.0 | 2.0 | 1622 | $2,000 | $1.23 | 22d | 1 | 0.60mi |
| 4122 NW 48th Terrace Rd Ocala, FL | 2.0 | 2.0 | 1816 | $1,999 | $1.10 | 15d | 1 | 0.68mi |
| 4743 NW 39th Street Rd Ocala, FL | 3.0 | 2.0 | 1565 | $2,500 | $1.60 | 22d | 1 | 0.80mi |
| 4111 NW 44th Cir Ocala, FL | 3.0 | 2.0 | 1505 | $2,300 | $1.53 | 15d | 1 | 0.83mi |
| 4110 NW 44th Cir Ocala, FL | 3.0 | 2.0 | 1610 | $2,400 | $1.49 | 15d | 1 | 0.86mi |
| 4859 NW 35th Lane Rd Ocala, FL | 2.0 | 2.0 | 1666 | $2,495 | $1.50 | 22d | 1 | 0.86mi |
| 4078 NW 44th Cir Ocala, FL | 3.0 | 2.0 | 1504 | $2,500 | $1.66 | 22d | 1 | 0.90mi |
| 5423 NW 35th Lane Rd Ocala, FL | 2.0 | 2.0 | 1656 | $3,200 | $1.93 | 22d | 1 | 0.94mi |
| 6175 NW 59th Ave Ocala, FL | 3.0 | 2.0 | 1384 | $1,745 | $1.26 | 22d | 1 | 1.02mi |
| 5191 NW 34th St Ocala, FL | 2.0 | 2.0 | 1318 | $2,400 | $1.82 | 22d | 1 | 1.04mi |
| 5401 NW 63rd Pl Ocala, FL | 3.0 | 2.0 | 1894 | $1,695 | $0.89 | 15d | 1 | 1.05mi |
| 5471 NW 34th St Ocala, FL | 2.0 | 2.0 | 1318 | $2,900 | $2.20 | 22d | 1 | 1.06mi |
| 5048 NW 35th St Ocala, FL | 3.0 | 2.0 | 1552 | $1,900 | $1.22 | 15d | 1 | 1.07mi |
| 3384 NW 54th Ct Ocala, FL | 2.0 | 2.5 | 1722 | $2,300 | $1.34 | 22d | 1 | 1.08mi |
| 5333 NW 33rd Pl Ocala, FL | 2.0 | 2.0 | 1368 | $2,300 | $1.68 | 15d | 1 | 1.11mi |
| 5361 NW 33rd Pl Ocala, FL | 2.0 | 2.0 | 1318 | $2,500 | $1.90 | 22d | 1 | 1.11mi |
| 3335 NW 52nd Avenue Rd Ocala, FL | 2.0 | 2.5 | 1318 | $2,500 | $1.90 | 22d | 1 | 1.12mi |
| 5353 N US Highway 27 Ocala, FL | 1.0–3.0 | 1.0–2.0 | 1169 | $1,785 | $1.53 | 22d | 1 | 1.35mi |
| 6425 NW 62nd Ter Ocala, FL | 3.0 | 2.0 | 1349 | $3,000 | $2.22 | 22d | 1 | 1.38mi |
HOA detail
- Monthly dues
- $437 · $5,244/yr
- Likely covers
- pool
Listing history 32 events
-
2026-06-18days on market $285,000 Active 177 DOM
-
2026-06-17days on market $285,000 Active 176 DOM
-
2026-06-16days on market $285,000 Active 175 DOM
-
2026-06-15days on market $285,000 Active 174 DOM
-
2026-06-14days on market $285,000 Active 172 DOM
-
2026-06-13days on market $285,000 Active 171 DOM
-
2026-06-10days on market $285,000 Active 169 DOM
-
2026-06-09days on market $285,000 Active 168 DOM
-
2026-06-08days on market $285,000 Active 167 DOM
-
2026-06-07days on market $285,000 Active 166 DOM
-
2026-06-03days on market $285,000 Active 162 DOM
-
2026-06-02days on market $285,000 Active 161 DOM
-
2026-05-31days on market $285,000 Active 159 DOM
-
2026-05-30days on market $285,000 Active 158 DOM
-
2026-04-10price $285,000 1396-char remark
Show marketing remark (1396 chars)
Experience resort-style living in one of Ocala’s most desirable communities—Ocala Preserve. This beautifully upgraded home sits steps from miles of walking, hiking, and biking trails, with exclusive access to premier amenities including tennis and pickleball courts, a resort-style pool, athletic center, golf club, clubhouse, day spa, dog park, and the scenic community lake where you can enjoy peaceful sunrise kayaking. Dine on-site at the acclaimed Salt Brick Restaurant or unwind on the expansive community veranda with stunning sunset views. Designed for modern living, this home features an open-concept layout with a chef-inspired kitchen offering a large granite island, high-end appliances, and recently updated refrigerator and washer/dryer. The great room opens to an enclosed lanai, creating seamless indoor-outdoor living with tranquil views of the private nature walking trail behind the property. The primary suite includes a generous walk-in closet and en-suite bathroom. A versatile third bedroom functions perfectly as an office, den, or flex space. Interior enhancements include fresh paint, updated lighting, new hardware, updated doors and refined design touches throughout. Perfectly located near WEC, downtown Ocala, restaurants, and shopping, this home offers the ideal blend of luxury, convenience, and natural beauty—truly resort living at its finest.
-
2025-12-23$295,000 Active 1396-char remark
Show marketing remark (1396 chars)
Experience resort-style living in one of Ocala’s most desirable communities—Ocala Preserve. This beautifully upgraded home sits steps from miles of walking, hiking, and biking trails, with exclusive access to premier amenities including tennis and pickleball courts, a resort-style pool, athletic center, golf club, clubhouse, day spa, dog park, and the scenic community lake where you can enjoy peaceful sunrise kayaking. Dine on-site at the acclaimed Salt Brick Restaurant or unwind on the expansive community veranda with stunning sunset views. Designed for modern living, this home features an open-concept layout with a chef-inspired kitchen offering a large granite island, high-end appliances, and recently updated refrigerator and washer/dryer. The great room opens to an enclosed lanai, creating seamless indoor-outdoor living with tranquil views of the private nature walking trail behind the property. The primary suite includes a generous walk-in closet and en-suite bathroom. A versatile third bedroom functions perfectly as an office, den, or flex space. Interior enhancements include fresh paint, updated lighting, new hardware, updated doors and refined design touches throughout. Perfectly located near WEC, downtown Ocala, restaurants, and shopping, this home offers the ideal blend of luxury, convenience, and natural beauty—truly resort living at its finest.
-
2025-08-14historical
-
2025-02-14$290,000 Active
-
2023-09-26soldstatus $267,990 Closed
-
2023-08-24status Pending
-
2023-08-24status Active
-
2023-08-24price $267,990
-
2023-08-14status Pending
-
2023-08-08price $269,990
-
2023-08-01price $272,990
-
2023-07-18price $274,990
-
2023-07-17price $278,990
-
2023-07-10price $277,990
-
2023-06-05price $274,990
-
2023-05-08price $272,990
-
2023-04-17price $270,990
-
2023-03-27$267,990 Active
ⓘ Source: listings_history table (triggers on properties + properties_extension) + one-shot
backfill from property_details.listing_events for pre-trigger history.
Tax reassessment forecast FL · Resets to sale price
- Current annual tax
- $3,230 · $269/mo
- Projected year-2 tax
- $3,230 · $269/mo
- Expected delta
- $0/yr ($0/mo · 0.0%)
ⓘ Screening estimate from a state-policy table — verify with the county assessor before closing.
Climate risk First Street
- Flood 1/10 Low FEMA zone X (unshaded) · 0% chance over 30 yrs
- Wildfire 5/10 Major
- Heat 8/10 Severe 7 d/yr ≥107°F today · 22 d/yr by 30 yrs out
- Wind 9/10 Extreme 99% chance of damaging wind over 30 yrs
- Air quality 3/10 Moderate 3 unhealthy d/yr today · 3 by 30 yrs out
Nearby sold comps map
Loading sold comps map…
Walkable amenities ~0.75 mi
Loading nearby amenities…
Taxation est. · year 1
- Rental income
- $30,426
- − Mortgage interest
- −$15,964
- − Property taxes
- −$3,230
- − Insurance
- −$1,425
- − Repairs & maintenance
- −$2,434
- − Management
- −$2,434
- − HOA
- −$5,244
- − Depreciation
- −$8,291
- Taxable loss
- −$8,596
- Est. tax savings @ 24.0%
- +$2,063
- After-tax cash flow
- $-1,734/yr
For passive investors: Depreciation is non-cash, so a rental often shows a tax loss while cash-flowing — sheltering income. Rental losses are passive: they offset passive income freely, and up to $25,000/yr can offset ordinary (W-2) income if you actively participate and your MAGI is under $100k (phasing out to $0 by $150k); unused losses carry forward. On sale, claimed depreciation is recaptured at up to 25%, and gains may owe capital-gains tax (a 1031 exchange can defer both). Figures are a year-1 estimate at your 24.0% rate — not tax advice; consult a CPA.
Condition & rehab AI · 12 photos
This home is in good condition with modern amenities and a well-maintained exterior. It is ready for a new owner or tenant.
Value-add opportunities
- Resale Paint exterior walls — Fresh paint can enhance curb appeal and home value
- Rental Replace sliding glass doors — Modern sliding glass doors improve functionality and aesthetics
- Both Install smart home devices — Smart home devices can increase convenience and property value
Renovation cost estimate screening
Value-add ROI direction
- Resale Paint exterior walls — Fresh paint can enhance curb appeal and home value ↑
- Rental Replace sliding glass doors — Modern sliding glass doors improve functionality and aesthetics ↑
- Both Install smart home devices — Smart home devices can increase convenience and property value ↑
ⓘ Cost ranges are severity-bucket heuristics (US national rule-of-thumb). Get contractor quotes + a written scope before underwriting a rehab budget.
Schools (NCES district)
- District
- Marion
- NCES district ID
- 1201260
- Math proficiency
- 42% ▼ -7.00%
- Reading proficiency
- 43% ▼ -4.00%
- Median HH income
- $40,015
- Composite
- 35.61/100
- National rank
- #4890
- State rank
- #61 of 73 in FL
Livability — Ocala
- Score
- 69/100
- State rank
- #476
- US rank
- #8461
Category grades
Schools grade is shown separately in the Schools card above.
Census & demographics
- County
- Marion County · 315,796 people
- City population
- 263,375
- Metro
- Ocala, FL
- Population (ZIP)
- 22,807
- Household income
- $65,901
- Rent vs Own
- Severe rent burden
- 282.0
Population outlook (Marion County) Hauer SSP2
- Today (2025)
- 365,905 people
- By 2030
- 376,768 · +3.0%
- By 2040
- 396,555 · +8.4%
- By 2050
- 412,723 · +12.8%
- By 2075
- 446,090 · +21.9%
- By 2100
- 436,193 · +19.2%
Race, ethnicity, and origin ACS 2023
- Neighborhood character
- Majority White (63%)
- Race & ethnicity
- White 63% Hispanic / Latino 19% Black 14% Two or more races 12%
- Hispanic origin (detail)
- Mexican 6% Puerto Rican 9% Cuban 2%
- Common ancestry
- Lithuanian 2% Romanian 2% Slovak 2%
- Foreign-born
- 10% · Canada
- Languages at home
- 81% English-only · Spanish 16% Other Indo-European 1%
Political lean MEDSL · Marion
- 2024 margin
- Solid R (+31.6) · D 33.8% · R 65.5%
- 2008→2024 swing
- -20.0pp toward R · 2008: -11.6pp · 2024: -31.6pp
- All cycles
- 2024: R+31.6 2020: R+25.9 2016: R+26.2 2012: R+16.2 2008: R+11.6
Not yet ingested
- Civics
- —
Market trends
- HPI YoY
- ▼ -133.62%
- Current HPI
- 194.3857
- Rent YoY
- ▲ 11.12%
- Metro
- Ocala, FL
- State GDP YoY
- ▲ 3.28%
- F500 in state
- 36
Industry mix (Fortune 500 HQ in FL)
| Industry | F500 HQs | Revenue |
|---|---|---|
| Industrial Technology | 2 | $29B |
|
||
| Insurance | 2 | $17B |
|
||
| Retail | 1 | $60B |
|
||
| Technology Distribution | 1 | $58B |
|
||
| Homebuilding | 1 | $35B |
|
||
| Technology Manufacturing | 1 | $35B |
|
||
Price history
+6.3% since first listed18 events — show timeline
- 2026-04-10 Price Changed $285,000 Stellar MLS as Distributed by MLS Grid
- 2025-12-23 Listed $295,000 Stellar MLS as Distributed by MLS Grid
- 2025-08-14 Listing Removed — Stellar MLS as Distributed by MLS Grid
- 2025-02-14 Listed $290,000 Stellar MLS as Distributed by MLS Grid
- 2023-09-26 Sold (MLS) $267,990 Stellar MLS as Distributed by MLS Grid
- 2023-08-24 Pending — Stellar MLS as Distributed by MLS Grid
- 2023-08-24 Relisted — Stellar MLS as Distributed by MLS Grid
- 2023-08-24 Price Changed $267,990 Stellar MLS as Distributed by MLS Grid
- 2023-08-14 Pending — Stellar MLS as Distributed by MLS Grid
- 2023-08-08 Price Changed $269,990 Stellar MLS as Distributed by MLS Grid
- 2023-08-01 Price Changed $272,990 Stellar MLS as Distributed by MLS Grid
- 2023-07-18 Price Changed $274,990 Stellar MLS as Distributed by MLS Grid
- 2023-07-17 Price Changed $278,990 Stellar MLS as Distributed by MLS Grid
- 2023-07-10 Price Changed $277,990 Stellar MLS as Distributed by MLS Grid
- 2023-06-05 Price Changed $274,990 Stellar MLS as Distributed by MLS Grid
- 2023-05-08 Price Changed $272,990 Stellar MLS as Distributed by MLS Grid
- 2023-04-17 Price Changed $270,990 Stellar MLS as Distributed by MLS Grid
- 2023-03-27 Listed $267,990 Stellar MLS as Distributed by MLS Grid
Property tax history
+36.6%/yrLatest (2025): $3,230 · +8.3% YoY. Source: county tax records.
Cash-flow waterfall
monthlySold comps — $/sqft
last 12 mo · ≤1 miLoading sold comps…