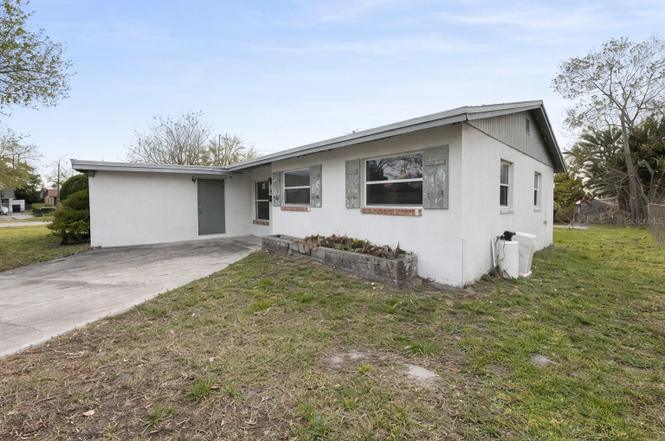
4226 Lake Richmond Dr · Orlando, FL
Flood risk 3/10 · Minor
- FEMA flood zone
- X (unshaded)
- Chance of flooding over 30 yrs
- 0.2%
- Est. flood insurance / yr
- $507 – $1,088
Fire risk 1/10 · Minimal
- Est. fire insurance / yr
- $947 – $1,759
Heat risk 9/10 · Severe
- Hot days now (above 108°F)
- 7 days/yr
- Hot days in 30 yrs
- 24 days/yr
Wind risk 9/10 · Severe
- Chance of severe wind over 30 yrs
- 99.0%
Air-quality risk 1/10 · Minimal
- Unhealthy air days now
- 0 days/yr
- Unhealthy air days in 30 yrs
- 0 days/yr
Risk factors via First Street. Map © Google.
Why this score? — see what drove the C+ grade
The composite is a weighted blend of 9 inputs, each scored 0–100. Each bar is that input's sub-score; the figure is the points it added to the 100-point composite (weight × sub-score).
- Cash flow +20.0/30.0
- ARV discount +15.0/15.0
- DSCR +6.3/10.0
- 1% rule +5.6/10.0
- Livability +4.3/5.0
- Schools +4.1/10.0
- Rent growth +2.5/5.0
- Condition / age +2.5/5.0
- Appreciation +0.0/10.0
$199,900
🖨 Deal sheet 📄 Offer letter ✓ Due diligence
Listing remarks
One or more photo(s) has been virtually staged. Don't miss this fixer-upper opportunity! This 4-bedroom, 2-bathroom corner lot home is located in the Richmond Estates neighborhood of Orlando. The open-concept design allows the dining room and living room to flow seamlessly into the family room — great for entertaining! The spacious primary bedroom features a large closet and a private full bath. The property includes a shed for extra storage and sits on a generously sized lot, offering plenty of outdoor space. This fixer-upper is being sold as-is and has incredible potential — whether you're looking to create your ideal home or want to add a rental property into your portfolio.
Key facts
- Open-concept design
- Large closet
- Extra storage
Tags
Property features AI
Finance
- Other: Property zoning: R-1; Property subtype: Single Family Residence; Homestead not indicated; Living area ~1361 square feet
- Financial info: No lease restrictions indicated
- HOA & community: No HOA/association indicated; Pets allowed
Exterior
- Parking: Carport (1 space)
- Utilities: Public water; Public sewer; Electricity available; Water service available
- Home design: Single-family residence; Residential property; One story; North-facing
- Construction: Block construction; Shingle roof; Slab foundation; Built on 0.21-acre lot
- Exterior features: Other exterior features; Asphalt road access
Interior
- Bedrooms: 4 bedrooms
- Flooring: Other flooring
- Bathrooms: 2 full bathrooms
- Heating & cooling: No heating specified; Central air conditioning
- Interior features: Other interior features; Florida room
- Laundry & utility: Laundry inside
Neighborhood map
What this means for you Summary
Snapshot
- This is a 4-bed/2.0-bath single-family listed at $200k.
Deal economics
- At list price, monthly cash flow is $246 ($3k/yr) — positive.
- The deal already cash-flows at list — no discount required.
- Meets the 1% rule at list price ($2k rent vs $200k).
- Recommended offer: $176k (12.0% below list) — sets the bar for market timing.
- Cap rate 7.8% vs local median 3.0% in Orlando — top-decile yield for the area; either an underpriced asset or a hidden risk that comps aren't pricing in. Stress-test before assuming the spread holds.
Location & tenants
- Location reads 86/100 on livability (#12 in FL, #360 nationally) — a professional / high-income tenant draw. Strengths: amenities A+, commute A+, housing A+.
- Orange (suburban): math 46% / reading 51% proficiency, ranked #43 of 73 in FL (top 59%) — families likely to look elsewhere, expect single-tenant / working-renter base with shorter leases.
- Zoned schools: Eccleston Elementary (math 22% / reading 28%, grade F, #2,030 of 2,144 statewide, top 95%, 357 students, 87% FRL); Oak Ridge High (math 17% / reading 27%, grade F, #544 of 667 statewide, top 82%, 2,477 students, 66% FRL) — zoned schools average 76% FRL vs 56% district-wide (20 pts higher); higher-poverty schools than district average — tighter screening recommended.
- Zoned-school proficiency averages 24% at this address vs 48% district-wide (-25 pts) — the specific schools serving this property underperform the Orange average; the district grade overstates school quality for this exact location.
- Market conditions: Rents flat; 238 active listings in the ZIP; 25 comparable units currently listed for rent nearby; rentals at typical pace (median 20d on market — plan ~3-4 weeks tenant-placement turnaround); 8,053 units permitted in Orange County in 2024 (3,133 in 5+ unit buildings).
- At $2,126/mo this rent would consume 47% of the median local household income ($54k/yr) (locally 2728% of renters already pay >50% of income on rent) — very limited rent-growth headroom before tenants either downsize or default.
Forward outlook
- Local home prices are declining (-3.0%/yr); year-one equity from $1k of loan paydown is wiped out by about $6k of value loss. Plan a longer hold.
- Orange County population projected at +52% by 2050 — long-run rental-demand tailwind backs the buy-and-hold thesis.
Negotiation context
- It's been on market 336 days — a 12% lower offer ($176k) is reasonable based on typical stale-listing flexibility.
- 6 sale attempts since 2y ago; this cycle's ask has dropped $50k (20%) from the opening price — seller is motivated, your offer sets the floor, not the list.
- Current owner paid $12k; list at $200k implies a 1512% gain — meaningful room to come down on a strong offer.
Risks & watch-outs
- Climate carrying-cost: severe wind risk, 99% chance of damaging wind over 30y; extreme-heat days projected 7→24/yr by 2055 (HVAC capex compounding) — expect insurance premiums to compound above CPI over the hold.
Questions for the listing agent
- It's been on market 336 days. Have you received any prior offers? Is the seller open to a 12% concession, seller financing, or rate buy-down credit?
- Built in 1969 — when were the roof, HVAC, electrical panel, plumbing, and water heater last replaced?
- Why hasn't it sold? Are there any deal-killer items the seller is aware of (foundation, flood, title, zoning, code violations)?
- Is there a deadline driving the sale (1031 exchange, divorce, estate, relocation)? That informs how much negotiation room exists.
- Schools are B-rated — typically a magnet for longer-tenancy family renters. What's the average tenant stay here, and is there a school-zone premium baked into asking?
- What's the average days-on-market for RENTAL listings here right now (not sales)? A rising rental-DOM trend means longer vacancies and softer asking-rent achievability than the comps imply.
- What's the recent tenant-quality profile in this submarket — average credit score on applications, eviction rate, late-payment / NSF rate, and stable-employment percentage? A property-management company in the area should have these aggregated.
- How much new for-sale + rental construction is in the pipeline within 1–3 miles? Heavy new supply typically softens prices + rents 12–24 months out; constrained supply supports both.
Investment metrics
- 1% rule
- 1.06% ✓
- Cap rate
- 7.77%
- Cash-on-cash
- 5.27%
- DSCR
- 1.23
- GRM
- 7.8
CMA / ARV
- ARV (on-the-fly)
- $292,615
- Comps found
- 6
Show comp detail 6 sales within ~0.75 mi
| Address | Dist | Beds/Ba | Sqft | Sold | Price | $/sf | Match |
|---|---|---|---|---|---|---|---|
| 4340 Kirkland Blvd | 0.37mi | 4/2.0 | 1,530 (+12%) | 5mo | $314,700 | $206 | 58 |
| 4749 Marbello Blvd | 0.66mi | 4/1.5 | 1,344 (-1%) | 12mo | $270,000 | $201 | 55 |
| 4401 Marshall St | 0.48mi | 4/2.0 | 1,489 (+9%) | 13mo | $330,000 | $222 | 51 |
| 2703 Messina Ave | 0.65mi | 4/2.0 | 1,400 (+3%) | 21mo | $299,000 | $214 | 47 |
| 4669 Vargas St | 0.63mi | 4/2.0 | 1,535 (+13%) | 6mo | $330,000 | $215 | 45 |
| 4568 Kirkland Blvd | 0.53mi | 4/1.5 | 1,230 (-10%) | 23mo | $275,000 | $224 | 38 |
Match score weights: distance 35% · size 25% · config 20% · recency 20%. Top-matched comps best support the ARV.
Projected returns pro-forma
-3.0% appreciation · 0.15% rent growth · sell at horizon
- IRR
- -11.5%
- Equity multiple
- 0.60×
- Total profit
- $-22,602
- Equity at exit
- $29,806
- IRR
- -7.2%
- Equity multiple
- 0.60×
- Total profit
- $-22,238
- Equity at exit
- $17,284
Cash invested: $55,972 (down + closing). Projections, not guarantees.
Landlord ↔ Tenant lean methodology
- Overall (STATE)
- 87 Strongly Landlord-Friendly
- State Florida
- 87 Strongly Landlord-Friendly · R+3
- County
- — inherits STATE
- City
- — inherits STATE
ZIP-level market 32811
- Home prices YoY
- -33.8%
- Rents YoY
- 0.1%
- Active inventory
- 238
- Price-to-rent
- 7.8×
Monthly cashflow live
- Estimated rent
- $2,126 high interval (Pro) →
- Mortgage (P&I)
- −$1,048
- Tax from tax record
- −$302 /mo · $3,624/yr
- Insurance
- −$83
- HOA
- −$0
- Vacancy / Maint / Mgmt
- −$446
- Net cashflow
- $246
Break-even live
UW: 25.0% down · 7.5% · 30yr · 1.5% tax · 5.0% vac · 8.0% maint · 8.0% mgmt
Financing live
Cash to close
- Down payment
- $49,975
- Closing costs
- $5,997
- Reserves months
- —
- Total cash needed
- —
Loan-product check · same deal, 3 products live
Conventional
25% down · 7.5% · 30yr
- Down + closing
- —
- Monthly P&I
- —
- Monthly cashflow
- —
- DSCR
- —
- Eligible?
- —
Personal DTI + credit; lowest rate.
DSCR
20% down · 8.5% · 30yr
- Down + closing
- —
- Monthly P&I
- —
- Monthly cashflow
- —
- DSCR
- —
- Eligible?
- —
No personal income docs; deal must DSCR.
Hard money
10% down · 12.0% · 12mo
- Down + closing
- —
- Monthly P&I
- —
- Monthly cashflow
- —
- DSCR
- —
- Eligible?
- —
Short-term bridge; refi at stabilization.
Rent comps 25 comps
| Address | Beds | Baths | Sqft | Rent | $/sqft | DOM | Units | Dist |
|---|---|---|---|---|---|---|---|---|
| 4226 Kelly Miller Ct Orlando, FL | 3.0 | 1.0 | 1126 | $1,950 | $1.73 | 24d | 1 | 0.11mi |
| 2151 S Ivey Ln Orlando, FL | 3.0 | 1.5 | 1080 | $1,993 | $1.85 | 4d | 1 | 0.48mi |
| 1822 Horne Ave Orlando, FL | 3.0 | 1.0 | 1249 | $1,600 | $1.28 | 24d | 1 | 0.68mi |
| 1920 Willie Mays Pkwy Orlando, FL | 4.0 | 2.0 | 1446 | $2,070 | $1.43 | 20d | 1 | 0.73mi |
| 1661 Gammon Ln Unit 1 Orlando, FL | 4.0 | 3.0 | 1511 | $2,500 | $1.65 | 24d | 1 | 0.76mi |
| 4487 Wheatley St Orlando, FL | 4.0 | 2.0 | 1249 | $1,950 | $1.56 | 20d | 1 | 0.80mi |
| 4201 Cepeda St Orlando, FL | 4.0 | 2.0 | 1500 | $1,800 | $1.20 | 24d | 1 | 0.86mi |
| 4655 Cepeda St Orlando, FL | 3.0 | 1.5 | 1266 | $1,695 | $1.34 | 24d | 1 | 0.99mi |
| 4118 Minoso St Orlando, FL | 3.0 | 1.0 | 1213 | $1,860 | $1.53 | 24d | 1 | 1.03mi |
| 4700 Cason Cove Dr Orlando, FL | 1.0–4.0 | 1.0–2.0 | 1002 | $2,499 | $2.49 | 3d | 12 | 1.07mi |
| 4673 Gardens Park Blvd Orlando, FL | 1.0–3.0 | 1.0–2.0 | 1109 | $3,200 | $2.89 | 2d | 16 | 1.07mi |
| 4822 Cason Cove Dr Orlando, FL | 1.0–3.0 | 1.0–2.0 | 884 | $2,199 | $2.49 | 2d | 9 | 1.16mi |
| 2751 L B McLeod Rd Unit 2751-A Orlando, FL | 3.0 | 2.0 | 1338 | $1,600 | $1.20 | 18d | 1 | 1.17mi |
| 2805 Gulfstream Ct Orlando, FL | 3.0 | 2.0 | 1574 | $2,375 | $1.51 | 15d | 1 | 1.22mi |
| 4803 Normandy Pl Orlando, FL | 3.0 | 2.0 | 1262 | $1,800 | $1.43 | 3d | 1 | 1.25mi |
| 1343 Croyle Dr Orlando, FL | 4.0 | 2.0 | 1273 | $1,900 | $1.49 | 24d | 1 | 1.31mi |
| 4881 Matteo Trl Orlando, FL | 3.0 | 2.5 | 1534 | $2,200 | $1.43 | 22d | 1 | 1.35mi |
| 3757 Millenia Blvd Orlando, FL | 1.0–3.0 | 1.0–2.0 | 1130 | $2,475 | $2.19 | 2d | 17 | 1.37mi |
| 4910 Fiorazante Ave Orlando, FL | 3.0 | 2.5 | 1671 | $2,300 | $1.38 | 24d | 1 | 1.40mi |
| 4956 Matteo Trl Orlando, FL | 3.0 | 2.5 | 1735 | $2,499 | $1.44 | 18d | 1 | 1.42mi |
| 4529 W Gore Ave Orlando, FL | 3.0 | 2.0 | 1439 | $2,549 | $1.77 | 20d | 1 | 1.42mi |
| 4000 Middlebrook Rd Orlando, FL | 1.0–3.0 | 1.0–2.0 | 979 | $2,449 | $2.50 | 8d | 27 | 1.43mi |
| 701 S Ivey Ln Orlando, FL | 2.0–3.0 | 1.0 | 871 | $1,329 | $1.53 | 24d | 1 | 1.45mi |
| 5132 Elese St Orlando, FL | 3.0 | 2.0 | 960 | $1,800 | $1.88 | 16d | 1 | 1.46mi |
| 5300 Lescot Ln Orlando, FL | 3.0 | 2.0 | 1143 | $1,900 | $1.66 | 24d | 1 | 1.47mi |
Listing history 17 events
-
2026-05-20status Pending
-
2026-04-06price $199,900
-
2026-02-04status Active
-
2025-12-23status Pending
-
2025-12-17status Active
-
2025-11-01status Pending
-
2025-10-09price $214,900
-
2025-08-11price $229,900
-
2025-08-01status Active
-
2025-07-31historical
-
2025-06-20status Active
-
2025-06-18historical
-
2025-05-08price $239,900
-
2025-03-18$249,900 Active
-
2024-09-30status Pending
-
2024-09-15$250,000 Active
-
1969-06-01soldstatus $12,400
ⓘ Source: listings_history table (triggers on properties + properties_extension) + one-shot
backfill from property_details.listing_events for pre-trigger history.
Tax reassessment forecast FL · Resets to sale price
- Current annual tax
- $3,624 · $302/mo
- Projected year-2 tax
- $3,624 · $302/mo
- Expected delta
- $0/yr ($0/mo · 0.0%)
ⓘ Screening estimate from a state-policy table — verify with the county assessor before closing.
Climate risk First Street
- Flood 3/10 Moderate FEMA zone X (unshaded) · 20% chance over 30 yrs
- Wildfire 1/10 Low
- Heat 9/10 Extreme 7 d/yr ≥108°F today · 24 d/yr by 30 yrs out
- Wind 9/10 Extreme 99% chance of damaging wind over 30 yrs
- Air quality 1/10 Low 0 unhealthy d/yr today · 0 by 30 yrs out
Nearby sold comps map
Loading sold comps map…
Walkable amenities ~0.75 mi
Loading nearby amenities…
Taxation est. · year 1
- Rental income
- $25,509
- − Mortgage interest
- −$11,198
- − Property taxes
- −$3,624
- − Insurance
- −$1,000
- − Repairs & maintenance
- −$2,041
- − Management
- −$2,041
- − Depreciation
- −$5,815
- Taxable loss
- −$208
- Est. tax savings @ 24.0%
- +$50
- After-tax cash flow
- $2,999/yr
For passive investors: Depreciation is non-cash, so a rental often shows a tax loss while cash-flowing — sheltering income. Rental losses are passive: they offset passive income freely, and up to $25,000/yr can offset ordinary (W-2) income if you actively participate and your MAGI is under $100k (phasing out to $0 by $150k); unused losses carry forward. On sale, claimed depreciation is recaptured at up to 25%, and gains may owe capital-gains tax (a 1031 exchange can defer both). Figures are a year-1 estimate at your 24.0% rate — not tax advice; consult a CPA.
Schools (NCES district)
- District
- Orange
- NCES district ID
- 1201440
- Math proficiency
- 46% ▼ -9.00%
- Reading proficiency
- 51% ▼ -2.00%
- Median HH income
- $49,350
- Composite
- 41.47/100
- National rank
- #3461
- State rank
- #43 of 73 in FL
Livability — Orlando
- Score
- 86/100
- State rank
- #12
- US rank
- #360
Category grades
Schools grade is shown separately in the Schools card above.
Census & demographics
- Census place
- Orlando, FL
- County
- Orange County · 1,471,359 people
- City population
- 964,969
- Metro
- Orlando-Kissimmee-Sanford, FL
- Population (ZIP)
- 41,475
- Household income
- $54,082
- Rent vs Own
- Severe rent burden
- 2728.0
Population outlook (Orange County) Hauer SSP2
- Today (2025)
- 1,618,226 people
- By 2030
- 1,787,404 · +10.5%
- By 2040
- 2,125,621 · +31.4%
- By 2050
- 2,454,016 · +51.6%
- By 2075
- 3,173,711 · +96.1%
- By 2100
- 3,607,781 · +122.9%
Race, ethnicity, and origin ACS 2023
- Neighborhood character
- Diverse neighborhood (Simpson 0.66)
- Race & ethnicity
- Black 50% Hispanic / Latino 27% Two or more races 17% White 12% Asian 2%
- Hispanic origin (detail)
- Mexican 2% Puerto Rican 8% Dominican 2%
- Common ancestry
- Hispanic 7% Estonian 4% Russian 1%
- Foreign-born
- 31% · Canada, Jamaica, China
- Languages at home
- 62% English-only · Spanish 21% French/Haitian/Cajun 8% Other Indo-European 6%
Political lean MEDSL · Orange
- 2024 margin
- D (+13.6) · D 56.1% · R 42.5% · Other 1.3%
- 2008→2024 swing
- -5.0pp toward R · 2008: 18.6pp · 2024: 13.6pp
- All cycles
- 2024: D+13.6 2020: D+23.1 2016: D+24.6 2012: D+18.2 2008: D+18.6
Not yet ingested
- Civics
- —
Market trends
- HPI YoY
- ▼ -145.37%
- Current HPI
- 284.9191
- Rent YoY
- ▲ 0.15%
- Metro
- Orlando-Kissimmee-Sanford, FL
- State GDP YoY
- ▲ 3.28%
- F500 in state
- 36
Industry mix (Fortune 500 HQ in FL)
| Industry | F500 HQs | Revenue |
|---|---|---|
| Industrial Technology | 2 | $29B |
|
||
| Insurance | 2 | $17B |
|
||
| Retail | 1 | $60B |
|
||
| Technology Distribution | 1 | $58B |
|
||
| Homebuilding | 1 | $35B |
|
||
| Technology Manufacturing | 1 | $35B |
|
||
Price history
+1512.1% since first listed17 events — show timeline
- 2026-05-20 Pending — Stellar MLS as Distributed by MLS Grid
- 2026-04-06 Price Changed $199,900 Stellar MLS as Distributed by MLS Grid
- 2026-02-04 Relisted — Stellar MLS as Distributed by MLS Grid
- 2025-12-23 Pending — Stellar MLS as Distributed by MLS Grid
- 2025-12-17 Relisted — Stellar MLS as Distributed by MLS Grid
- 2025-11-01 Pending — Stellar MLS as Distributed by MLS Grid
- 2025-10-09 Price Changed $214,900 Stellar MLS as Distributed by MLS Grid
- 2025-08-11 Price Changed $229,900 Stellar MLS as Distributed by MLS Grid
- 2025-08-01 Relisted — Stellar MLS as Distributed by MLS Grid
- 2025-07-31 Listing Removed — Stellar MLS as Distributed by MLS Grid
- 2025-06-20 Relisted — Stellar MLS as Distributed by MLS Grid
- 2025-06-18 Listing Removed — Stellar MLS as Distributed by MLS Grid
- 2025-05-08 Price Changed $239,900 Stellar MLS as Distributed by MLS Grid
- 2025-03-18 Listed $249,900 Stellar MLS as Distributed by MLS Grid
- 2024-09-30 Pending — Stellar MLS as Distributed by MLS Grid
- 2024-09-15 Listed $250,000 Stellar MLS as Distributed by MLS Grid
- 1969-06-01 Sold (Public Records) $12,400 Public Records
Property tax history
+23.0%/yrLatest (2025): $3,624 · +3.1% YoY. Source: county tax records.
Cash-flow waterfall
monthlySold comps — $/sqft
last 12 mo · ≤1 miLoading sold comps…