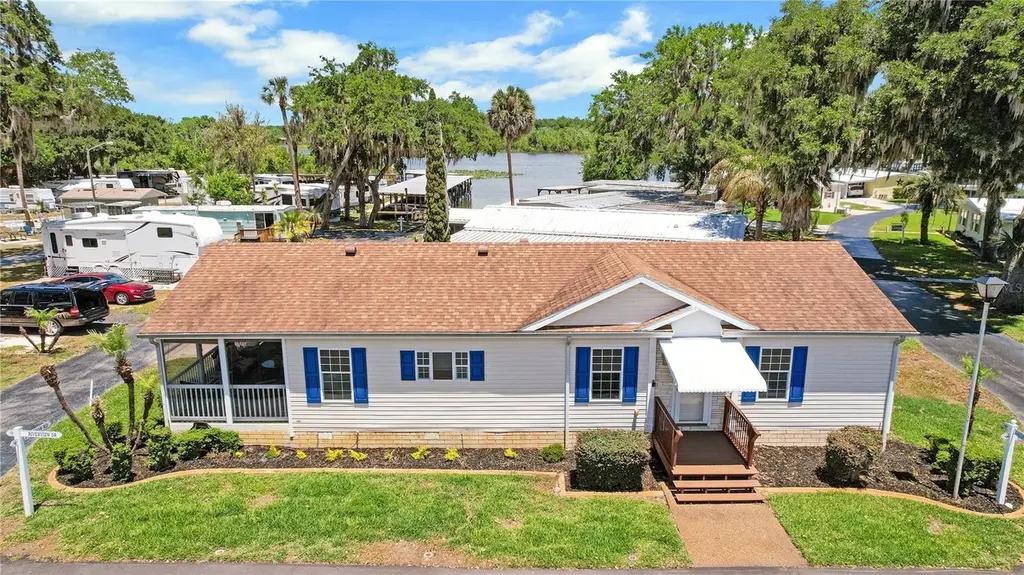
15 Riverview Dr · Fruitland Park, FL
Flood risk 1/10 · Minimal
- FEMA flood zone
- X (unshaded)
- Chance of flooding over 30 yrs
- 0.0%
- Est. flood insurance / yr
- $507 – $1,088
Fire risk 4/10 · Minor
- Est. fire insurance / yr
- $947 – $1,759
Heat risk 8/10 · Major
- Hot days now (above 107°F)
- 7 days/yr
- Hot days in 30 yrs
- 22 days/yr
Wind risk 9/10 · Severe
- Chance of severe wind over 30 yrs
- 99.0%
Air-quality risk 3/10 · Minor
- Unhealthy air days now
- 2 days/yr
- Unhealthy air days in 30 yrs
- 4 days/yr
Risk factors via First Street. Map © Google.
Why this score? — see what drove the D grade
The composite is a weighted blend of 9 inputs, each scored 0–100. Each bar is that input's sub-score; the figure is the points it added to the 100-point composite (weight × sub-score).
- Cash flow +13.7/30.0
- ARV discount +7.5/15.0
- Schools +4.2/10.0
- DSCR +4.1/10.0
- 1% rule +3.9/10.0
- Livability +3.5/5.0
- Rent growth +2.5/5.0
- Condition / age +2.5/5.0
- Appreciation +0.0/10.0
$177,500
🖨 Deal sheet (PDF) 📄 Offer letter ✓ Due diligence
Listing remarks
WHAT IF I TOLD YOU: $125 a month HOA fee included your WATER, SEWER, TRASH AND MOWING YOUR YARD!!! And yes there's more!! CHAIN OF LAKE ACCESS on Lake Griffin!! This community offers a marina and boat slips upon availability for a minimal fee. It has a community fishing dock, pool, community building and so much more! This home is A RARE FIND 3 bedrooms, 2 bath beautiful home with split bedroom plan, open concept with an AMAZING KITCHEN! Ample cabinetry with closet pantry featuring pull outs, Counter space that goes on and on!! Inside laundry! And the most GORGEOUS SCREENED/COVERED LANAI! Spend your outdoor time overlooking a view of the water at the community boat ramp. Situated on a corne
Key facts
- Chain of lake access
- Corner lot
- 4,980 sq ft lot
Tags
Property features AI
Finance
- Other: Water views of a marina and lake access (Lake Griffin, Chain of Lakes) with a fishing pier; Lot size about 0.11 acre (private maintained paved road); Living area reported (~1,222 sq ft)
- Financial info: Lease restrictions apply
- HOA & community: Has HOA (monthly fee $125) with required association approval; Association amenities include clubhouse, pool, shuffleboard court; Association fee covers pool, grounds maintenance, management, recreational facilities, sewer, trash and water; Community features: clubhouse, deed restrictions, pool; Senior community; Pets allowed (size and number limits)
Exterior
- Parking: Carport with 1 space
- Utilities: Private well water; Private sewer; Cable available; Broadband/high-speed internet available; Electricity connected; Water connected; Irrigation equipment
- Home design: Single family residence; One story; South-facing
- Construction: Vinyl siding and frame construction; Shingle roof; Crawlspace foundation; Built area noted (building area total)
- Exterior features: Covered, screened side porch; Paved lot
Interior
- Kitchen: Dishwasher; Range; Microwave; Refrigerator
- Bedrooms: 3 bedrooms
- Flooring: Carpet; Ceramic tile; Vinyl
- Bathrooms: 2 full bathrooms
- Heating & cooling: Central heating; Central air conditioning
- Interior features: Ceiling fans; Living room/dining room combo; Split bedroom floor plan; Walk-in closets
- Laundry & utility: Washer and dryer included; Laundry area inside and in kitchen
Neighborhood map
What this means for you Summary
Snapshot
- This is a 2-bed/2.0-bath condo listed at $178k.
Deal economics
- At list price, monthly cash flow is $12 ($144/yr) — positive.
- The deal already cash-flows at list — no discount required.
- To meet the 1% rule (rent ≥ 1% of price), the offer needs to be $157k (11.4% below list).
- Recommended offer: $157k (11.4% below list) — sets the bar for 1% rule.
- Cap rate 6.4% vs local median 4.0% in Fruitland Park — top-decile yield for the area; either an underpriced asset or a hidden risk that comps aren't pricing in. Stress-test before assuming the spread holds.
Location & tenants
- Location reads 70/100 on livability (#447 in FL) — a middle-class / working-renter tenant base. Strengths: housing A+, crime A, health & safety A-; Watch: amenities F, commute F.
- Lake (suburban): math 49% / reading 50% proficiency, ranked #37 of 73 in FL (top 51%) — families likely to look elsewhere, expect single-tenant / working-renter base with shorter leases.
- Zoned schools: Beverly Shores Elementary School (math 38% / reading 31%, grade F, #1,709 of 2,144 statewide, top 81%, 626 students, 73% FRL); Carver Middle School (math 41% / reading 41%, grade F, #353 of 571 statewide, top 63%, 837 students, 65% FRL); Leesburg High School (math 24% / reading 32%, grade F, #464 of 667 statewide, top 70%, 1,641 students, 58% FRL) — zoned schools average 65% FRL vs 49% district-wide (16 pts higher); higher-poverty schools than district average — tighter screening recommended.
- Zoned-school proficiency averages 34% at this address vs 50% district-wide (-15 pts) — the specific schools serving this property underperform the Lake average; the district grade overstates school quality for this exact location.
- Market conditions: 168 active listings in the ZIP; 7 comparable units currently listed for rent nearby; rentals at typical pace (median 26d on market — plan ~3-4 weeks tenant-placement turnaround); 4,799 units permitted in Lake County in 2024 (814 in 5+ unit buildings).
Forward outlook
- Local home prices are declining (-3.0%/yr); year-one equity from $1k of loan paydown is wiped out by about $5k of value loss. Plan a longer hold.
- Lake County population projected at +37% by 2050 — long-run rental-demand tailwind backs the buy-and-hold thesis.
Negotiation context
- It's been on market 45 days — a 3% lower offer ($172k) is reasonable based on typical stale-listing flexibility.
Risks & watch-outs
- Climate carrying-cost: severe wind risk, 99% chance of damaging wind over 30y; extreme-heat days projected 7→22/yr by 2055 (HVAC capex compounding) — expect insurance premiums to compound above CPI over the hold.
Questions for the listing agent
- It's been on market 45 days. Have you received any prior offers? Is the seller open to a 11% concession, seller financing, or rate buy-down credit?
- What does the HOA fee cover, when was the last increase, and are there any pending special assessments or reserve-fund shortfalls?
- Any open or pending special assessments — roof, HVAC, plumbing, elevator, façade? What's the per-unit balance and payoff schedule, and is the seller paying it off at close or rolling it to the buyer?
- Is there a deadline driving the sale (1031 exchange, divorce, estate, relocation)? That informs how much negotiation room exists.
- Schools are D-rated, which usually means shorter tenancies and higher turnover. Who's the typical renter profile here, and what's been the actual vacancy rate?
- The area grade is low — what's the realistic commute time and amenity access for the typical tenant pool here? Any planned neighborhood developments (good or bad) we should know about?
- What's the average days-on-market for RENTAL listings here right now (not sales)? A rising rental-DOM trend means longer vacancies and softer asking-rent achievability than the comps imply.
- What's the recent tenant-quality profile in this submarket — average credit score on applications, eviction rate, late-payment / NSF rate, and stable-employment percentage? A property-management company in the area should have these aggregated.
- How much new apartment / multifamily construction is in the pipeline within 1–3 miles? Heavy new supply (>2% of stock underway) typically softens rents 12–24 months out; light construction supports rent growth.
Investment metrics
- 1% rule
- 0.89% ✗
- Cap rate
- 6.37%
- Cash-on-cash
- 0.29%
- DSCR
- 1.01
- GRM
- 9.4
CMA / ARV
No comps found within radius.
Projected returns pro-forma
-3.0% appreciation · 3.0% rent growth · sell at horizon
- IRR
- -15.8%
- Equity multiple
- 0.44×
- Total profit
- $-27,974
- Equity at exit
- $26,466
- IRR
- -7.4%
- Equity multiple
- 0.53×
- Total profit
- $-23,271
- Equity at exit
- $15,347
Cash invested: $49,700 (down + closing). Projections, not guarantees.
Landlord ↔ Tenant lean methodology
- Overall (STATE)
- 87 Strongly Landlord-Friendly
- State Florida
- 87 Strongly Landlord-Friendly · R+3
- County
- — inherits STATE
- City
- — inherits STATE
ZIP-level market 34731
- Home prices YoY
- -10.1%
- Active inventory
- 168
- Price-to-rent
- 9.4×
Monthly cashflow live
- Estimated rent
- $1,573 high interval (Pro) →
- Mortgage (P&I)
- −$931
- Tax from tax record
- −$101 /mo · $1,212/yr
- Insurance
- −$74
- HOA
- −$125
- Vacancy / Maint / Mgmt
- −$330
- Net cashflow
- $12
Break-even live
Sensitivity live
| Price | -10% $112 | -5% $62 | +0% $12 | +5% $-38 | +10% $-89 |
|---|---|---|---|---|---|
| Rent | -10% $-112 | -5% $-50 | +0% $12 | +5% $74 | +10% $136 |
| Rate | -1.0pp $101 | -0.5pp $57 | base $12 | +0.5pp $-34 | +1.0pp $-81 |
UW: 25.0% down · 7.5% · 30yr · 1.5% tax · 5.0% vac · 8.0% maint · 8.0% mgmt
Financing live
Cash to close
- Down payment
- $44,375
- Closing costs
- $5,325
- Reserves months
- —
- Total cash needed
- —
Loan-product check · same deal, 3 products live
Conventional
25% down · 7.5% · 30yr
- Down + closing
- —
- Monthly P&I
- —
- Monthly cashflow
- —
- DSCR
- —
- Eligible?
- —
Personal DTI + credit; lowest rate.
DSCR
20% down · 8.5% · 30yr
- Down + closing
- —
- Monthly P&I
- —
- Monthly cashflow
- —
- DSCR
- —
- Eligible?
- —
No personal income docs; deal must DSCR.
Hard money
10% down · 12.0% · 12mo
- Down + closing
- —
- Monthly P&I
- —
- Monthly cashflow
- —
- DSCR
- —
- Eligible?
- —
Short-term bridge; refi at stabilization.
Rent comps 7 comps
| Address | Beds | Baths | Sqft | Rent | $/sqft | DOM | Units | Dist |
|---|---|---|---|---|---|---|---|---|
| 1204 Wood Duck Ln Fruitland Park, FL | 2.0 | 2.0 | 1235 | $1,475 | $1.19 | 19d | 1 | 0.39mi |
| 1414 N Lake View Ave Leesburg, FL | 4.0 | 1.0–3.0 | 1700 | $1,440 | $0.85 | 4d | 3 | 0.61mi |
| 2117 Citrus Blvd Unit 6 Leesburg, FL | 2.0 | 1.0 | 800 | $1,000 | $1.25 | 3d | 1 | 1.15mi |
| 2511 Sennett Dr Leesburg, FL | 2.0–4.0 | 2.0 | 1215 | $1,508 | $1.24 | 25d | 1 | 1.27mi |
| 2400 Silver Pointe Cir Leesburg, FL | 1.0–2.0 | 1.0 | 837 | $1,050 | $1.25 | 25d | 1 | 1.36mi |
| 306 N Iona Ave Fruitland Park, FL | 1.0 | 1.0 | 1400 | $1,500 | $1.07 | 25d | 1 | 1.37mi |
| 1241 Atlantic Ave Fruitland Park, FL | 3.0 | 2.0 | 1344 | $2,100 | $1.56 | 25d | 1 | 1.41mi |
HOA detail condo
- Monthly dues
- $125 · $1,500/yr
- Likely covers
- watersewertrashpool
- Assessments
- None detected in remarks — confirm with the listing agent.
Listing history 15 events
-
2026-06-21days on market $177,500 Active 45 DOM
-
2026-06-18days on market $177,500 Active 42 DOM
-
2026-06-17days on market $177,500 Active 41 DOM
-
2026-06-16days on market $177,500 Active 40 DOM
-
2026-06-15days on market $177,500 Active 39 DOM
-
2026-06-13days on market $177,500 Active 37 DOM
-
2026-06-09days on market $177,500 Active 33 DOM
-
2026-06-08days on market $177,500 Active 32 DOM
-
2026-06-07days on market $177,500 Active 31 DOM
-
2026-06-04days on market $177,500 Active 28 DOM
-
2026-06-03days on market $177,500 Active 27 DOM
-
2026-06-02days on market $177,500 Active 26 DOM
-
2026-06-01days on market $177,500 Active 25 DOM
-
2026-05-31days on market $177,500 Active 24 DOM
-
2026-05-07$177,500 Active
ⓘ Source: listings_history table (triggers on properties + properties_extension) + one-shot
backfill from property_details.listing_events for pre-trigger history.
Tax reassessment forecast FL · Resets to sale price
- Current annual tax
- $1,212 · $101/mo
- Projected year-2 tax
- $1,473 · $123/mo
- Expected delta
- +$262/yr (+$22/mo · 21.6%)
ⓘ Screening estimate from a state-policy table — verify with the county assessor before closing.
Climate risk First Street
- Flood 1/10 Low FEMA zone X (unshaded) · 0% chance over 30 yrs
- Wildfire 4/10 Moderate
- Heat 8/10 Severe 7 d/yr ≥107°F today · 22 d/yr by 30 yrs out
- Wind 9/10 Extreme 99% chance of damaging wind over 30 yrs
- Air quality 3/10 Moderate 2 unhealthy d/yr today · 4 by 30 yrs out
Nearby sold comps map
Loading sold comps map…
Walkable amenities ~0.75 mi
Loading nearby amenities…
Taxation est. · year 1
- Rental income
- $18,877
- − Mortgage interest
- −$9,943
- − Property taxes
- −$1,212
- − Insurance
- −$888
- − Repairs & maintenance
- −$1,510
- − Management
- −$1,510
- − HOA
- −$1,500
- − Depreciation
- −$5,164
- Taxable loss
- −$2,849
- Est. tax savings @ 24.0%
- +$684
- After-tax cash flow
- $827/yr
For passive investors: Depreciation is non-cash, so a rental often shows a tax loss while cash-flowing — sheltering income. Rental losses are passive: they offset passive income freely, and up to $25,000/yr can offset ordinary (W-2) income if you actively participate and your MAGI is under $100k (phasing out to $0 by $150k); unused losses carry forward. On sale, claimed depreciation is recaptured at up to 25%, and gains may owe capital-gains tax (a 1031 exchange can defer both). Figures are a year-1 estimate at your 24.0% rate — not tax advice; consult a CPA.
Schools (NCES district)
- District
- Lake
- NCES district ID
- 1201050
- Math proficiency
- 49% ▼ -7.00%
- Reading proficiency
- 50% ▼ -4.00%
- Median HH income
- $46,632
- Composite
- 42.05/100
- National rank
- #3327
- State rank
- #37 of 73 in FL
Livability — Fruitland Park
- Score
- 70/100
- State rank
- #447
- US rank
- #8098
Category grades
Schools grade is shown separately in the Schools card above.
Census & demographics
- County
- Lake County · 364,602 people
- City population
- 12,196
- Metro
- Orlando-Kissimmee-Sanford, FL
- Population (ZIP)
- 12,196
- Household income
- $66,300
- Rent vs Own
- Severe rent burden
- 269.0
Population outlook (Lake County) Hauer SSP2
- Today (2025)
- 386,640 people
- By 2030
- 417,107 · +7.9%
- By 2040
- 476,676 · +23.3%
- By 2050
- 531,296 · +37.4%
- By 2075
- 648,303 · +67.7%
- By 2100
- 698,530 · +80.7%
Race, ethnicity, and origin ACS 2023
- Neighborhood character
- Predominantly White (76%)
- Race & ethnicity
- White 76% Black 11% Two or more races 11% Hispanic / Latino 3%
- Common ancestry
- Romanian 3% Serbian 2% Iranian 2%
- Foreign-born
- 5% · Canada
- Languages at home
- 98% English-only · Spanish 1% German/W. Germanic 1%
Political lean MEDSL · Lake
- 2024 margin
- Strong R (+24.7) · D 37.3% · R 62.0%
- 2008→2024 swing
- -11.2pp toward R · 2008: -13.5pp · 2024: -24.7pp
- All cycles
- 2024: R+24.7 2020: R+20.0 2016: R+23.1 2012: R+17.1 2008: R+13.5
Not yet ingested
- Civics
- —
Market trends
- HPI YoY
- ▼ -35.91%
- Current HPI
- 318.8206
- Rent YoY
- —
- Metro
- Orlando-Kissimmee-Sanford, FL
- State GDP YoY
- ▲ 3.28%
- F500 in state
- 36
Industry mix (Fortune 500 HQ in FL)
| Industry | F500 HQs | Revenue |
|---|---|---|
| Industrial Technology | 2 | $29B |
|
||
| Insurance | 2 | $17B |
|
||
| Retail | 1 | $60B |
|
||
| Technology Distribution | 1 | $58B |
|
||
| Homebuilding | 1 | $35B |
|
||
| Technology Manufacturing | 1 | $35B |
|
||
Price history
1 event — show timeline
- 2026-05-07 Listed $177,500 Stellar MLS as Distributed by MLS Grid
Property tax history
+7.4%/yrLatest (2025): $1,212 · +2.6% YoY. Source: county tax records.
Cash-flow waterfall
monthlySold comps — $/sqft
last 12 mo · ≤1 miLoading sold comps…