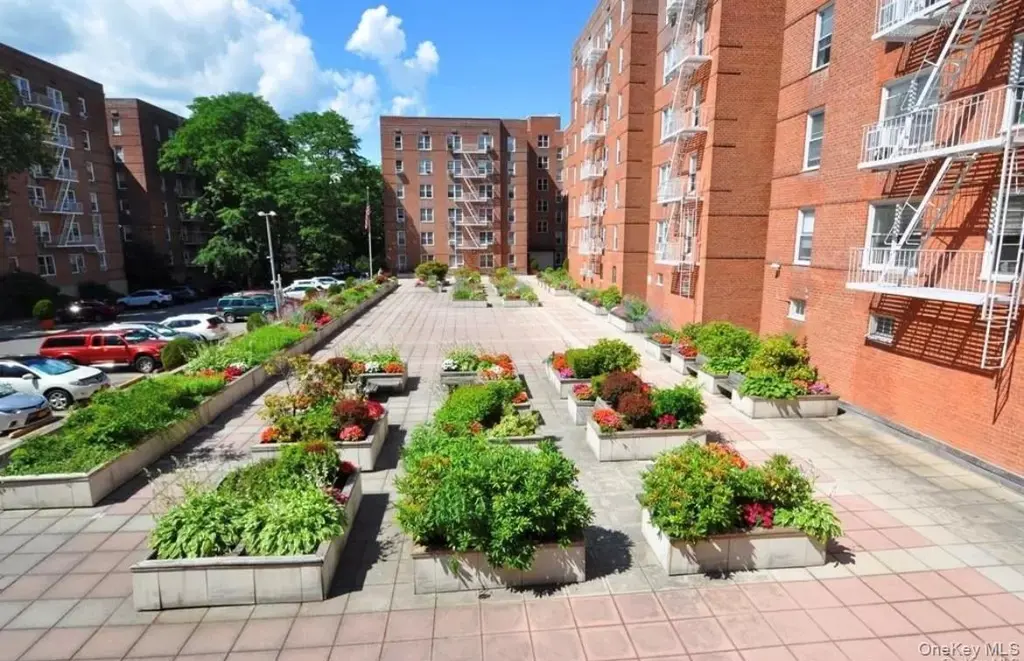
29 Abeel St Unit 6g · Yonkers, NY
Flood risk 4/10 · Minor
- FEMA flood zone
- X (unshaded)
- Chance of flooding over 30 yrs
- 0.22%
- Est. flood insurance / yr
- $473 – $860
Fire risk 1/10 · Minimal
- Est. fire insurance / yr
- $691 – $1,283
Heat risk 6/10 · Moderate
- Hot days now (above 99°F)
- 7 days/yr
- Hot days in 30 yrs
- 15 days/yr
Wind risk 6/10 · Moderate
- Chance of severe wind over 30 yrs
- 27.0%
Air-quality risk 3/10 · Minor
- Unhealthy air days now
- 3 days/yr
- Unhealthy air days in 30 yrs
- 4 days/yr
Risk factors via First Street. Map © Google.
Why this score? — see what drove the D+ grade
The composite is a weighted blend of 9 inputs, each scored 0–100. Each bar is that input's sub-score; the figure is the points it added to the 100-point composite (weight × sub-score).
- ARV discount +15.0/15.0
- 1% rule +10.0/10.0
- Cash flow +7.5/30.0
- Rent growth +4.8/5.0
- Schools +4.1/10.0
- Livability +3.4/5.0
- DSCR +1.7/10.0
- Condition / age +1.0/5.0
- Appreciation +0.0/10.0
$110,000
🖨 Deal sheet 📄 Offer letter ✓ Due diligence
Listing remarks MLS
Spacious one bedroom coop located in downtown Yonkers. Bring your vision
Key facts
- Garage
- Built 1956
- Listed 59 days
Neighborhood map
What this means for you Summary
Snapshot
- This is a 1-bed/1.0-bath condo listed at $110k. Condition is rated poor.
Deal economics
- At list price, monthly cash flow is $-134 ($-2k/yr) — negative.
- The deal already cash-flows at list — no discount required.
- Meets the 1% rule at list price ($2k rent vs $110k).
- Recommended offer: $107k (3.0% below list) — sets the bar for market timing.
Location & tenants
- Location reads 68/100 on livability (#528 in NY) — a middle-class / working-renter tenant base. Strengths: employment A, commute B; Watch: amenities F, cost of living F.
- Yonkers City School District (suburban): math 41% / reading 54% proficiency, ranked #413 of 590 in NY (top 70%) — families likely to look elsewhere, expect single-tenant / working-renter base with shorter leases; 64% free/reduced lunch — lower-income household profile, screen leases tightly.
- Market conditions: Rents rising fast (+9.0%/yr); 86 active listings in the ZIP; 27 comparable units currently listed for rent nearby; rentals at typical pace (median 15d on market — plan ~3-4 weeks tenant-placement turnaround); 954 units permitted in Westchester County in 2024 (649 in 5+ unit buildings).
- This rent runs 40% of the median local income ($68k/yr) — at the standard rent-burdened threshold; future hikes will face affordability resistance.
Forward outlook
- Local home prices are declining (-3.0%/yr); year-one equity from $761 of loan paydown is wiped out by about $3k of value loss. Plan a longer hold.
- Westchester County population projected at +10% by 2050 — modest demand growth; plan on rents tracking national, not racing it.
Negotiation context
- It's been on market 59 days — a 3% lower offer ($107k) is reasonable based on typical stale-listing flexibility.
- 3 sale attempts since 3y ago with the ask held roughly flat each time — persistent listings suggest the price (not the market) is what's stuck; bring a comps-based counter.
Risks & watch-outs
- Watch-outs: HOA is 51% of rent; built in 1956 — expect roof / HVAC / electrical / plumbing capex.
- Climate carrying-cost: major wind risk, 27% chance of damaging wind over 30y; extreme-heat days projected 7→15/yr by 2055 (HVAC capex compounding) — expect insurance premiums to compound above CPI over the hold.
Questions for the listing agent
- What do current leases actually rent for vs. the listed asking? Can we see a recent rent roll and the last 12 months of T-12 income?
- It's been on market 59 days. Have you received any prior offers? Is the seller open to a 3% concession, seller financing, or rate buy-down credit?
- Have any recent inspections been done? Can we get a copy of the seller's disclosures and any deferred-maintenance estimates?
- Built in 1956 — when were the roof, HVAC, electrical panel, plumbing, and water heater last replaced?
- What does the HOA fee cover, when was the last increase, and are there any pending special assessments or reserve-fund shortfalls?
- Any open or pending special assessments — roof, HVAC, plumbing, elevator, façade? What's the per-unit balance and payoff schedule, and is the seller paying it off at close or rolling it to the buyer?
- Is there a deadline driving the sale (1031 exchange, divorce, estate, relocation)? That informs how much negotiation room exists.
- The area grade is low — what's the realistic commute time and amenity access for the typical tenant pool here? Any planned neighborhood developments (good or bad) we should know about?
- What's the average days-on-market for RENTAL listings here right now (not sales)? A rising rental-DOM trend means longer vacancies and softer asking-rent achievability than the comps imply.
- What's the recent tenant-quality profile in this submarket — average credit score on applications, eviction rate, late-payment / NSF rate, and stable-employment percentage? A property-management company in the area should have these aggregated.
- How much new apartment / multifamily construction is in the pipeline within 1–3 miles? Heavy new supply (>2% of stock underway) typically softens rents 12–24 months out; light construction supports rent growth.
Investment metrics
- 1% rule
- 2.04% ✓
- Cap rate
- 4.83%
- Cash-on-cash
- -5.24%
- DSCR
- 0.77
- GRM
- 4.1
CMA / ARV
- ARV (median comp)
- $178,847
- List price
- $110,000
- Delta
- -38.49%
- Verdict
- UNDERPRICED
- Comps
- 20 within 1.0 mi
Projected returns pro-forma
-3.0% appreciation · 8.0% rent growth · sell at horizon
- IRR
- -11.0%
- Equity multiple
- 0.55×
- Total profit
- $-13,761
- Equity at exit
- $16,401
- IRR
- 9.6%
- Equity multiple
- 2.11×
- Total profit
- $34,100
- Equity at exit
- $9,511
Cash invested: $30,800 (down + closing). Projections, not guarantees.
Landlord ↔ Tenant lean methodology
- Overall (CITY)
- 5 Strongly Tenant-Friendly
- State New York
- 15 Strongly Tenant-Friendly · D+10
- County
- — inherits STATE
- City Yonkers
- 5 Strongly Tenant-Friendly · D+20
ZIP-level market 10705
- Rents YoY
- 9.0%
- Active inventory
- 86
- Price-to-rent
- 4.1×
Monthly cashflow live
- Estimated rent
- $2,249 high interval (Pro) →
- Mortgage (P&I)
- −$577
- Tax est. 1.5%
- −$138 /mo · $1,650/yr
- Insurance
- −$46
- HOA est. from 1 same-building comp
- −$1,151
- Vacancy / Maint / Mgmt
- −$472
- Net cashflow
- $-134
Break-even live
UW: 25.0% down · 7.5% · 30yr · 1.5% tax · 5.0% vac · 8.0% maint · 8.0% mgmt
Financing live
Cash to close
- Down payment
- $27,500
- Closing costs
- $3,300
- Reserves months
- —
- Total cash needed
- —
Loan-product check · same deal, 3 products live
Conventional
25% down · 7.5% · 30yr
- Down + closing
- —
- Monthly P&I
- —
- Monthly cashflow
- —
- DSCR
- —
- Eligible?
- —
Personal DTI + credit; lowest rate.
DSCR
20% down · 8.5% · 30yr
- Down + closing
- —
- Monthly P&I
- —
- Monthly cashflow
- —
- DSCR
- —
- Eligible?
- —
No personal income docs; deal must DSCR.
Hard money
10% down · 12.0% · 12mo
- Down + closing
- —
- Monthly P&I
- —
- Monthly cashflow
- —
- DSCR
- —
- Eligible?
- —
Short-term bridge; refi at stabilization.
Rent comps 27 comps
| Address | Beds | Baths | Sqft | Rent | $/sqft | DOM | Units | Dist |
|---|---|---|---|---|---|---|---|---|
| 36 Bruce Ave Yonkers, NY | 1.0 | 1.0 | 625 | $1,785 | $2.86 | 43d | 1 | 0.41mi |
| 117 Morris St Yonkers, NY | 1.0 | 1.0 | 700 | $2,000 | $2.86 | 5d | 1 | 0.51mi |
| 280 Hawthorne Ave Yonkers, NY | 1.0 | 1.0 | 700 | $2,100 | $3.00 | 7d | 2 | 0.53mi |
| 249 McLean Ave Unit 1B Yonkers, NY | 1.0 | 1.0 | 700 | $2,500 | $3.57 | 17d | 1 | 0.69mi |
| 14 Highland Ave Unit 2A Yonkers, NY | 1.0 | 1.0 | 1000 | $1,500 | $1.50 | 18d | 1 | 0.74mi |
| 212 Buena Vista Ave Unit 3F Yonkers, NY | 1.0 | 1.0 | 800 | $2,100 | $2.62 | 18d | 1 | 0.89mi |
| 57 Putnam Ave Yonkers, NY | 2.0 | 1.0 | 900 | $3,000 | $3.33 | 11d | 1 | 0.96mi |
| 57 Putnam Ave Yonkers, NY | 2.0 | 1.0 | 900 | $3,000 | $3.33 | 22d | 1 | 0.96mi |
| 130 Harrison Ave Yonkers, NY | 1.0 | 1.0 | 650 | $1,900 | $2.92 | 43d | 1 | 1.07mi |
| 162 Willow St Unit 1F Yonkers, NY | 1.0 | 1.0 | 700 | $2,200 | $3.14 | 14d | 1 | 1.19mi |
| 162 Willow St Yonkers, NY | 1.0 | 1.0 | 700 | $2,100 | $3.00 | 7d | 1 | 1.19mi |
| 20 Water Grant St Yonkers, NY | 1.0–2.0 | 1.0–2.0 | 827 | $2,522 | $3.05 | 1d | 22 | 1.20mi |
| 158 Willow St Unit 1B Yonkers, NY | 2.0 | 1.0 | 600 | $2,100 | $3.50 | 1d | 1 | 1.20mi |
| 44 Hudson St Yonkers, NY | 2.0 | 1.0–2.0 | 922 | $3,200 | $3.47 | 7d | 25 | 1.28mi |
| 97 Waverly St Unit 3R Yonkers, NY | 1.0 | 1.0 | 600 | $1,850 | $3.08 | 15d | 1 | 1.30mi |
| 66 Main St Yonkers, NY | 2.0 | 1.0–2.0 | 906 | $2,786 | $3.07 | 3d | 4 | 1.34mi |
| 50 Main St Unit 3F Yonkers, NY | 1.0 | 1.0 | 900 | $2,000 | $2.22 | 24d | 1 | 1.34mi |
| 2 Mill St Unit 2B Yonkers, NY | — | 1.0 | 741 | $2,095 | $2.83 | 43d | 1 | 1.37mi |
| 23 N Broadway Unit 4F Yonkers, NY | 2.0 | 1.0 | 699 | $2,400 | $3.43 | 22d | 1 | 1.38mi |
| 50 Nepperhan St Yonkers, NY | 3.0 | 1.0–2.0 | 887 | $3,248 | $3.66 | 1d | 20 | 1.39mi |
| 25 N Broadway #1 Yonkers, NY | — | 1.0 | 872 | $2,550 | $2.92 | 43d | 1 | 1.39mi |
| 91 Elm St Unit 1A Yonkers, NY | 1.0 | 1.0 | 650 | $1,800 | $2.77 | 15d | 1 | 1.44mi |
| 91 Elm St Unit 1A Yonkers, NY | 1.0 | 1.0 | 650 | $1,900 | $2.92 | 43d | 1 | 1.44mi |
| 675 McLean Ave Unit 006H Yonkers, NY | 1.0 | 1.0 | 577 | $2,071 | $3.59 | 4d | 1 | 1.45mi |
| 30 Locust Hill Ave Yonkers, NY | 1.0–2.0 | 1.0 | 735 | $1,800 | $2.45 | 43d | 3 | 1.48mi |
| 30 Locust Hill Ave Yonkers, NY | 1.0–2.0 | 1.0 | 735 | $1,800 | $2.45 | 7d | 2 | 1.48mi |
| 1 Alexander St Yonkers, NY | 2.0 | 1.0–2.0 | 837 | $3,188 | $3.81 | 7d | 48 | 1.48mi |
HOA detail condo
- Monthly dues
- $0 · $0/yr
- Assessments
- None detected in remarks — confirm with the listing agent.
Listing history 20 events
-
2026-06-18days on market $110,000 Active 59 DOM
-
2026-06-17days on market $110,000 Active 58 DOM
-
2026-06-16days on market $110,000 Active 57 DOM
-
2026-06-15days on market $110,000 Active 56 DOM
-
2026-06-13days on market $110,000 Active 54 DOM
-
2026-06-09days on market $110,000 Active 50 DOM
-
2026-06-08days on market $110,000 Active 49 DOM
-
2026-06-07days on market $110,000 Active 48 DOM
-
2026-06-04days on market $110,000 Active 45 DOM
-
2026-06-03days on market $110,000 Active 44 DOM
-
2026-06-02days on market $110,000 Active 43 DOM
-
2026-06-01days on market $110,000 Active 42 DOM
-
2026-05-31days on market $110,000 Active 41 DOM
-
2026-03-31$110,000 Active 73-char remark
Show marketing remark (73 chars)
Spacious one bedroom coop located in downtown Yonkers. Bring your vision
-
2025-12-19historical
-
2025-12-02price $110,000
-
2025-07-09$120,000 Active
-
2024-01-08price $89,000
-
2023-09-26price $99,000
-
2023-06-09$105,000 Active
ⓘ Source: listings_history table (triggers on properties + properties_extension) + one-shot
backfill from property_details.listing_events for pre-trigger history.
Climate risk First Street
- Flood 4/10 Moderate FEMA zone X (unshaded) · 22% chance over 30 yrs
- Wildfire 1/10 Low
- Heat 6/10 Major 7 d/yr ≥99°F today · 15 d/yr by 30 yrs out
- Wind 6/10 Major 27% chance of damaging wind over 30 yrs
- Air quality 3/10 Moderate 3 unhealthy d/yr today · 4 by 30 yrs out
Nearby sold comps map
Loading sold comps map…
Walkable amenities ~0.75 mi
Loading nearby amenities…
Taxation est. · year 1
- Rental income
- $26,988
- − Mortgage interest
- −$6,162
- − Property taxes
- −$1,650
- − Insurance
- −$550
- − Repairs & maintenance
- −$2,159
- − Management
- −$2,159
- − HOA
- −$13,812
- − Depreciation
- −$3,200
- Taxable loss
- −$2,703
- Est. tax savings @ 24.0%
- +$649
- After-tax cash flow
- $-965/yr
For passive investors: Depreciation is non-cash, so a rental often shows a tax loss while cash-flowing — sheltering income. Rental losses are passive: they offset passive income freely, and up to $25,000/yr can offset ordinary (W-2) income if you actively participate and your MAGI is under $100k (phasing out to $0 by $150k); unused losses carry forward. On sale, claimed depreciation is recaptured at up to 25%, and gains may owe capital-gains tax (a 1031 exchange can defer both). Figures are a year-1 estimate at your 24.0% rate — not tax advice; consult a CPA.
Condition & rehab AI · 1 photo
This property requires extensive repairs and maintenance to bring it up to a livable condition. Significant improvements to the exterior, interior, and kitchen are needed to increase its resale and rental value.
Repairs flagged
- Major exterior brick facade — Severe weathering and staining
- Major roof — Cannot confirm condition
- Major flooring — Worn and stained
- Major interior walls/paint — Cannot confirm condition
- Major bathrooms — Cannot confirm condition
- Major kitchen — Cannot confirm condition
- Major systems — Cannot confirm condition
Value-add opportunities
- Resale Paint exterior brick facade — Enhances curb appeal and property value
- Resale Replace worn flooring — Improves living space and enhances property value
- Resale Paint interior walls and repaint bathrooms — Enhances interior appearance and property value
- Resale Replace kitchen appliances — Modernizes kitchen and enhances property value
Renovation cost estimate screening
| Repair item | Severity | Est. cost |
|---|---|---|
| exterior brick facade · Severe weathering and staining | Major | $15,000–50,000 |
| roof · Cannot confirm condition | Major | $15,000–50,000 |
| flooring · Worn and stained | Major | $15,000–50,000 |
| interior walls/paint · Cannot confirm condition | Major | $15,000–50,000 |
| bathrooms · Cannot confirm condition | Major | $15,000–50,000 |
| kitchen · Cannot confirm condition | Major | $15,000–50,000 |
| systems · Cannot confirm condition | Major | $15,000–50,000 |
| Total estimated repair cost · 7 items | $105,000–350,000 |
Value-add ROI direction
- Resale Paint exterior brick facade — Enhances curb appeal and property value ↑
- Resale Replace worn flooring — Improves living space and enhances property value ↑
- Resale Paint interior walls and repaint bathrooms — Enhances interior appearance and property value ↑
- Resale Replace kitchen appliances — Modernizes kitchen and enhances property value ↑
ⓘ Cost ranges are severity-bucket heuristics (US national rule-of-thumb). Get contractor quotes + a written scope before underwriting a rehab budget.
Schools (NCES district)
- District
- Yonkers City School District
- NCES district ID
- 3631920
- Math proficiency
- 41% ▼ -1.00%
- Reading proficiency
- 54% ▲ 14.00%
- Median HH income
- $58,042
- Composite
- 41.43/100
- National rank
- #3471
- State rank
- #413 of 590 in NY
Livability — Yonkers
- Score
- 68/100
- State rank
- #528
- US rank
- #9394
Category grades
Schools grade is shown separately in the Schools card above.
Census & demographics
- Census place
- Yonkers, NY
- County
- Westchester County · 709,332 people
- City population
- 212,407
- Metro
- New York-Newark-Jersey City, NY-NJ-PA
- Population (ZIP)
- 38,887
- Household income
- $67,918
- Rent vs Own
- Severe rent burden
- 2783.0
Population outlook (Westchester County) Hauer SSP2
- Today (2025)
- 1,028,035 people
- By 2030
- 1,051,636 · +2.3%
- By 2040
- 1,098,520 · +6.9%
- By 2050
- 1,136,044 · +10.5%
- By 2075
- 1,196,925 · +16.4%
- By 2100
- 1,175,147 · +14.3%
Race, ethnicity, and origin ACS 2023
- Neighborhood character
- Diverse neighborhood (Simpson 0.56)
- Race & ethnicity
- Hispanic / Latino 62% White 17% Two or more races 16% Black 12% Asian 5% Native American 1%
- Hispanic origin (detail)
- Mexican 13% Puerto Rican 9% Dominican 27%
- Common ancestry
- Scotch-Irish 1% Romanian 1%
- Foreign-born
- 40% · Canada, Jamaica, South Korea
- Languages at home
- 39% English-only · Spanish 51% Other Indo-European 3% Other Asian/Pacific 2%
Political lean MEDSL · Westchester
- 2024 margin
- Strong D (+26.3) · D 63.1% · R 36.9%
- 2008→2024 swing
- -1.3pp toward R · 2008: 27.6pp · 2024: 26.3pp
- All cycles
- 2024: D+26.3 2020: D+36.3 2016: D+32.8 2012: D+22.2 2008: D+27.6
Not yet ingested
- Civics
- —
Market trends
- HPI YoY
- ▼ -368.22%
- Current HPI
- 314.1777
- Rent YoY
- ▲ 9.00%
- Metro
- New York-Newark-Jersey City, NY-NJ-PA
- State GDP YoY
- ▲ 2.60%
- F500 in state
- 92
Industry mix (Fortune 500 HQ in NY)
| Industry | F500 HQs | Revenue |
|---|---|---|
| Financial Services | 10 | $950B |
|
||
| Consumer Goods | 9 | $162B |
|
||
| Insurance | 4 | $225B |
|
||
| Telecommunications | 2 | $144B |
|
||
| Pharmaceuticals | 2 | $112B |
|
||
| Media / Entertainment | 2 | $69B |
|
||
Price history
+4.8% since first listed7 events — show timeline
- 2026-03-31 Listed $110,000 OneKey® MLS as Distributed by MLS Grid
- 2025-12-19 Listing Removed — OneKey® MLS as Distributed by MLS Grid
- 2025-12-02 Price Changed $110,000 OneKey® MLS as Distributed by MLS Grid
- 2025-07-09 Listed $120,000 OneKey® MLS as Distributed by MLS Grid
- 2024-01-08 Price Changed $89,000 OneKey® MLS as Distributed by MLS Grid
- 2023-09-26 Price Changed $99,000 OneKey® MLS as Distributed by MLS Grid
- 2023-06-09 Listed $105,000 OneKey® MLS as Distributed by MLS Grid
Cash-flow waterfall
monthlySold comps — $/sqft
last 12 mo · ≤1 miLoading sold comps…