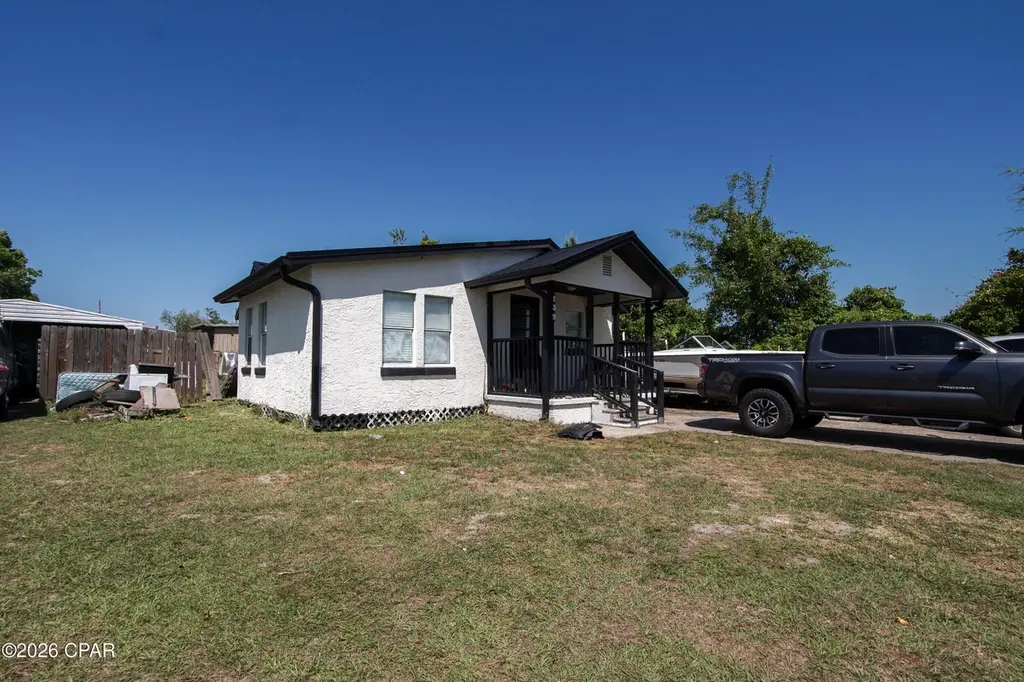
139 N Larry Dr · Callaway, FL
Flood risk 1/10 · Minimal
- FEMA flood zone
- X (unshaded)
- Chance of flooding over 30 yrs
- 0.0%
- Est. flood insurance / yr
- $507 – $1,088
Fire risk 5/10 · Moderate
- Est. fire insurance / yr
- $947 – $1,759
Heat risk 10/10 · Severe
- Hot days now (above 104°F)
- 7 days/yr
- Hot days in 30 yrs
- 21 days/yr
Wind risk 9/10 · Severe
- Chance of severe wind over 30 yrs
- 99.0%
Air-quality risk 1/10 · Minimal
- Unhealthy air days now
- 0 days/yr
- Unhealthy air days in 30 yrs
- 0 days/yr
Risk factors via First Street. Map © Google.
Why this score? — see what drove the C- grade
The composite is a weighted blend of 9 inputs, each scored 0–100. Each bar is that input's sub-score; the figure is the points it added to the 100-point composite (weight × sub-score).
- Cash flow +16.5/30.0
- ARV discount +13.0/15.0
- DSCR +5.1/10.0
- Schools +4.3/10.0
- 1% rule +3.5/10.0
- Livability +3.2/5.0
- Rent growth +2.8/5.0
- Condition / age +2.5/5.0
- Appreciation +0.0/10.0
$155,000
🖨 Deal sheet 📄 Offer letter ✓ Due diligence
Listing remarks MLS
Remodeled 2BR/1BA home near Tyndall Air Force Base. Interior features modern updates throughout, offering a clean and functional living space. Convenient location close to schools, shopping, dining, and grocery stores. Property is tenant-occupied, great investment opportunity with immediate income potential. Exterior includes a large yard, carport, covered front porch, and storage shed.
Key facts
- Modern updates
- Prime location
- Remodeled home
Tags
Neighborhood map
What this means for you Summary
Snapshot
- This is a 2-bed/1.0-bath single-family listed at $155k.
Deal economics
- At list price, monthly cash flow is $90 ($1k/yr) — positive.
- The deal already cash-flows at list — no discount required.
- To meet the 1% rule (rent ≥ 1% of price), the offer needs to be $132k (15.0% below list).
- Recommended offer: $132k (15.0% below list) — sets the bar for 1% rule.
- Cap rate 7.0% vs local median 5.1% in Callaway — top-decile yield for the area; either an underpriced asset or a hidden risk that comps aren't pricing in. Stress-test before assuming the spread holds.
Location & tenants
- Location reads 64/100 on livability (#690 in FL) — a middle-class / working-renter tenant base. Strengths: cost of living A+, housing A+; Watch: employment D+, schools F, amenities F.
- Bay (suburban): math 51% / reading 51% proficiency, ranked #29 of 73 in FL (top 40%) — acceptable for families but not a draw, mixed tenant base, ~2y average lease.
- Market conditions: Rents rising (+1.1%/yr); 969 active listings in the ZIP; 19 comparable units currently listed for rent nearby; rentals at typical pace (median 21d on market — plan ~3-4 weeks tenant-placement turnaround); 2,473 units permitted in Bay County in 2024 (559 in 5+ unit buildings).
Forward outlook
- Local home prices are declining (-3.0%/yr); year-one equity from $1k of loan paydown is wiped out by about $5k of value loss. Plan a longer hold.
- Bay County population projected at +24% by 2050 — long-run rental-demand tailwind backs the buy-and-hold thesis.
Negotiation context
- It's been on market 69 days — a 6% lower offer ($146k) is reasonable based on typical stale-listing flexibility.
- 4 sale attempts since 26y ago with the ask held roughly flat each time — persistent listings suggest the price (not the market) is what's stuck; bring a comps-based counter.
- Current owner paid $75k; list at $155k implies a 107% gain — meaningful room to come down on a strong offer.
Risks & watch-outs
- Climate carrying-cost: severe wind risk, 99% chance of damaging wind over 30y; moderate wildfire risk; extreme-heat days projected 7→21/yr by 2055 (HVAC capex compounding) — expect insurance premiums to compound above CPI over the hold.
Questions for the listing agent
- It's been on market 69 days. Have you received any prior offers? Is the seller open to a 15% concession, seller financing, or rate buy-down credit?
- Built in 1960 — when were the roof, HVAC, electrical panel, plumbing, and water heater last replaced?
- Why hasn't it sold? Are there any deal-killer items the seller is aware of (foundation, flood, title, zoning, code violations)?
- Is there a deadline driving the sale (1031 exchange, divorce, estate, relocation)? That informs how much negotiation room exists.
- Schools are F-rated, which usually means shorter tenancies and higher turnover. Who's the typical renter profile here, and what's been the actual vacancy rate?
- What's the average days-on-market for RENTAL listings here right now (not sales)? A rising rental-DOM trend means longer vacancies and softer asking-rent achievability than the comps imply.
- What's the recent tenant-quality profile in this submarket — average credit score on applications, eviction rate, late-payment / NSF rate, and stable-employment percentage? A property-management company in the area should have these aggregated.
- How much new for-sale + rental construction is in the pipeline within 1–3 miles? Heavy new supply typically softens prices + rents 12–24 months out; constrained supply supports both.
Investment metrics
- 1% rule
- 0.85% ✗
- Cap rate
- 6.99%
- Cash-on-cash
- 2.50%
- DSCR
- 1.11
- GRM
- 9.8
CMA / ARV
- ARV (median comp)
- $176,649
- List price
- $155,000
- Delta
- -12.26%
- Verdict
- UNDERPRICED
- Comps
- 6 within 1.0 mi
Projected returns pro-forma
-3.0% appreciation · 1.12% rent growth · sell at horizon
- IRR
- -14.3%
- Equity multiple
- 0.50×
- Total profit
- $-21,864
- Equity at exit
- $23,111
- IRR
- -8.6%
- Equity multiple
- 0.50×
- Total profit
- $-21,515
- Equity at exit
- $13,402
Cash invested: $43,400 (down + closing). Projections, not guarantees.
Landlord ↔ Tenant lean methodology
- Overall (STATE)
- 87 Strongly Landlord-Friendly
- State Florida
- 87 Strongly Landlord-Friendly · R+3
- County
- — inherits STATE
- City
- — inherits STATE
ZIP-level market 32404
- Home prices YoY
- -16.1%
- Rents YoY
- 1.1%
- Active inventory
- 969
- Price-to-rent
- 9.8×
Monthly cashflow live
- Estimated rent
- $1,317 high interval (Pro) →
- Mortgage (P&I)
- −$813
- Tax from tax record
- −$73 /mo · $871/yr
- Insurance
- −$65
- HOA
- −$0
- Vacancy / Maint / Mgmt
- −$277
- Net cashflow
- $90
Break-even live
UW: 25.0% down · 7.5% · 30yr · 1.5% tax · 5.0% vac · 8.0% maint · 8.0% mgmt
Financing live
Cash to close
- Down payment
- $38,750
- Closing costs
- $4,650
- Reserves months
- —
- Total cash needed
- —
Loan-product check · same deal, 3 products live
Conventional
25% down · 7.5% · 30yr
- Down + closing
- —
- Monthly P&I
- —
- Monthly cashflow
- —
- DSCR
- —
- Eligible?
- —
Personal DTI + credit; lowest rate.
DSCR
20% down · 8.5% · 30yr
- Down + closing
- —
- Monthly P&I
- —
- Monthly cashflow
- —
- DSCR
- —
- Eligible?
- —
No personal income docs; deal must DSCR.
Hard money
10% down · 12.0% · 12mo
- Down + closing
- —
- Monthly P&I
- —
- Monthly cashflow
- —
- DSCR
- —
- Eligible?
- —
Short-term bridge; refi at stabilization.
Rent comps 19 comps
| Address | Beds | Baths | Sqft | Rent | $/sqft | DOM | Units | Dist |
|---|---|---|---|---|---|---|---|---|
| 168 N Comet Ave Panama City, FL | 2.0 | 2.0 | 950 | $1,100 | $1.16 | 20d | 1 | 0.13mi |
| 6101 Harvey St #3 Panama City, FL | 2.0 | 1.5 | 1108 | $1,050 | $0.95 | 20d | 1 | 0.35mi |
| 6121 Harvey St Apt 16 Panama City, FL | 2.0 | 1.5 | 1000 | $1,090 | $1.09 | 20d | 1 | 0.36mi |
| 6724 Chipewa St Unit 6724 Panama City, FL | 2.0 | 1.0 | 1000 | $1,125 | $1.12 | 13d | 1 | 0.37mi |
| 116 Christie Ln Panama City, FL | 3.0 | 2.0 | 1092 | $1,550 | $1.42 | 20d | 1 | 0.42mi |
| 5805 Cherry St Panama City, FL | 2.0 | 1.0 | 1025 | $1,200 | $1.17 | 13d | 1 | 0.50mi |
| 108 N Anita Dr Callaway, FL | 1.0 | 1.0 | 700 | $1,200 | $1.71 | 20d | 1 | 0.50mi |
| 7006 Lois St Unit B Panama City, FL | 2.0 | 1.0 | 1000 | $1,000 | $1.00 | 20d | 1 | 0.54mi |
| 322 S Burkett Dr Panama City, FL | 1.0–2.0 | 1.0–2.0 | 600 | $1,519 | $2.53 | 13d | 13 | 0.73mi |
| 719 S Berthe Ave Unit 8 Panama City, FL | 2.0 | 1.0 | 910 | $1,000 | $1.10 | 20d | 1 | 0.96mi |
| 208 North Highway 22 A Unit 33 Panama City, FL | 3.0 | 2.0 | 1080 | $1,350 | $1.25 | 20d | 1 | 1.12mi |
| 5101 Willow St Panama City, FL | 3.0 | 2.0 | 1099 | $1,500 | $1.36 | 13d | 1 | 1.12mi |
| 149 North Highway 22 A Unit 5 Panama City, FL | 2.0 | 1.0 | 900 | $1,140 | $1.27 | 13d | 1 | 1.21mi |
| 4905 Alameda St Unit 1 Panama City, FL | 3.0 | 2.0 | 942 | $1,295 | $1.37 | 20d | 1 | 1.27mi |
| 285 Sukoshi Dr Unit C Panama City, FL | 2.0 | 1.5 | 916 | $1,250 | $1.36 | 13d | 1 | 1.27mi |
| 291 Sukoshi Dr Unit A Panama City, FL | 2.0 | 1.5 | 918 | $1,495 | $1.63 | 20d | 1 | 1.28mi |
| 126 Kristine Blvd Panama City, FL | 2.0 | 1.0 | 884 | $1,400 | $1.58 | 20d | 1 | 1.34mi |
| 4837 S Lakewood Dr Panama City, FL | 2.0 | 1.5 | 1116 | $1,500 | $1.34 | 20d | 1 | 1.42mi |
| 543 N 9th St Unit 543 Panama City, FL | 2.0 | 1.0 | 850 | $1,195 | $1.41 | 13d | 1 | 1.50mi |
Listing history 28 events
-
2026-06-19days on market $155,000 Active 69 DOM
-
2026-06-18days on market $155,000 Active 68 DOM
-
2026-06-17days on market $155,000 Active 67 DOM
-
2026-06-16days on market $155,000 Active 66 DOM
-
2026-06-15days on market $155,000 Active 65 DOM
-
2026-06-14days on market $155,000 Active 63 DOM
-
2026-06-13days on market $155,000 Active 62 DOM
-
2026-06-10days on market $155,000 Active 60 DOM
-
2026-06-09days on market $155,000 Active 59 DOM
-
2026-06-08days on market $155,000 Active 58 DOM
-
2026-06-07remarks 404-char remark
-
2026-06-07pricedays on market $155,000 Active 57 DOM
-
2026-06-05days on market $160,000 Active 54 DOM
-
2026-06-03days on market $160,000 Active 53 DOM
-
2026-06-02days on market $160,000 Active 52 DOM
-
2026-06-01days on market $160,000 Active 51 DOM
-
2026-05-31days on market $160,000 Active 50 DOM
-
2026-05-30days on market $160,000 Active 49 DOM
-
2026-04-10$160,000 Active 389-char remark
Show marketing remark (389 chars)
Remodeled 2BR/1BA home near Tyndall Air Force Base. Interior features modern updates throughout, offering a clean and functional living space. Convenient location close to schools, shopping, dining, and grocery stores. Property is tenant-occupied, great investment opportunity with immediate income potential. Exterior includes a large yard, carport, covered front porch, and storage shed.
-
2007-07-31soldstatus $75,000
-
2007-07-27soldstatus $75,000 398-char remark
Show marketing remark (398 chars)
Age, Sq. Ft. Room sixes approx: Fantastic starter home or investment; New paint inside and out; new double car carport with storage. 2003 new plumbing and electrical. Ownership pride shows throughout this home inside and out! Nestled on 75 x 129 foot chain link fenced lot. This home is always a pleasure to show! Call today you wont be disappointed. Close to Tyndall AFB, Schools & Shopping.
-
2007-06-04$75,000 398-char remark
Show marketing remark (398 chars)
Age, Sq. Ft. Room sixes approx: Fantastic starter home or investment; New paint inside and out; new double car carport with storage. 2003 new plumbing and electrical. Ownership pride shows throughout this home inside and out! Nestled on 75 x 129 foot chain link fenced lot. This home is always a pleasure to show! Call today you wont be disappointed. Close to Tyndall AFB, Schools & Shopping.
-
2003-05-09soldstatus $35,900
-
2002-12-16$35,900
-
2000-08-28soldstatus $34,200
-
2000-03-16$30,400
-
1994-11-01soldstatus $29,900
-
1984-02-01soldstatus $9,000
ⓘ Source: listings_history table (triggers on properties + properties_extension) + one-shot
backfill from property_details.listing_events for pre-trigger history.
Tax reassessment forecast FL · Resets to sale price
- Current annual tax
- $871 · $73/mo
- Projected year-2 tax
- $1,286 · $107/mo
- Expected delta
- +$416/yr (+$35/mo · 47.7%)
ⓘ Screening estimate from a state-policy table — verify with the county assessor before closing.
Climate risk First Street
- Flood 1/10 Low FEMA zone X (unshaded) · 0% chance over 30 yrs
- Wildfire 5/10 Major
- Heat 10/10 Extreme 7 d/yr ≥104°F today · 21 d/yr by 30 yrs out
- Wind 9/10 Extreme 99% chance of damaging wind over 30 yrs
- Air quality 1/10 Low 0 unhealthy d/yr today · 0 by 30 yrs out
Nearby sold comps map
Loading sold comps map…
Walkable amenities ~0.75 mi
Loading nearby amenities…
Taxation est. · year 1
- Rental income
- $15,802
- − Mortgage interest
- −$8,682
- − Property taxes
- −$871
- − Insurance
- −$775
- − Repairs & maintenance
- −$1,264
- − Management
- −$1,264
- − Depreciation
- −$4,509
- Taxable loss
- −$1,563
- Est. tax savings @ 24.0%
- +$375
- After-tax cash flow
- $1,459/yr
For passive investors: Depreciation is non-cash, so a rental often shows a tax loss while cash-flowing — sheltering income. Rental losses are passive: they offset passive income freely, and up to $25,000/yr can offset ordinary (W-2) income if you actively participate and your MAGI is under $100k (phasing out to $0 by $150k); unused losses carry forward. On sale, claimed depreciation is recaptured at up to 25%, and gains may owe capital-gains tax (a 1031 exchange can defer both). Figures are a year-1 estimate at your 24.0% rate — not tax advice; consult a CPA.
Schools (NCES district)
- District
- Bay
- NCES district ID
- 1200090
- Math proficiency
- 51% ▼ -8.00%
- Reading proficiency
- 51% ▼ -7.00%
- Median HH income
- $47,740
- Composite
- 43.41/100
- National rank
- #3014
- State rank
- #29 of 73 in FL
Livability — Callaway
- Score
- 64/100
- State rank
- #690
- US rank
- #14384
Category grades
Schools grade is shown separately in the Schools card above.
Census & demographics
- Census place
- Callaway, FL
- County
- Bay County · 163,593 people
- Metro
- Panama City, FL
- Population (ZIP)
- 42,514
- Household income
- $74,708
- Rent vs Own
- Severe rent burden
- 1218.0
Population outlook (Bay County) Hauer SSP2
- Today (2025)
- 206,264 people
- By 2030
- 217,740 · +5.6%
- By 2040
- 238,738 · +15.7%
- By 2050
- 255,545 · +23.9%
- By 2075
- 288,295 · +39.8%
- By 2100
- 288,638 · +39.9%
Race, ethnicity, and origin ACS 2023
- Neighborhood character
- Predominantly White (69%)
- Race & ethnicity
- White 69% Black 12% Two or more races 10% Hispanic / Latino 9% Asian 3%
- Hispanic origin (detail)
- Mexican 2% Puerto Rican 3%
- Common ancestry
- Lithuanian 3% Slovak 2% Italian 2%
- Foreign-born
- 7% · Canada, Vietnam, Mexico
- Languages at home
- 90% English-only · Spanish 6% Vietnamese 1% Other Asian/Pacific 1%
Political lean MEDSL · Bay
- 2024 margin
- Solid R (+47.4) · D 25.8% · R 73.1% · Other 1.1%
- 2008→2024 swing
- -6.6pp toward R · 2008: -40.7pp · 2024: -47.4pp
- All cycles
- 2024: R+47.4 2020: R+43.5 2016: R+46.3 2012: R+43.6 2008: R+40.7
Not yet ingested
- Civics
- —
Market trends
- HPI YoY
- ▼ -50.59%
- Current HPI
- 263.7178
- Rent YoY
- ▲ 1.12%
- Metro
- Panama City, FL
- State GDP YoY
- ▲ 3.28%
- F500 in state
- 36
Industry mix (Fortune 500 HQ in FL)
| Industry | F500 HQs | Revenue |
|---|---|---|
| Industrial Technology | 2 | $29B |
|
||
| Insurance | 2 | $17B |
|
||
| Retail | 1 | $60B |
|
||
| Technology Distribution | 1 | $58B |
|
||
| Homebuilding | 1 | $35B |
|
||
| Technology Manufacturing | 1 | $35B |
|
||
Price history
+1677.8% since first listed10 events — show timeline
- 2026-04-10 Listed $160,000 CPARMLS
- 2007-07-31 Sold (Public Records) $75,000 Public Records
- 2007-07-27 Sold (MLS) $75,000 CPARMLS
- 2007-06-04 Listed $75,000 CPARMLS
- 2003-05-09 Sold (MLS) $35,900 CPARMLS
- 2002-12-16 Listed $35,900 CPARMLS
- 2000-08-28 Sold (MLS) $34,200 CPARMLS
- 2000-03-16 Listed $30,400 CPARMLS
- 1994-11-01 Sold (Public Records) $29,900 Public Records
- 1984-02-01 Sold (Public Records) $9,000 Public Records
Property tax history
+12.9%/yrLatest (2025): $871 · +7.7% YoY. Source: county tax records.
Cash-flow waterfall
monthlySold comps — $/sqft
last 12 mo · ≤1 miLoading sold comps…