 🏷️ Likely Rental
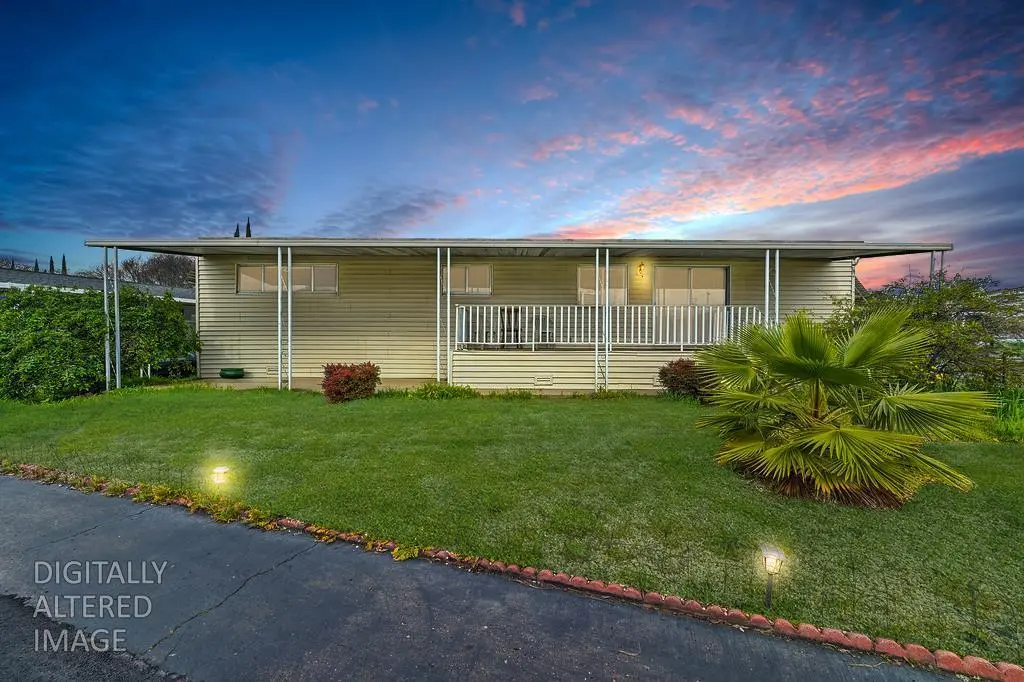
13 Duval St · Citrus Heights, CA
Flood risk 1/10 · Minimal
- FEMA flood zone
- X (unshaded)
- Chance of flooding over 30 yrs
- 0.0%
- Est. flood insurance / yr
- $507 – $1,088
Fire risk 3/10 · Minor
- Est. fire insurance / yr
- $659 – $1,223
Heat risk 7/10 · Major
- Hot days now (above 103°F)
- 7 days/yr
- Hot days in 30 yrs
- 15 days/yr
Wind risk 1/10 · Minimal
- Chance of severe wind over 30 yrs
- —
Air-quality risk 10/10 · Severe
- Unhealthy air days now
- 34 days/yr
- Unhealthy air days in 30 yrs
- 36 days/yr
Risk factors via First Street. Map © Google.
Why this score? — see what drove the C- grade
The composite is a weighted blend of 9 inputs, each scored 0–100. Each bar is that input's sub-score; the figure is the points it added to the 100-point composite (weight × sub-score).
- Cash flow +15.0/30.0
- ARV discount +15.0/15.0
- 1% rule +5.0/10.0
- DSCR +5.0/10.0
- Schools +4.4/10.0
- Rent growth +3.0/5.0
- Livability +3.0/5.0
- Condition / age +2.2/5.0
- Appreciation +0.0/10.0
$45,000
🖨 Deal sheet (PDF) 📄 Offer letter ✓ Due diligence
Listing remarks
Exceptional value for a double-wide home in desirable 55+ Stonegate Estates. Situated on a sunny private corner lot, this home offers spacious living, great natural light, covered parking, indoor laundry, and a relaxing covered deck. The longtime owners were non-smokers, had no pets, and completed several important improvements over the years, including furnace replacement in 2022, professional drain line repair in 2025, deck repairs in 2025, new dishwasher in 2025, and roof replacement approximately 2006. This home presents an opportunity for a buyer looking to personalize, renovate, and build equity over time. Recent inspections and disclosures are available for buyer review. The propert
Key facts
- Newer furnace
- Newer dishwasher
- Indoor laundry
Tags
Neighborhood map
What this means for you Summary
Snapshot
- This is a 2-bed/2.0-bath manufactured listed at $45k. Condition is rated fair.
Deal economics
- At list price, monthly cash flow is $1k ($15k/yr) — positive.
- The deal already cash-flows at list — no discount required.
- Meets the 1% rule at list price ($2k rent vs $45k).
- Recommended offer: $40k (12.0% below list) — sets the bar for market timing.
- Cap rate 38.8% vs local median 3.4% in Citrus Heights — top-decile yield for the area; either an underpriced asset or a hidden risk that comps aren't pricing in. Stress-test before assuming the spread holds.
Location & tenants
- Location reads 60/100 on livability (#614 in CA) — a middle-class / working-renter tenant base. Strengths: housing A+; Watch: crime D-, amenities F, commute F.
- San Juan Unified (suburban): math 40% / reading 62% proficiency, ranked #138 of 517 in CA (top 27%) — acceptable for families but not a draw, mixed tenant base, ~2y average lease.
- Zoned schools: Orangevale Open K-8 (572 students, 22% FRL); Sylvan Middle (647 students, 71% FRL); El Camino Fundamental High (math 34% / reading 62%, grade D, #378 of 1,170 statewide, top 32%, 1,246 students, 50% FRL) — zoned schools at 48% FRL track the district average.
- Market conditions: Rents rising (+1.9%/yr); 219 active listings in the ZIP; 25 comparable units currently listed for rent nearby; rentals leasing fast (median 6d on market — plan ~1-2 weeks tenant-placement turnaround); solid renter incomes; 6,825 units permitted in Sacramento County in 2024 (1,752 in 5+ unit buildings).
Forward outlook
- Local home prices are declining (-3.0%/yr); year-one equity from $311 of loan paydown is wiped out by about $1k of value loss. Plan a longer hold.
- Sacramento County population projected at +17% by 2050 — long-run rental-demand tailwind backs the buy-and-hold thesis.
- At projected returns (-3.0% appreciation + 1.9% rent growth), your $13k cash investment doubles in ~1 year — after that, you're playing with house money.
Negotiation context
- It's been on market 146 days — a 12% lower offer ($40k) is reasonable based on typical stale-listing flexibility.
Risks & watch-outs
- Climate carrying-cost: extreme-heat days projected 7→15/yr by 2055 (HVAC capex compounding) — expect insurance premiums to compound above CPI over the hold.
Questions for the listing agent
- It's been on market 146 days. Have you received any prior offers? Is the seller open to a 12% concession, seller financing, or rate buy-down credit?
- Have any recent inspections been done? Can we get a copy of the seller's disclosures and any deferred-maintenance estimates?
- Built in 1966 — when were the roof, HVAC, electrical panel, plumbing, and water heater last replaced?
- Why hasn't it sold? Are there any deal-killer items the seller is aware of (foundation, flood, title, zoning, code violations)?
- Is there a deadline driving the sale (1031 exchange, divorce, estate, relocation)? That informs how much negotiation room exists.
- Schools are D-rated, which usually means shorter tenancies and higher turnover. Who's the typical renter profile here, and what's been the actual vacancy rate?
- Crime grade is D in this area — have there been break-ins, vandalism, or insurance claims at this property in the last 3 years? What carrier currently insures it and at what premium?
- What's the average days-on-market for RENTAL listings here right now (not sales)? A rising rental-DOM trend means longer vacancies and softer asking-rent achievability than the comps imply.
- What's the recent tenant-quality profile in this submarket — average credit score on applications, eviction rate, late-payment / NSF rate, and stable-employment percentage? A property-management company in the area should have these aggregated.
- How much new for-sale + rental construction is in the pipeline within 1–3 miles? Heavy new supply typically softens prices + rents 12–24 months out; constrained supply supports both.
Investment metrics
- 1% rule
- 4.31% ✓
- Cap rate
- 38.83%
- Cash-on-cash
- 116.21%
- DSCR
- 6.17
- GRM
- 1.9
CMA / ARV
- ARV (median comp)
- $85,000
- List price
- $45,000
- Delta
- -47.06%
- Verdict
- UNDERPRICED
- Comps
- 13 within 1.0 mi
Show comp detail 9 sales within ~0.75 mi
| Address | Dist | Beds/Ba | Sqft | Sold | Price | $/sf | Match |
|---|---|---|---|---|---|---|---|
| 142 Sage St | 0.07mi | 2/2.0 | 1,060 (+2%) | 3mo | $90,000 | $85 | 91 |
| 42 Saxton Cir | 0.24mi | 2/2.0 | 1,040 (0%) | 10mo | $126,000 | $121 | 81 |
| 150 Sage St | 0.02mi | 2/2.0 | 960 (-8%) | 15mo | $89,999 | $94 | 74 |
| 29 Hanover St | 0.11mi | 2/2.0 | 954 (-8%) | 10mo | $87,000 | $91 | 73 |
| 114 Cambria | 0.07mi | 2/1.0 | 960 (-8%) | 11mo | $85,000 | $89 | 71 |
| 77 Cambria Cir | 0.08mi | 2/2.0 | 1,188 (+14%) | 8mo | $70,000 | $59 | 65 |
| 23 Hanover St | 0.07mi | 2/2.0 | 960 (-8%) | 24mo | $112,000 | $117 | 64 |
| 190 Saxton Cir #190 | 0.22mi | 2/2.0 | 1,154 (+11%) | 12mo | $137,500 | $119 | 62 |
| 140 Sage St | 0.09mi | 2/2.0 | 910 (-12%) | 19mo | $112,000 | $123 | 59 |
Match score weights: distance 35% · size 25% · config 20% · recency 20%. Top-matched comps best support the ARV.
Projected returns pro-forma
-3.0% appreciation · 1.9% rent growth · sell at horizon
- IRR
- —
- Equity multiple
- 6.42×
- Total profit
- $68,329
- Equity at exit
- $6,710
- IRR
- —
- Equity multiple
- 13.00×
- Total profit
- $151,170
- Equity at exit
- $3,891
Cash invested: $12,600 (down + closing). Projections, not guarantees.
Landlord ↔ Tenant lean methodology
- Overall (STATE)
- 18 Strongly Tenant-Friendly
- State California
- 18 Strongly Tenant-Friendly · D+13
- County
- — inherits STATE
- City
- — inherits STATE
ZIP-level market 95621
- Rents YoY
- 1.9%
- Active inventory
- 219
- Price-to-rent
- 1.9×
Monthly cashflow live
- Estimated rent
- $1,938 high interval (Pro) →
- Mortgage (P&I)
- −$236
- Tax est. 1.5%
- −$56 /mo · $675/yr
- Insurance
- −$19
- HOA
- −$0
- Vacancy / Maint / Mgmt
- −$407
- Net cashflow
- $1,220
Break-even live
Sensitivity live
| Price | -10% $1,251 | -5% $1,236 | +0% $1,220 | +5% $1,205 | +10% $1,189 |
|---|---|---|---|---|---|
| Rent | -10% $1,067 | -5% $1,144 | +0% $1,220 | +5% $1,297 | +10% $1,373 |
| Rate | -1.0pp $1,243 | -0.5pp $1,232 | base $1,220 | +0.5pp $1,209 | +1.0pp $1,197 |
UW: 25.0% down · 7.5% · 30yr · 1.5% tax · 5.0% vac · 8.0% maint · 8.0% mgmt
Financing live
Cash to close
- Down payment
- $11,250
- Closing costs
- $1,350
- Reserves months
- —
- Total cash needed
- —
Loan-product check · same deal, 3 products live
Conventional
25% down · 7.5% · 30yr
- Down + closing
- —
- Monthly P&I
- —
- Monthly cashflow
- —
- DSCR
- —
- Eligible?
- —
Personal DTI + credit; lowest rate.
DSCR
20% down · 8.5% · 30yr
- Down + closing
- —
- Monthly P&I
- —
- Monthly cashflow
- —
- DSCR
- —
- Eligible?
- —
No personal income docs; deal must DSCR.
Hard money
10% down · 12.0% · 12mo
- Down + closing
- —
- Monthly P&I
- —
- Monthly cashflow
- —
- DSCR
- —
- Eligible?
- —
Short-term bridge; refi at stabilization.
Rent comps 25 comps
| Address | Beds | Baths | Sqft | Rent | $/sqft | DOM | Units | Dist |
|---|---|---|---|---|---|---|---|---|
| 7445 Auburn Oaks Ct Unit K Citrus Heights, CA | 2.0 | 2.0 | 929 | $1,695 | $1.82 | 45d | 1 | 0.31mi |
| 7445 Auburn Oaks Ct Unit K Citrus Heights, CA | 2.0 | 2.0 | 929 | $1,700 | $1.83 | 23d | 1 | 0.31mi |
| 7434 Auburn Oaks Ct Citrus Heights, CA | 1.0–2.0 | 1.0 | 790 | $1,875 | $2.37 | 25d | 4 | 0.32mi |
| 7434 Auburn Oaks Ct Citrus Heights, CA | 2.0 | 1.0 | 890 | $1,975 | $2.22 | 5d | 1 | 0.32mi |
| 6841 Castleberry Cir Citrus Heights, CA | 3.0 | 2.0 | 1162 | $2,300 | $1.98 | 5d | 1 | 0.49mi |
| 1000 Cirby Oaks Way Roseville, CA | 1.0 | 1.0 | 700 | $1,906 | $2.72 | 0d | 2 | 0.58mi |
| 7603 Linden Ave Citrus Heights, CA | 2.0 | 1.5 | 990 | $1,900 | $1.92 | 19d | 1 | 0.67mi |
| 333 Cirby Way Roseville, CA | 1.0–2.0 | 1.0 | 796 | $2,115 | $2.66 | 3d | 4 | 0.73mi |
| 425 Cirby Way Roseville, CA | 1.0–2.0 | 1.0–2.0 | 812 | $2,274 | $2.80 | 3d | 1 | 0.76mi |
| 3 Somer Ridge Dr Roseville, CA | 1.0–2.0 | 1.0–2.0 | 909 | $2,270 | $2.50 | 0d | 6 | 0.92mi |
| 7437 Antelope Rd Citrus Heights, CA | 2.0 | 2.5 | 1287 | $2,550 | $1.98 | 5d | 1 | 0.92mi |
| 209 Live Oak Cir Roseville, CA | 1.0 | 1.0 | 1310 | $1,495 | $1.14 | 3d | 1 | 1.00mi |
| 7658 Poppy Way Unit 7658 Citrus Heights, CA | 2.0 | 1.0 | 900 | $1,695 | $1.88 | 4d | 1 | 1.09mi |
| 7658 Poppy Way Citrus Heights, CA | 2.0 | 1.0 | 900 | $1,785 | $1.98 | 16d | 1 | 1.09mi |
| 7915 Zenith Dr Citrus Heights, CA | 2.0 | 1.0 | 1015 | $1,895 | $1.87 | 23d | 1 | 1.13mi |
| 308 6th St Unit B Roseville, CA | 2.0 | 1.0 | 800 | $2,200 | $2.75 | 23d | 1 | 1.19mi |
| 7827 Zenith Dr Citrus Heights, CA | 2.0 | 2.0 | 1031 | $1,995 | $1.94 | 16d | 1 | 1.23mi |
| 7727 Mariposa Ave Unit 5 Citrus Heights, CA | 2.0 | 1.0 | 725 | $1,795 | $2.48 | 45d | 1 | 1.26mi |
| 348 B St Roseville, CA | 2.0 | 1.0 | 1150 | $1,995 | $1.73 | 3d | 1 | 1.30mi |
| 210 D St Roseville, CA | 3.0 | 2.5 | 1433 | $2,795 | $1.95 | 3d | 1 | 1.36mi |
| 315 B St Roseville, CA | 2.0 | 1.0 | 575 | $1,800 | $3.13 | 3d | 3 | 1.38mi |
| 7761 Pompei Ct Unit 7763 Citrus Heights, CA | 2.0 | 1.0 | 900 | $1,705 | $1.89 | 25d | 1 | 1.40mi |
| 6413 Tupelo Dr Citrus Heights, CA | 1.0–2.0 | 1.0–2.0 | 775 | $2,000 | $2.58 | 3d | 10 | 1.41mi |
| 8237 Sunrise Blvd Citrus Heights, CA | 3.0 | 2.0 | 1050 | $2,095 | $2.00 | 9d | 1 | 1.43mi |
| 7541 Ramona Ln Citrus Heights, CA | 1.0–2.0 | 1.0–2.0 | 837 | $2,295 | $2.74 | 4d | 9 | 1.46mi |
Listing history 14 events
-
2026-06-21days on market $45,000 Active 146 DOM
-
2026-06-18days on market $45,000 Active 143 DOM
-
2026-06-17days on market $45,000 Active 142 DOM
-
2026-06-16days on market $45,000 Active 141 DOM
-
2026-06-15days on market $45,000 Active 140 DOM
-
2026-06-13days on market $45,000 Active 138 DOM
-
2026-06-13days on market $45,000 Active 137 DOM
-
2026-06-10status $45,000 Active 134 DOM
-
2026-06-07statusdays on market $45,000 Pending 134 DOM
-
2026-06-05days on market $45,000 Active 133 DOM
-
2026-06-03pricedays on market $45,000 Active 132 DOM
-
2026-06-02days on market $49,995 Active 131 DOM
-
2026-06-01days on market $49,995 Active 130 DOM
-
2026-05-31days on market $49,995 Active 129 DOM
ⓘ Source: listings_history table (triggers on properties + properties_extension) + one-shot
backfill from property_details.listing_events for pre-trigger history.
Climate risk First Street
- Flood 1/10 Low FEMA zone X (unshaded) · 0% chance over 30 yrs
- Wildfire 3/10 Moderate
- Heat 7/10 Severe 7 d/yr ≥103°F today · 15 d/yr by 30 yrs out
- Wind 1/10 Low
- Air quality 10/10 Extreme 34 unhealthy d/yr today · 36 by 30 yrs out
Nearby sold comps map
Loading sold comps map…
Walkable amenities ~0.75 mi
Loading nearby amenities…
Taxation est. · year 1
- Rental income
- $23,258
- − Mortgage interest
- −$2,521
- − Property taxes
- −$675
- − Insurance
- −$225
- − Repairs & maintenance
- −$1,861
- − Management
- −$1,861
- − Depreciation
- −$1,309
- Taxable income
- $14,807
- Est. tax owed @ 24.0%
- −$3,554
- After-tax cash flow
- $11,088/yr
For passive investors: Depreciation is non-cash, so a rental often shows a tax loss while cash-flowing — sheltering income. Rental losses are passive: they offset passive income freely, and up to $25,000/yr can offset ordinary (W-2) income if you actively participate and your MAGI is under $100k (phasing out to $0 by $150k); unused losses carry forward. On sale, claimed depreciation is recaptured at up to 25%, and gains may owe capital-gains tax (a 1031 exchange can defer both). Figures are a year-1 estimate at your 24.0% rate — not tax advice; consult a CPA.
Condition & rehab AI · 12 photos
This double-wide manufactured home in Stonegate Estates requires cosmetic updates to its interior and exterior, with a focus on painting and replacing the air conditioning unit to enhance its resale and rental value.
Repairs flagged
- Minor kitchen backsplash — wooden countertop
- Minor bathroom vanity — wooden countertop
Value-add opportunities
- Both paint interior walls — enhances curb appeal and interior aesthetics
- Both replace air conditioning unit — improves comfort and energy efficiency
Renovation cost estimate screening
| Repair item | Severity | Est. cost |
|---|---|---|
| kitchen backsplash · wooden countertop | Minor | $500–3,000 |
| bathroom vanity · wooden countertop | Minor | $500–3,000 |
| Total estimated repair cost · 2 items | $1,000–6,000 |
Value-add ROI direction
- Both paint interior walls — enhances curb appeal and interior aesthetics ↑
- Both replace air conditioning unit — improves comfort and energy efficiency ↑
ⓘ Cost ranges are severity-bucket heuristics (US national rule-of-thumb). Get contractor quotes + a written scope before underwriting a rehab budget.
Schools (NCES district)
- District
- San Juan Unified
- NCES district ID
- 0634620
- Math proficiency
- 40% ▲ 3.00%
- Reading proficiency
- 62% ▲ 16.00%
- Median HH income
- $55,655
- Composite
- 44.07/100
- National rank
- #2878
- State rank
- #138 of 517 in CA
Livability — Citrus Heights
- Score
- 60/100
- State rank
- #614
- US rank
- #19580
Category grades
Schools grade is shown separately in the Schools card above.
Census & demographics
- Census place
- Citrus Heights, CA
- County
- Sacramento County · 1,539,646 people
- City population
- 89,370
- Metro
- Sacramento-Roseville-Folsom, CA
- Population (ZIP)
- 42,442
- Household income
- $80,901
- Rent vs Own
- Severe rent burden
- 1854.0
Population outlook (Sacramento County) Hauer SSP2
- Today (2025)
- 1,660,763 people
- By 2030
- 1,732,990 · +4.3%
- By 2040
- 1,855,755 · +11.7%
- By 2050
- 1,941,335 · +16.9%
- By 2075
- 2,046,162 · +23.2%
- By 2100
- 1,961,444 · +18.1%
Race, ethnicity, and origin ACS 2023
- Neighborhood character
- Predominantly White (66%)
- Race & ethnicity
- White 66% Hispanic / Latino 19% Two or more races 11% Asian 6% Black 2%
- Hispanic origin (detail)
- Mexican 16%
- Common ancestry
- Subsaharan African 3% Lithuanian 3% Scotch-Irish 2%
- Foreign-born
- 15% · Canada, Vietnam
- Languages at home
- 78% English-only · Spanish 10% Russian/Polish/Slavic 6% Other Indo-European 3%
Political lean MEDSL · Sacramento
- 2024 margin
- D (+19.7) · D 58.1% · R 38.4% · Other 3.5%
- 2008→2024 swing
- +0.7pp no change · 2008: 19.0pp · 2024: 19.7pp
- All cycles
- 2024: D+19.7 2020: D+25.3 2016: D+23.7 2012: D+16.3 2008: D+19.0
Not yet ingested
- Civics
- —
Market trends
- HPI YoY
- ▼ -408.14%
- Current HPI
- 351.9333
- Rent YoY
- ▲ 1.90%
- Metro
- Sacramento-Roseville-Folsom, CA
- State GDP YoY
- ▲ 3.21%
- F500 in state
- 116
Industry mix (Fortune 500 HQ in CA)
| Industry | F500 HQs | Revenue |
|---|---|---|
| Technology | 27 | $1,492B |
|
||
| Financial Services | 3 | $174B |
|
||
| Retail | 3 | $44B |
|
||
| Insurance | 3 | $26B |
|
||
| Media / Entertainment | 2 | $115B |
|
||
| Pharmaceuticals / Biotech | 2 | $62B |
|
||
Cash-flow waterfall
monthlySold comps — $/sqft
last 12 mo · ≤1 miLoading sold comps…