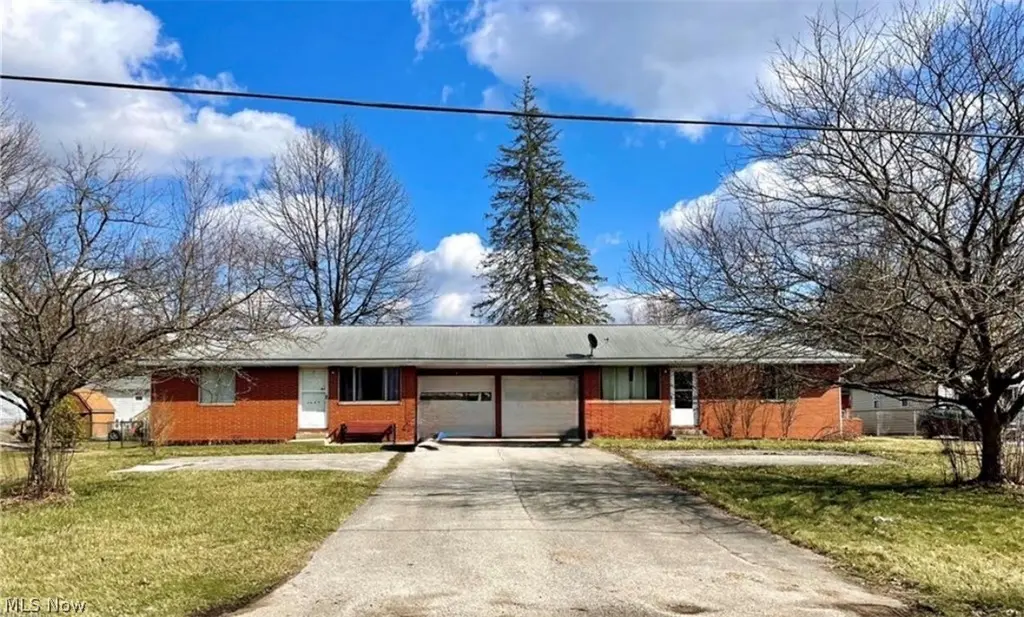
 Duplex
8974-8978 Wilverne Dr · Windham, OH
Flood risk 1/10 · Minimal
- FEMA flood zone
- X (unshaded)
- Chance of flooding over 30 yrs
- 0.0%
- Est. flood insurance / yr
- $507 – $1,088
Fire risk 1/10 · Minimal
- Est. fire insurance / yr
- $713 – $1,323
Heat risk 3/10 · Minor
- Hot days now (above 97°F)
- 7 days/yr
- Hot days in 30 yrs
- 18 days/yr
Wind risk 1/10 · Minimal
- Chance of severe wind over 30 yrs
- —
Air-quality risk 3/10 · Minor
- Unhealthy air days now
- 1 days/yr
- Unhealthy air days in 30 yrs
- 4 days/yr
Risk factors via First Street. Map © Google.
Why this score? — see what drove the C- grade
The composite is a weighted blend of 9 inputs, each scored 0–100. Each bar is that input's sub-score; the figure is the points it added to the 100-point composite (weight × sub-score).
- Cash flow +25.4/30.0
- DSCR +8.4/10.0
- 1% rule +6.7/10.0
- ARV discount +3.3/15.0
- Livability +3.1/5.0
- Schools +2.9/10.0
- Rent growth +2.5/5.0
- Condition / age +2.5/5.0
- Appreciation +0.0/10.0
$175,000
🖨 Deal sheet (PDF) 📄 Offer letter ✓ Due diligence
Multi-family units
County records classify this as Multi-Family (2-4 Unit). Listing-text estimate: 2 units. confirmed
Listing remarks MLS
Very Nice Brick Duplex With Central Air. One Car Garage In Each Unit. Great Location. Good Rental History. Newer Flooring 3 Yrs. Great Investment.
Key facts
- Income potential
- Large shared yard
- 0.34 acre lot
Tags
Property features AI
Finance
- Financial info: Gross rental income reported: $1,000; Each unit actual rent: $500; Current tenants are month-to-month; Units are leased (leases expire June 30, 2026 for listed units); Owner pays taxes; tenants pay all utilities
Exterior
- Parking: Attached 2-car garage; Asphalt driveway
- Utilities: Public water; Public sewer
- Home design: Single-story building; Brick construction; Asphalt roof; Private entrance
- Construction: Brick exterior; Asphalt roof; Crawl space foundation; Built (year source: public records)
- Exterior features: Back yard; Chain link fencing; City lot
Interior
- Kitchen: Eat-in kitchen (appliances not specified)
- Bedrooms: Two 2-bedroom units (each unit is month-to-month)
- Bathrooms: Two full bathrooms total (one full bathroom per unit)
- Heating & cooling: Central air conditioning; Ceiling fans; Forced air heating; Gas heating
- Interior features: Ceiling fan(s); Eat-in kitchen; Private entrance; Crawl space basement
- Laundry & utility: In-unit laundry (inside)
Neighborhood map
What this means for you Summary
Snapshot
- This is a 2 × 2-bed/?-bath units multifamily listed at $175k.
Deal economics
- At list price, monthly cash flow is $405 ($5k/yr) — positive. Per door: $203/mo.
- The deal already cash-flows at list — no discount required.
- Meets the 1% rule at list price ($2k rent vs $175k).
- Recommended offer: $170k (3.0% below list) — sets the bar for market timing.
Location & tenants
- Location reads 62/100 on livability (#886 in OH) — a middle-class / working-renter tenant base. Strengths: cost of living A+, housing A+, crime A; Watch: amenities F, commute F, employment F.
- Windham Exempted Village (town): math 27% / reading 43% proficiency, ranked #564 of 656 in OH (top 86%) — families likely to look elsewhere, expect single-tenant / working-renter base with shorter leases; 68% free/reduced lunch — lower-income household profile, screen leases tightly.
- Zoned schools: Katherine Thomas Elementary School (math 37% / reading 42%, grade F, #1,055 of 1,584 statewide, top 68%, 223 students, 0% FRL); Windham Junior High School (math 22% / reading 47%, grade F, #547 of 654 statewide, top 84%, 130 students, 0% FRL); Windham High School (math 24% / reading 34%, grade F, #619 of 781 statewide, top 80%, 109 students, 0% FRL) — zoned schools average 0% FRL vs 68% district-wide (68 pts lower); this property's tenant base skews higher-income than the district average.
- Market conditions: 17 active listings in the ZIP; 196 units permitted in Portage County in 2024 (10 in 5+ unit buildings).
- This rent runs 38% of the median local income ($65k/yr) — at the standard rent-burdened threshold; future hikes will face affordability resistance.
Forward outlook
- Local home prices are declining (-3.0%/yr); year-one equity from $1k of loan paydown is wiped out by about $5k of value loss. Plan a longer hold.
Negotiation context
- It's been on market 43 days — a 3% lower offer ($170k) is reasonable based on typical stale-listing flexibility.
- 2 sale attempts since 29y ago with the ask held roughly flat each time — persistent listings suggest the price (not the market) is what's stuck; bring a comps-based counter.
- Current owner paid $88k; list at $175k implies a 100% gain — meaningful room to come down on a strong offer.
Questions for the listing agent
- It's been on market 43 days. Have you received any prior offers? Is the seller open to a 3% concession, seller financing, or rate buy-down credit?
- Can we see the unit-by-unit rent roll, current vacancy, and any below-market leases? What's the average tenancy length?
- What capital expenditures (roof, boiler, parking lot, exteriors) have been made in the last 5 years, and what's planned in the next 2?
- Built in 1965 — when were the roof, HVAC, electrical panel, plumbing, and water heater last replaced?
- Is there a deadline driving the sale (1031 exchange, divorce, estate, relocation)? That informs how much negotiation room exists.
- What's the average days-on-market for RENTAL listings here right now (not sales)? A rising rental-DOM trend means longer vacancies and softer asking-rent achievability than the comps imply.
- What's the recent tenant-quality profile in this submarket — average credit score on applications, eviction rate, late-payment / NSF rate, and stable-employment percentage? A property-management company in the area should have these aggregated.
- How much new apartment / multifamily construction is in the pipeline within 1–3 miles? Heavy new supply (>2% of stock underway) typically softens rents 12–24 months out; light construction supports rent growth.
Investment metrics
- 1% rule
- 1.17% ✓
- Cap rate
- 9.07%
- Cash-on-cash
- 9.93%
- DSCR
- 1.44
- GRM
- 7.1
CMA / ARV
- ARV (on-the-fly)
- $160,000
- Comps found
- 1
Show comp detail 1 sale within ~0.75 mi
| Address | Dist | Beds/Ba | Sqft | Sold | Price | $/sf | Match |
|---|---|---|---|---|---|---|---|
| 8974-8978 Wilverne Dr | 0.00mi | 4/2.0 | 1,600 (0%) | 1mo | $160,000 | $100 | 99 |
Match score weights: distance 35% · size 25% · config 20% · recency 20%. Top-matched comps best support the ARV.
Projected returns pro-forma
-3.0% appreciation · 3.0% rent growth · sell at horizon
- IRR
- -1.4%
- Equity multiple
- 0.95×
- Total profit
- $-2,508
- Equity at exit
- $26,093
- IRR
- 8.3%
- Equity multiple
- 1.64×
- Total profit
- $31,187
- Equity at exit
- $15,131
Cash invested: $49,000 (down + closing). Projections, not guarantees.
Landlord ↔ Tenant lean methodology
- Overall (STATE)
- 73 Landlord-Friendly
- State Ohio
- 73 Landlord-Friendly · R+6
- County
- — inherits STATE
- City
- — inherits STATE
ZIP-level market 44288
- Home prices YoY
- -22.1%
- Active inventory
- 17
- Price-to-rent
- 14.3×
Monthly cashflow live
- Estimated rent
- $2,044 medium interval (Pro) →
- Mortgage (P&I)
- −$918
- Tax est. 1.5%
- −$219 /mo · $2,625/yr
- Insurance
- −$73
- HOA
- −$0
- Vacancy / Maint / Mgmt
- −$429
- Net cashflow
- $405
Break-even live
Sensitivity live
| Price | -10% $526 | -5% $466 | +0% $405 | +5% $345 | +10% $284 |
|---|---|---|---|---|---|
| Rent | -10% $244 | -5% $325 | +0% $405 | +5% $486 | +10% $567 |
| Rate | -1.0pp $494 | -0.5pp $450 | base $405 | +0.5pp $360 | +1.0pp $314 |
2-unit breakdown (identical units grouped — click to expand)
| Units | Beds | Baths | Est. rent |
|---|---|---|---|
| 2× units | 2 | — | $2,044 |
| #1 | 2 | — | $1,022 |
| #2 | 2 | — | $1,022 |
| Total (2 units) | $2,044 | ||
UW: 25.0% down · 7.5% · 30yr · 1.5% tax · 5.0% vac · 8.0% maint · 8.0% mgmt
Financing live
Cash to close
- Down payment
- $43,750
- Closing costs
- $5,250
- Reserves months
- —
- Total cash needed
- —
Loan-product check · same deal, 3 products live
Conventional
25% down · 7.5% · 30yr
- Down + closing
- —
- Monthly P&I
- —
- Monthly cashflow
- —
- DSCR
- —
- Eligible?
- —
Personal DTI + credit; lowest rate.
DSCR
20% down · 8.5% · 30yr
- Down + closing
- —
- Monthly P&I
- —
- Monthly cashflow
- —
- DSCR
- —
- Eligible?
- —
No personal income docs; deal must DSCR.
Hard money
10% down · 12.0% · 12mo
- Down + closing
- —
- Monthly P&I
- —
- Monthly cashflow
- —
- DSCR
- —
- Eligible?
- —
Short-term bridge; refi at stabilization.
Listing history 5 events
-
2026-05-11status Pending
-
2026-04-24historical Contingent
-
2026-03-27$175,000 Active
-
1997-09-17soldstatus $87,500 146-char remark
Show marketing remark (146 chars)
Very Nice Brick Duplex With Central Air. One Car Garage In Each Unit. Great Location. Good Rental History. Newer Flooring 3 Yrs. Great Investment.
-
1997-06-29$95,000 146-char remark
Show marketing remark (146 chars)
Very Nice Brick Duplex With Central Air. One Car Garage In Each Unit. Great Location. Good Rental History. Newer Flooring 3 Yrs. Great Investment.
ⓘ Source: listings_history table (triggers on properties + properties_extension) + one-shot
backfill from property_details.listing_events for pre-trigger history.
Climate risk First Street
- Flood 1/10 Low FEMA zone X (unshaded) · 0% chance over 30 yrs
- Wildfire 1/10 Low
- Heat 3/10 Moderate 7 d/yr ≥97°F today · 18 d/yr by 30 yrs out
- Wind 1/10 Low
- Air quality 3/10 Moderate 1 unhealthy d/yr today · 4 by 30 yrs out
Nearby sold comps map
Loading sold comps map…
Walkable amenities ~0.75 mi
Loading nearby amenities…
Taxation est. · year 1
- Rental income
- $24,528
- − Mortgage interest
- −$9,803
- − Property taxes
- −$2,625
- − Insurance
- −$875
- − Repairs & maintenance
- −$1,962
- − Management
- −$1,962
- − Depreciation
- −$5,091
- Taxable income
- $2,210
- Est. tax owed @ 24.0%
- −$530
- After-tax cash flow
- $4,334/yr
For passive investors: Depreciation is non-cash, so a rental often shows a tax loss while cash-flowing — sheltering income. Rental losses are passive: they offset passive income freely, and up to $25,000/yr can offset ordinary (W-2) income if you actively participate and your MAGI is under $100k (phasing out to $0 by $150k); unused losses carry forward. On sale, claimed depreciation is recaptured at up to 25%, and gains may owe capital-gains tax (a 1031 exchange can defer both). Figures are a year-1 estimate at your 24.0% rate — not tax advice; consult a CPA.
Schools (NCES district)
- District
- Windham Exempted Village
- NCES district ID
- 3904566
- Math proficiency
- 27% ▼ -27.00%
- Reading proficiency
- 43% ▼ -9.00%
- Median HH income
- $40,882
- Composite
- 29.42/100
- National rank
- #6522
- State rank
- #564 of 656 in OH
Livability — Windham
- Score
- 62/100
- State rank
- #886
- US rank
- #16824
Category grades
Schools grade is shown separately in the Schools card above.
Census & demographics
- Census place
- Windham, OH
- County
- Portage · 165,699 people
- Metro
- Akron, OH
- Population (ZIP)
- 3,555
- Household income
- $65,147
- Rent vs Own
- Severe rent burden
- 12.9
Population outlook (Portage County) Hauer SSP2
- Today (2025)
- 166,109 people
- By 2030
- 167,752 · +1.0%
- By 2040
- 168,640 · +1.5%
- By 2050
- 167,469 · +0.8%
- By 2075
- 170,131 · +2.4%
- By 2100
- 167,958 · +1.1%
Race, ethnicity, and origin ACS 2023
- Neighborhood character
- Predominantly White (89%)
- Race & ethnicity
- White 89% Two or more races 8% Hispanic / Latino 3% Black 3%
- Common ancestry
- Romanian 5% Iranian 1% Scotch-Irish 1%
- Foreign-born
- 0%
Political lean MEDSL · Portage
- 2024 margin
- R (+15.5) · D 41.8% · R 57.3%
- 2008→2024 swing
- -24.5pp toward R · 2008: 9.0pp · 2024: -15.5pp
- All cycles
- 2024: R+15.5 2020: R+12.5 2016: R+10.2 2012: D+4.9 2008: D+9.0
Not yet ingested
- Civics
- —
Market trends
- HPI YoY
- ▼ -49.36%
- Current HPI
- 173.5838
- Rent YoY
- —
- Metro
- —
- State GDP YoY
- ▲ 1.98%
- F500 in state
- 48
Industry mix (Fortune 500 HQ in OH)
| Industry | F500 HQs | Revenue |
|---|---|---|
| Insurance | 3 | $145B |
|
||
| Industrial Machinery | 3 | $49B |
|
||
| Financial Services | 3 | $24B |
|
||
| Consumer Goods | 2 | $93B |
|
||
| Aerospace / Defense | 2 | $47B |
|
||
| Utilities | 2 | $33B |
|
||
Price history
+84.2% since first listed5 events — show timeline
- 2026-05-11 Pending — MLSNOW
- 2026-04-24 Contingent — MLSNOW
- 2026-03-27 Listed $175,000 MLSNOW
- 1997-09-17 Sold (MLS) $87,500 MLSNOW
- 1997-06-29 Listed $95,000 MLSNOW
Cash-flow waterfall
monthlySold comps — $/sqft
last 12 mo · ≤1 miLoading sold comps…