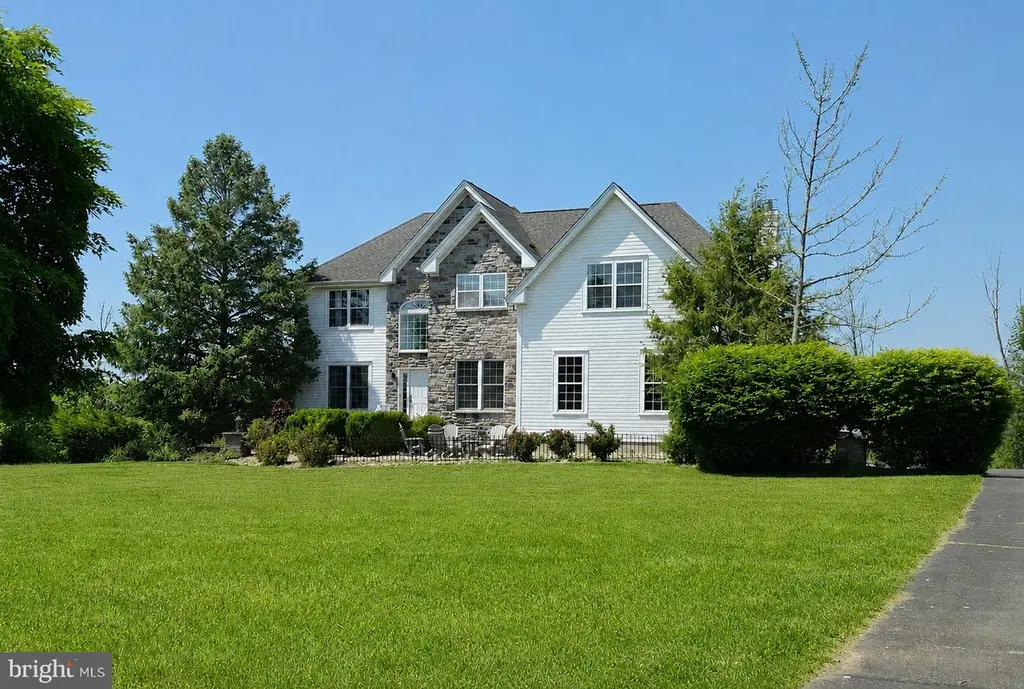
32 Ferris Wheel Dr · West Amwell, NJ
Flood risk 1/10 · Minimal
- FEMA flood zone
- X (unshaded)
- Chance of flooding over 30 yrs
- 0.0%
- Est. flood insurance / yr
- $507 – $1,088
Fire risk 3/10 · Minor
- Est. fire insurance / yr
- $526 – $976
Heat risk 5/10 · Moderate
- Hot days now (above 101°F)
- 7 days/yr
- Hot days in 30 yrs
- 15 days/yr
Wind risk 6/10 · Moderate
- Chance of severe wind over 30 yrs
- 27.0%
Air-quality risk 3/10 · Minor
- Unhealthy air days now
- 2 days/yr
- Unhealthy air days in 30 yrs
- 3 days/yr
Risk factors via First Street. Map © Google.
Why this score? — see what drove the C+ grade
The composite is a weighted blend of 9 inputs, each scored 0–100. Each bar is that input's sub-score; the figure is the points it added to the 100-point composite (weight × sub-score).
- Cash flow +30.0/30.0
- 1% rule +10.0/10.0
- DSCR +10.0/10.0
- Schools +2.8/10.0
- Rent growth +2.5/5.0
- Livability +2.5/5.0
- Condition / age +2.5/5.0
- ARV discount +0.0/15.0
- Appreciation +0.0/10.0
$925,000
🖨 Deal sheet (PDF) 📄 Offer letter ✓ Due diligence
Listing remarks MLS
None
Key facts
- 1 acre lot
- 2 garage spots
- Built 2002
Property features AI
Exterior
- Parking: Attached side-entry garage with inside access and garage door opener; Two garage spaces; Asphalt driveway
- Utilities: Public water; On-site septic; Electric cooling; Natural gas for heating and hot water
- Home design: Detached single-family home; Built by CENTEX
- Construction: Aluminum siding and stone exterior; Block foundation
- Exterior features: Deck(s); Patio(s); Porch(es); Shed; Not in a federal flood zone
Interior
- Kitchen: Double oven; Dishwasher; Built-in microwave; Cooktop; Refrigerator; Kitchen island; Eat-in kitchen
- Bedrooms: Four bedrooms on the upper level
- Bathrooms: Two full bathrooms; One half bathroom on the main level
- Heating & cooling: Forced air heating (natural gas); Central air conditioning (electric); Natural gas hot water
- Interior features: Eat-in kitchen; Recessed lighting; Ceiling fans; Curved staircase; Upgraded countertops; Sprinkler system; Kitchen island; Formal separate dining room; Walk-in shower in bathroom; Soaking tub; Tub/shower combination; Additional stairway; Cathedral ceilings
- Laundry & utility: Washer and dryer included; Main floor laundry
Neighborhood map
What this means for you Summary
Snapshot
- This is a 4-bed/2.5-bath single-family listed at $925k.
Deal economics
- At list price, monthly cash flow is $13k ($159k/yr) — positive.
- The deal already cash-flows at list — no discount required.
- Meets the 1% rule at list price ($25k rent vs $925k).
Location & tenants
- Location reads: area grade C — affects rentability + tenant quality, not the cash-flow math above.
- South Hunterdon Regional School District (rural): math 13% / reading 43% proficiency, ranked #335 of 472 in NJ (top 71%) — low school quality limits family demand, transient renter base, plan for 1-2y turnover; only 14% free/reduced lunch — higher-income household profile.
- Market conditions: 52 active listings in the ZIP; 1 comparable units currently listed for rent nearby; 389 units permitted in Hunterdon County in 2024 (180 in 5+ unit buildings).
Forward outlook
- Local home prices are declining (-3.0%/yr); year-one equity from $6k of loan paydown is wiped out by about $28k of value loss. Plan a longer hold.
- Hunterdon County population projected to shrink 8% by 2050 — rents likely to lag national; underwrite the cash flow, not the appreciation.
- At projected returns (-3.0% appreciation + 3.0% rent growth), your $259k cash investment doubles in ~2 years — after that, you're playing with house money.
Negotiation context
- Only 3 days on market — expect competitive offers; lowballing is unlikely to land.
- 2 sale attempts since 12y ago; this cycle's ask is 61% above the opening price — seller raised mid-cycle; expect resistance to lowballs.
- Current owner paid $562k; list at $925k implies a 64% gain — meaningful room to come down on a strong offer.
Risks & watch-outs
- Climate carrying-cost: major wind risk, 27% chance of damaging wind over 30y; extreme-heat days projected 7→15/yr by 2055 (HVAC capex compounding) — expect insurance premiums to compound above CPI over the hold.
Questions for the listing agent
- Is there a deadline driving the sale (1031 exchange, divorce, estate, relocation)? That informs how much negotiation room exists.
- What's the average days-on-market for RENTAL listings here right now (not sales)? A rising rental-DOM trend means longer vacancies and softer asking-rent achievability than the comps imply.
- What's the recent tenant-quality profile in this submarket — average credit score on applications, eviction rate, late-payment / NSF rate, and stable-employment percentage? A property-management company in the area should have these aggregated.
- How much new for-sale + rental construction is in the pipeline within 1–3 miles? Heavy new supply typically softens prices + rents 12–24 months out; constrained supply supports both.
Investment metrics
- 1% rule
- 2.71% ✓
- Cap rate
- 23.50%
- Cash-on-cash
- 61.45%
- DSCR
- 3.73
- GRM
- 3.1
CMA / ARV
- ARV (on-the-fly)
- $748,064
- Comps found
- 3
Show comp detail 3 sales within ~0.75 mi
| Address | Dist | Beds/Ba | Sqft | Sold | Price | $/sf | Match |
|---|---|---|---|---|---|---|---|
| 4 Culture Ct | 0.24mi | 4/2.5 | 3,211 (+3%) | 13mo | $793,000 | $247 | 72 |
| 247 N Main St | 0.74mi | 3/2.0 (-1) | 3,270 (+5%) | 2mo | $740,000 | $226 | 48 |
| 2 Allen St | 0.72mi | 4/3.0 | 2,756 (-11%) | 6mo | $664,500 | $241 | 41 |
Match score weights: distance 35% · size 25% · config 20% · recency 20%. Top-matched comps best support the ARV.
Projected returns pro-forma
-3.0% appreciation · 3.0% rent growth · sell at horizon
- IRR
- 60.3%
- Equity multiple
- 3.68×
- Total profit
- $695,281
- Equity at exit
- $137,921
- IRR
- 65.0%
- Equity multiple
- 7.54×
- Total profit
- $1,695,081
- Equity at exit
- $79,977
Cash invested: $259,000 (down + closing). Projections, not guarantees.
Landlord ↔ Tenant lean methodology
- Overall (STATE)
- 21 Tenant-Leaning
- State New Jersey
- 21 Tenant-Leaning · D+6
- County
- — inherits STATE
- City
- — inherits STATE
ZIP-level market 08530
- Active inventory
- 52
- Price-to-rent
- 3.1×
Monthly cashflow live
- Estimated rent
- $25,101 medium interval (Pro) →
- Mortgage (P&I)
- −$4,851
- Tax from tax record
- −$1,331 /mo · $15,975/yr
- Insurance
- −$385
- HOA
- −$0
- Vacancy / Maint / Mgmt
- −$5,271
- Net cashflow
- $13,262
Break-even live
Sensitivity live
| Price | -10% $13,786 | -5% $13,524 | +0% $13,262 | +5% $13,001 | +10% $12,739 |
|---|---|---|---|---|---|
| Rent | -10% $11,279 | -5% $12,271 | +0% $13,262 | +5% $14,254 | +10% $15,245 |
| Rate | -1.0pp $13,728 | -0.5pp $13,498 | base $13,262 | +0.5pp $13,023 | +1.0pp $12,779 |
UW: 25.0% down · 7.5% · 30yr · 1.5% tax · 5.0% vac · 8.0% maint · 8.0% mgmt
Financing live
Cash to close
- Down payment
- $231,250
- Closing costs
- $27,750
- Reserves months
- —
- Total cash needed
- —
Loan-product check · same deal, 3 products live
Conventional
25% down · 7.5% · 30yr
- Down + closing
- —
- Monthly P&I
- —
- Monthly cashflow
- —
- DSCR
- —
- Eligible?
- —
Personal DTI + credit; lowest rate.
DSCR
20% down · 8.5% · 30yr
- Down + closing
- —
- Monthly P&I
- —
- Monthly cashflow
- —
- DSCR
- —
- Eligible?
- —
No personal income docs; deal must DSCR.
Hard money
10% down · 12.0% · 12mo
- Down + closing
- —
- Monthly P&I
- —
- Monthly cashflow
- —
- DSCR
- —
- Eligible?
- —
Short-term bridge; refi at stabilization.
Rent comps 1 comps
| Address | Beds | Baths | Sqft | Rent | $/sqft | DOM | Units | Dist |
|---|---|---|---|---|---|---|---|---|
| 9 Arnett Ave Unit 1380124P Lambertville, NJ | 4.0 | 2.0 | 2497 | $25,101 | $10.05 | 44d | 1 | 0.78mi |
Listing history 7 events
-
2026-06-18days on market $925,000 Active 3 DOM
-
2026-06-17days on market $925,000 Active 2 DOM
-
2026-06-16statusdays on market $925,000 Active 1 DOM
-
2026-06-15days on market $925,000 Coming Soon 7 DOM
-
2026-06-13days on market $925,000 Coming Soon 5 DOM
-
2026-06-09remarks 692-char remark
-
2026-06-09$925,000 Coming Soon 1 DOM
ⓘ Source: listings_history table (triggers on properties + properties_extension) + one-shot
backfill from property_details.listing_events for pre-trigger history.
Tax reassessment forecast NJ · Partial reset (capped growth)
- Current annual tax
- $15,975 · $1,331/mo
- Projected year-2 tax
- $19,504 · $1,625/mo
- Expected delta
- +$3,529/yr (+$294/mo · 22.1%)
ⓘ Screening estimate from a state-policy table — verify with the county assessor before closing.
Climate risk First Street
- Flood 1/10 Low FEMA zone X (unshaded) · 0% chance over 30 yrs
- Wildfire 3/10 Moderate
- Heat 5/10 Major 7 d/yr ≥101°F today · 15 d/yr by 30 yrs out
- Wind 6/10 Major 27% chance of damaging wind over 30 yrs
- Air quality 3/10 Moderate 2 unhealthy d/yr today · 3 by 30 yrs out
Nearby sold comps map
Loading sold comps map…
Walkable amenities ~0.75 mi
Loading nearby amenities…
Taxation est. · year 1
- Rental income
- $301,212
- − Mortgage interest
- −$51,814
- − Property taxes
- −$15,975
- − Insurance
- −$4,625
- − Repairs & maintenance
- −$24,097
- − Management
- −$24,097
- − Depreciation
- −$26,909
- Taxable income
- $153,695
- Est. tax owed @ 24.0%
- −$36,887
- After-tax cash flow
- $122,261/yr
For passive investors: Depreciation is non-cash, so a rental often shows a tax loss while cash-flowing — sheltering income. Rental losses are passive: they offset passive income freely, and up to $25,000/yr can offset ordinary (W-2) income if you actively participate and your MAGI is under $100k (phasing out to $0 by $150k); unused losses carry forward. On sale, claimed depreciation is recaptured at up to 25%, and gains may owe capital-gains tax (a 1031 exchange can defer both). Figures are a year-1 estimate at your 24.0% rate — not tax advice; consult a CPA.
Schools (NCES district)
- District
- South Hunterdon Regional School District
- NCES district ID
- 3400769
- Math proficiency
- 13% ▼ -27.00%
- Reading proficiency
- 43% ▼ -17.00%
- Median HH income
- $82,621
- Composite
- 27.54/100
- National rank
- #6948
- State rank
- #335 of 472 in NJ
Livability — West Amwell
No livability data for this city. (Only ~50 U.S. cities are tracked.)
Census & demographics
- Population (ZIP)
- 8,146
Population outlook (Hunterdon County) Hauer SSP2
- Today (2025)
- 122,644 people
- By 2030
- 121,131 · -1.2%
- By 2040
- 117,753 · -4.0%
- By 2050
- 112,601 · -8.2%
- By 2075
- 104,371 · -14.9%
- By 2100
- 93,364 · -23.9%
Race, ethnicity, and origin ACS 2023
- Neighborhood character
- Predominantly White (83%)
- Race & ethnicity
- White 83% Hispanic / Latino 8% Two or more races 8% Black 5% Asian 1%
- Hispanic origin (detail)
- Mexican 4% Puerto Rican 1%
- Common ancestry
- Romanian 6% Iranian 2% Serbian 1%
- Foreign-born
- 10% · Canada, China
- Languages at home
- 91% English-only · Spanish 4% Other Indo-European 2% Chinese 1%
Political lean MEDSL · Hunterdon
- 2024 margin
- Lean R (+6.7) · D 45.7% · R 52.4% · Other 1.9%
- 2008→2024 swing
- +6.7pp toward D · 2008: -13.3pp · 2024: -6.7pp
- All cycles
- 2024: R+6.7 2020: R+4.4 2016: R+13.8 2012: R+18.8 2008: R+13.3
Not yet ingested
- Civics
- —
Market trends
- HPI YoY
- ▼ -193.68%
- Current HPI
- 226.5618
- Rent YoY
- —
- Metro
- —
- State GDP YoY
- ▲ 2.05%
- F500 in state
- 34
Industry mix (Fortune 500 HQ in NJ)
| Industry | F500 HQs | Revenue |
|---|---|---|
| Consumer Goods | 3 | $31B |
|
||
| Pharmaceuticals | 2 | $153B |
|
||
| Technology | 2 | $21B |
|
||
| Insurance | 2 | $20B |
|
||
| Healthcare | 2 | $19B |
|
||
| Financial Services | 1 | $70B |
|
||
Price history
+60.9% since first listed8 events — show timeline
- 2026-06-08 Coming Soon $925,000 BRIGHT MLS
- 2015-03-16 Sold (Public Records) $562,500 Public Records
- 2015-03-06 Sold (MLS) $562,500 GSMLS
- 2015-03-06 Sold (MLS) $562,500 TREND
- 2015-03-06 Sold (MLS) $562,500 BRIGHT MLS
- 2015-01-02 Listing Removed — BRIGHT MLS
- 2014-06-02 Listed $575,000 TREND
- 2014-06-02 Listed $575,000 BRIGHT MLS
Property tax history
+2.3%/yrLatest (2025): $15,975 · +2.1% YoY. Source: county tax records.
Cash-flow waterfall
monthlySold comps — $/sqft
last 12 mo · ≤1 miLoading sold comps…