1200 Jean Pl SE · Rio Rancho, NM
Flood risk 1/10 · Minimal
- FEMA flood zone
- X (unshaded)
- Chance of flooding over 30 yrs
- 0.0%
- Est. flood insurance / yr
- $507 – $1,088
Fire risk 3/10 · Minor
- Est. fire insurance / yr
- $706 – $1,312
Heat risk 5/10 · Moderate
- Hot days now (above 95°F)
- 7 days/yr
- Hot days in 30 yrs
- 19 days/yr
Wind risk 1/10 · Minimal
- Chance of severe wind over 30 yrs
- —
Air-quality risk 3/10 · Minor
- Unhealthy air days now
- 3 days/yr
- Unhealthy air days in 30 yrs
- 4 days/yr
Risk factors via First Street. Map © Google.
Why this score? — see what drove the D+ grade
The composite is a weighted blend of 9 inputs, each scored 0–100. Each bar is that input's sub-score; the figure is the points it added to the 100-point composite (weight × sub-score).
- Cash flow +13.8/30.0
- ARV discount +12.3/15.0
- Schools +5.2/10.0
- DSCR +4.2/10.0
- Livability +3.6/5.0
- Rent growth +3.3/5.0
- 1% rule +2.8/10.0
- Condition / age +2.5/5.0
- Appreciation +0.0/10.0
$313,000
🖨 Deal sheet (PDF) 📄 Offer letter ✓ Due diligence
Listing remarks
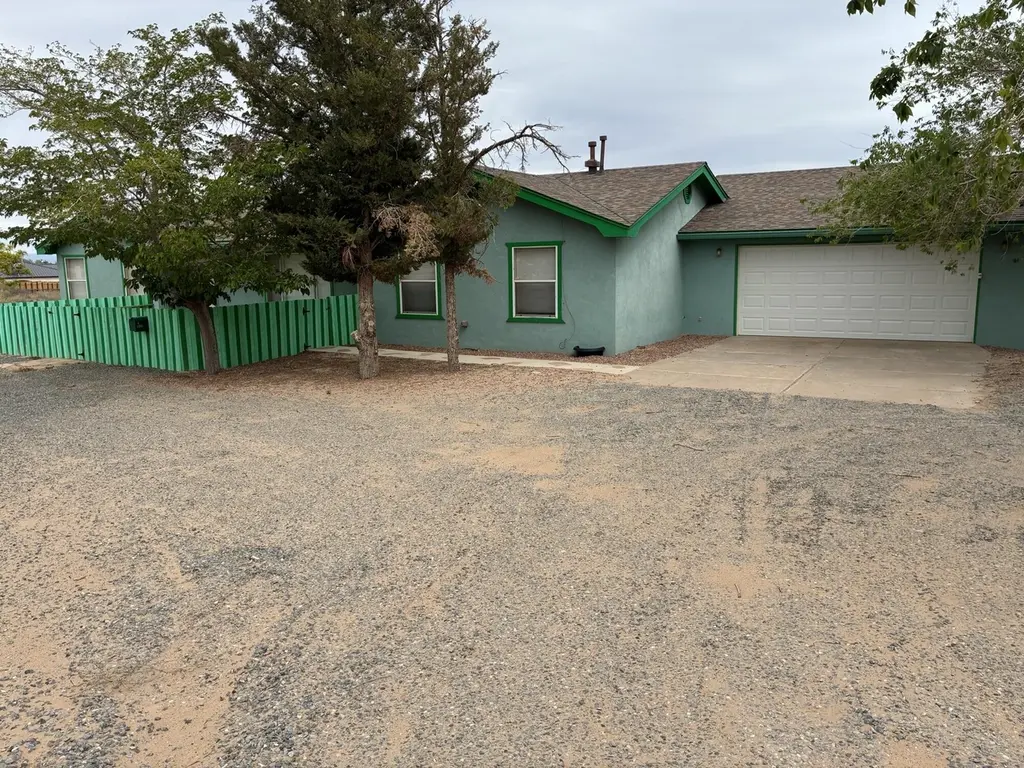
Must see!! Priced to sell!! 3 bedroom, possible 4 or office, 2 bath home on 1.1 acre lot. Home contains a sunroom for plants and a spacious garage. Property also contains large storage rooms. Conveniently located near schools, shopping, etc.
Key facts
- Sunroom
- Storage rooms
- Acre lot
Tags
Property features AI
Exterior
- Parking: Attached garage (2 spaces)
- Utilities: Electricity connected; Private well water; Septic tank
- Home design: Single-story; Southwest-facing
- Construction: Frame and stucco construction; Shingle roof
- Exterior features: Private yard; Back yard fencing; Corner lot; City street frontage; Gravel road surface; Faces southwest; Raised foundation; Resale condition
Interior
- Flooring: Carpet; Vinyl
- Bathrooms: 2 full bathrooms
- Heating & cooling: Central electric heating; Evaporative cooling
- Interior features: Multiple living areas; Main level primary; Sliding windows
- Laundry & utility: Electric dryer hookup
Neighborhood map
What this means for you Summary
Snapshot
- This is a 3-bed/2.0-bath single-family listed at $313k.
Deal economics
- At list price, monthly cash flow is $29 ($352/yr) — positive.
- The deal already cash-flows at list — no discount required.
- To meet the 1% rule (rent ≥ 1% of price), the offer needs to be $245k (21.7% below list).
- Recommended offer: $245k (21.7% below list) — sets the bar for 1% rule.
- Cap rate 6.4% vs local median 3.6% in Rio Rancho — top-decile yield for the area; either an underpriced asset or a hidden risk that comps aren't pricing in. Stress-test before assuming the spread holds.
Location & tenants
- Location reads 71/100 on livability (#17 in NM) — a middle-class / working-renter tenant base. Strengths: housing A+, cost of living A; Watch: amenities D, commute F.
- Rio Rancho Public Schools (suburban): math 48% / reading 73% proficiency, ranked #4 of 29 in NM (top 14%) — acceptable for families but not a draw, mixed tenant base, ~2y average lease.
- Zoned schools: Maggie Cordova Elementary School (674 students, 100% FRL); Lincoln Middle (823 students, 21% FRL); Rio Rancho High (math 52% / reading 77%, grade B-, #22 of 110 statewide, top 22%, 2,573 students, 22% FRL).
- Market conditions: Rents rising (+3.1%/yr); 837 active listings in the ZIP; 6 comparable units currently listed for rent nearby; rentals lingering (median 46d on market — plan ~5-8 weeks vacancy on turnover, expect pricing pressure); 50% of comp listings sitting > 30 days — soft ceiling on asking rent; solid renter incomes; 1,278 units permitted in Sandoval County in 2024 (216 in 5+ unit buildings).
- This rent runs 34% of the median local income ($87k/yr) — at the standard rent-burdened threshold; future hikes will face affordability resistance.
Forward outlook
- Local home prices are declining (-3.0%/yr); year-one equity from $2k of loan paydown is wiped out by about $9k of value loss. Plan a longer hold.
- Sandoval County population projected at +15% by 2050 — long-run rental-demand tailwind backs the buy-and-hold thesis.
Negotiation context
- Only 8 days on market — expect competitive offers; lowballing is unlikely to land.
- 2 sale attempts since 10y ago with the ask held roughly flat each time — persistent listings suggest the price (not the market) is what's stuck; bring a comps-based counter.
Risks & watch-outs
- Climate carrying-cost: extreme-heat days projected 7→19/yr by 2055 (HVAC capex compounding) — expect insurance premiums to compound above CPI over the hold.
Questions for the listing agent
- Is there a deadline driving the sale (1031 exchange, divorce, estate, relocation)? That informs how much negotiation room exists.
- The area grade is low — what's the realistic commute time and amenity access for the typical tenant pool here? Any planned neighborhood developments (good or bad) we should know about?
- What's the average days-on-market for RENTAL listings here right now (not sales)? A rising rental-DOM trend means longer vacancies and softer asking-rent achievability than the comps imply.
- What's the recent tenant-quality profile in this submarket — average credit score on applications, eviction rate, late-payment / NSF rate, and stable-employment percentage? A property-management company in the area should have these aggregated.
- How much new for-sale + rental construction is in the pipeline within 1–3 miles? Heavy new supply typically softens prices + rents 12–24 months out; constrained supply supports both.
Investment metrics
- 1% rule
- 0.78% ✗
- Cap rate
- 6.41%
- Cash-on-cash
- 0.40%
- DSCR
- 1.02
- GRM
- 10.6
CMA / ARV
- ARV (on-the-fly)
- $350,336
- Comps found
- 12
Show comp detail 12 sales within ~0.75 mi
| Address | Dist | Beds/Ba | Sqft | Sold | Price | $/sf | Match |
|---|---|---|---|---|---|---|---|
| 1365 Kraft Pl SE | 0.27mi | 3/2.0 | 1,464 (-6%) | 5mo | $327,500 | $224 | 73 |
| 832 Monticello Park Dr SE | 0.60mi | 3/2.5 | 1,564 (0%) | 1mo | $369,900 | $237 | 69 |
| 1125 12th St SE | 0.23mi | 3/2.0 | 1,330 (-15%) | 3mo | $329,900 | $248 | 62 |
| 1780 Carin Ct SE | 0.56mi | 3/2.0 | 1,444 (-8%) | 2mo | $299,900 | $208 | 59 |
| 1510 Sandy Lane Ct SE | 0.44mi | 2/1.0 (-1) | 1,471 (-6%) | 2mo | $245,000 | $167 | 59 |
| 1320 Manzanita Ct SE | 0.54mi | 3/2.0 | 1,373 (-12%) | 1mo | $315,000 | $229 | 53 |
| 1330 Sage Brush Ct SE | 0.62mi | 3/2.0 | 1,413 (-10%) | 4mo | $320,000 | $226 | 52 |
| 1674 16th Ave SE | 0.64mi | 3/2.0 | 1,723 (+10%) | 4mo | $399,000 | $232 | 50 |
| 1740 Regency Park Rd SE | 0.65mi | 3/2.0 | 1,734 (+11%) | 4mo | $345,000 | $199 | 48 |
| 795 Ivory Rd SE | 0.54mi | 3/2.5 | 1,798 (+15%) | 2mo | $325,000 | $181 | 46 |
| 1756 Argus Ct SE | 0.71mi | 3/2.0 | 1,716 (+10%) | 5mo | $305,000 | $178 | 46 |
| 1671 Domain Loop SE | 0.66mi | 3/2.0 | 1,340 (-14%) | 3mo | $265,000 | $198 | 43 |
Match score weights: distance 35% · size 25% · config 20% · recency 20%. Top-matched comps best support the ARV.
Projected returns pro-forma
-3.0% appreciation · 3.13% rent growth · sell at horizon
- IRR
- -15.6%
- Equity multiple
- 0.44×
- Total profit
- $-48,651
- Equity at exit
- $46,669
- IRR
- -7.0%
- Equity multiple
- 0.55×
- Total profit
- $-39,126
- Equity at exit
- $27,063
Cash invested: $87,640 (down + closing). Projections, not guarantees.
Landlord ↔ Tenant lean methodology
- Overall (STATE)
- 55 Moderately Landlord-Leaning
- State New Mexico
- 55 Moderately Landlord-Leaning · D+3
- County
- — inherits STATE
- City
- — inherits STATE
ZIP-level market 87124
- Rents YoY
- 3.1%
- Active inventory
- 837
- Price-to-rent
- 10.6×
Monthly cashflow live
- Estimated rent
- $2,452 high interval (Pro) →
- Mortgage (P&I)
- −$1,641
- Tax from tax record
- −$136 /mo · $1,630/yr
- Insurance
- −$130
- HOA
- −$0
- Vacancy / Maint / Mgmt
- −$515
- Net cashflow
- $29
Break-even live
Sensitivity live
| Price | -10% $207 | -5% $118 | +0% $29 | +5% $-59 | +10% $-148 |
|---|---|---|---|---|---|
| Rent | -10% $-164 | -5% $-68 | +0% $29 | +5% $126 | +10% $223 |
| Rate | -1.0pp $187 | -0.5pp $109 | base $29 | +0.5pp $-52 | +1.0pp $-134 |
UW: 25.0% down · 7.5% · 30yr · 1.5% tax · 5.0% vac · 8.0% maint · 8.0% mgmt
Financing live
Cash to close
- Down payment
- $78,250
- Closing costs
- $9,390
- Reserves months
- —
- Total cash needed
- —
Loan-product check · same deal, 3 products live
Conventional
25% down · 7.5% · 30yr
- Down + closing
- —
- Monthly P&I
- —
- Monthly cashflow
- —
- DSCR
- —
- Eligible?
- —
Personal DTI + credit; lowest rate.
DSCR
20% down · 8.5% · 30yr
- Down + closing
- —
- Monthly P&I
- —
- Monthly cashflow
- —
- DSCR
- —
- Eligible?
- —
No personal income docs; deal must DSCR.
Hard money
10% down · 12.0% · 12mo
- Down + closing
- —
- Monthly P&I
- —
- Monthly cashflow
- —
- DSCR
- —
- Eligible?
- —
Short-term bridge; refi at stabilization.
Rent comps 6 comps
| Address | Beds | Baths | Sqft | Rent | $/sqft | DOM | Units | Dist |
|---|---|---|---|---|---|---|---|---|
| 598 Turmalina DR SE Albuquerque, NM | 3.0 | 2.0 | 1440 | $2,375 | $1.65 | 45d | 1 | 0.73mi |
| 2220 Mayapan Rd SE Rio Rancho, NM | 3.0 | 2.0 | 1286 | $1,850 | $1.44 | 12d | 1 | 0.93mi |
| 510 Stallion Rd SE Rio Rancho, NM | 3.0 | 2.0 | 1661 | $1,050 | $0.63 | 21d | 1 | 1.33mi |
| 704 Amatista Loop SE Rio Rancho, NM | 4.0 | 3.0 | 2127 | $3,350 | $1.57 | 45d | 1 | 1.35mi |
| 3205 Tazanita Loop SE Rio Rancho, NM | 4.0 | 3.0 | 2113 | $3,000 | $1.42 | 12d | 1 | 1.37mi |
| 896 Tazanita Loop SE Rio Rancho, NM | 3.0 | 2.0 | 1564 | $2,300 | $1.47 | 45d | 1 | 1.37mi |
Listing history 6 events
-
2026-06-08statusdays on market $313,000 Pending 8 DOM
-
2026-06-07days on market $313,000 Active 7 DOM
-
2026-06-03days on market $313,000 Active 3 DOM
-
2026-06-02days on market $313,000 Active 2 DOM
-
2026-06-01remarks 241-char remark
-
2026-06-01$313,000 Active 1 DOM
ⓘ Source: listings_history table (triggers on properties + properties_extension) + one-shot
backfill from property_details.listing_events for pre-trigger history.
Tax reassessment forecast NM · Resets to sale price
- Current annual tax
- $1,630 · $136/mo
- Projected year-2 tax
- $2,504 · $209/mo
- Expected delta
- +$874/yr (+$73/mo · 53.6%)
ⓘ Screening estimate from a state-policy table — verify with the county assessor before closing.
Climate risk First Street
- Flood 1/10 Low FEMA zone X (unshaded) · 0% chance over 30 yrs
- Wildfire 3/10 Moderate
- Heat 5/10 Major 7 d/yr ≥95°F today · 19 d/yr by 30 yrs out
- Wind 1/10 Low
- Air quality 3/10 Moderate 3 unhealthy d/yr today · 4 by 30 yrs out
Nearby sold comps map
Loading sold comps map…
Walkable amenities ~0.75 mi
Loading nearby amenities…
Taxation est. · year 1
- Rental income
- $29,422
- − Mortgage interest
- −$17,533
- − Property taxes
- −$1,630
- − Insurance
- −$1,565
- − Repairs & maintenance
- −$2,354
- − Management
- −$2,354
- − Depreciation
- −$9,105
- Taxable loss
- −$5,118
- Est. tax savings @ 24.0%
- +$1,228
- After-tax cash flow
- $1,580/yr
For passive investors: Depreciation is non-cash, so a rental often shows a tax loss while cash-flowing — sheltering income. Rental losses are passive: they offset passive income freely, and up to $25,000/yr can offset ordinary (W-2) income if you actively participate and your MAGI is under $100k (phasing out to $0 by $150k); unused losses carry forward. On sale, claimed depreciation is recaptured at up to 25%, and gains may owe capital-gains tax (a 1031 exchange can defer both). Figures are a year-1 estimate at your 24.0% rate — not tax advice; consult a CPA.
Schools (NCES district)
- District
- Rio Rancho Public Schools
- NCES district ID
- 3500010
- Math proficiency
- 48% ▲ 38.00%
- Reading proficiency
- 73% ▲ 48.00%
- Median HH income
- $59,410
- Composite
- 52.29/100
- National rank
- #1595
- State rank
- #4 of 29 in NM
Livability — Rio Rancho
- Score
- 71/100
- State rank
- #17
- US rank
- #7253
Category grades
Schools grade is shown separately in the Schools card above.
Census & demographics
- Census place
- Rio Rancho, NM
- County
- Sandoval County · 110,336 people
- City population
- 110,336
- Metro
- Albuquerque, NM
- Population (ZIP)
- 58,499
- Household income
- $86,555
- Rent vs Own
- Severe rent burden
- 1027.0
Population outlook (Sandoval County) Hauer SSP2
- Today (2025)
- 155,072 people
- By 2030
- 161,714 · +4.3%
- By 2040
- 171,831 · +10.8%
- By 2050
- 178,536 · +15.1%
- By 2075
- 192,517 · +24.1%
- By 2100
- 197,952 · +27.7%
Race, ethnicity, and origin ACS 2023
- Neighborhood character
- Diverse neighborhood (Simpson 0.61)
- Race & ethnicity
- White 47% Hispanic / Latino 41% Two or more races 18% Native American 5% Black 3% Asian 2%
- Hispanic origin (detail)
- Mexican 24% Puerto Rican 2%
- Common ancestry
- Lithuanian 3% Slovak 2% Italian 2%
- Foreign-born
- 6% · Canada, Vietnam, China
- Languages at home
- 84% English-only · Spanish 12% Vietnamese 1%
Political lean MEDSL · Sandoval
- 2024 margin
- Lean D (+5.8) · D 51.8% · R 46.0% · Other 2.2%
- 2008→2024 swing
- -7.0pp toward R · 2008: 12.8pp · 2024: 5.8pp
- All cycles
- 2024: D+5.8 2020: D+8.4 2016: D+2.7 2012: D+5.1 2008: D+12.8
Not yet ingested
- Civics
- —
Market trends
- HPI YoY
- ▼ -303.50%
- Current HPI
- 219.8377
- Rent YoY
- ▲ 3.13%
- Metro
- Albuquerque, NM
- State GDP YoY
- —
- F500 in state
- 0
Price history
+84.2% since first listed5 events — show timeline
- 2026-05-31 Listed $313,000 Southwest MLS
- 2016-04-19 Delisted — Southwest MLS
- 2016-04-09 Contingent — Southwest MLS
- 2016-03-22 Listed $169,900 Southwest MLS
- 2007-08-22 Sold (Public Records) — Public Records
Property tax history
-14.9%/yrLatest (2016): $1,630 · +2.1% YoY. Source: county tax records.
Cash-flow waterfall
monthlySold comps — $/sqft
last 12 mo · ≤1 miLoading sold comps…