 Fourplex
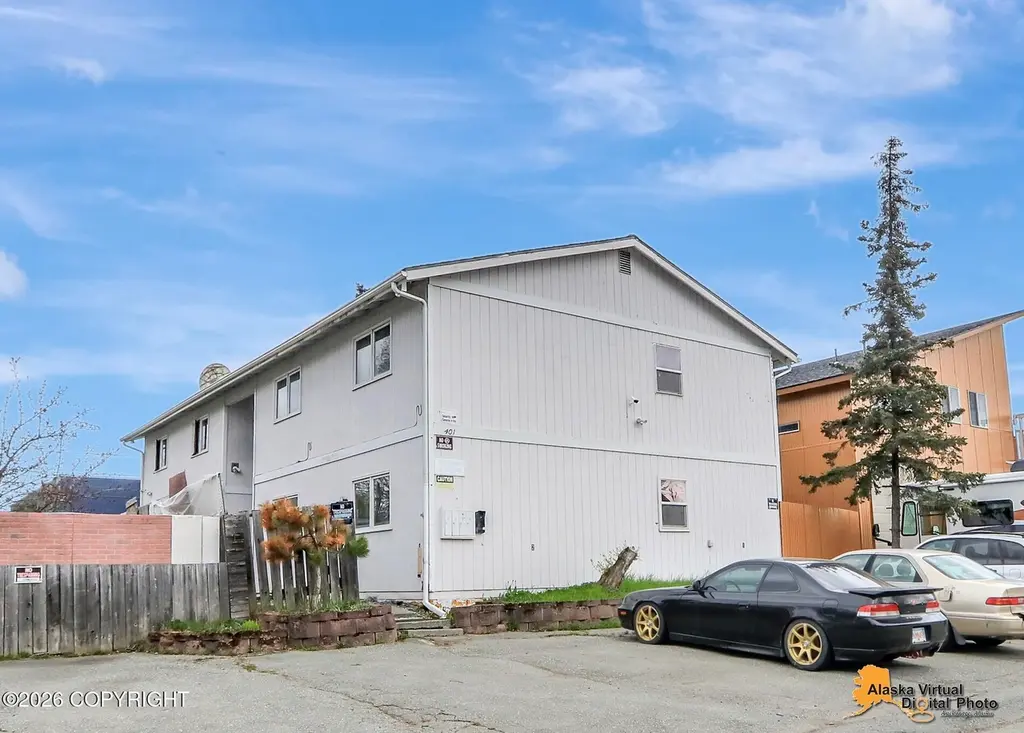
401 N Bliss St · Anchorage, AK
Flood risk 1/10 · Minimal
- FEMA flood zone
- X (unshaded)
- Chance of flooding over 30 yrs
- 0.0%
- Est. flood insurance / yr
- $507 – $1,088
Fire risk No data
- Est. fire insurance / yr
- —
Heat risk No data
- Hot days now (above threshold)
- —
- Hot days in 30 yrs
- —
Wind risk No data
- Chance of severe wind over 30 yrs
- —
Air-quality risk 1/10 · Minimal
- Unhealthy air days now
- —
- Unhealthy air days in 30 yrs
- —
Risk factors via First Street. Map © Google.
Why this score? — see what drove the C+ grade
The composite is a weighted blend of 9 inputs, each scored 0–100. Each bar is that input's sub-score; the figure is the points it added to the 100-point composite (weight × sub-score).
- Cash flow +26.3/30.0
- DSCR +8.9/10.0
- 1% rule +7.0/10.0
- ARV discount +6.9/15.0
- Livability +3.9/5.0
- Condition / age +3.8/5.0
- Rent growth +3.7/5.0
- Schools +3.7/10.0
- Appreciation +0.0/10.0
$520,000
🖨 Deal sheet (PDF) 📄 Offer letter ✓ Due diligence
Multi-family units
County records classify this as Multi-Family (2-4 Unit). Listing-text estimate: 4 units. confirmed
Listing remarks
Great opportunity near JBER! This well cared for 4-plex on a non-thru street, is perfect for investors or those looking to owner-occupy and let the other units help pay the mortgage. Conveniently located with easy access to base, schools, shopping, and parks. Each unit offers functional layouts and 2 off-street parking spots. Two units upstairs has a fireplace, bottoms don't.
Key facts
- Easy access to base
- Non-thru street
- Functional layouts
Tags
Property features AI
Finance
- Financial info: Annual tax listed (see brokerage for details)
Exterior
- Parking: 8 open parking spaces; No attached garage or carport
- Utilities: Public sewer
- Home design: Multi-family property; Built in 1983; Block foundation
- Construction: Asphalt shingle roof; Block foundation; Year built 1983
- Exterior features: Paved road access; Asphalt shingle roof
Interior
- Bedrooms: 8 bedrooms
- Bathrooms: 4 full bathrooms
- Interior features: Total living area of 3,536
Neighborhood map
What this means for you Summary
Snapshot
- This is a 4 × 2-bed/1.0-bath units multifamily listed at $520k. Condition is rated good.
Deal economics
- At list price, monthly cash flow is $1k ($16k/yr) — positive. Per door: $335/mo.
- The deal already cash-flows at list — no discount required.
- Meets the 1% rule at list price ($6k rent vs $520k).
- Cap rate 9.4% vs local median 3.8% in Anchorage — top-decile yield for the area; either an underpriced asset or a hidden risk that comps aren't pricing in. Stress-test before assuming the spread holds.
Location & tenants
- Location reads 78/100 on livability (#6 in AK, #2,553 nationally) — a middle-class / working-renter tenant base. Strengths: amenities A+, commute A+, employment A+; Watch: crime F, cost of living F.
- Anchorage School District (urban): math 37% / reading 43% proficiency, ranked #6 of 21 in AK (top 29%) — families likely to look elsewhere, expect single-tenant / working-renter base with shorter leases.
- Zoned schools: Mountain View Elementary (math 8% / reading 12%, grade F, #153 of 156 statewide, top 100%, 290 students, 100% FRL); Clark Middle School (math 7% / reading 22%, grade F, #35 of 36 statewide, top 97%, 835 students, 100% FRL); Bettye Davis East Anchorage High School (math 20% / reading 25%, grade F, #51 of 61 statewide, top 83%, 1,745 students, 71% FRL) — zoned schools average 90% FRL vs 38% district-wide (53 pts higher); higher-poverty schools than district average — tighter screening recommended.
- Zoned-school proficiency averages 16% at this address vs 40% district-wide (-24 pts) — the specific schools serving this property underperform the Anchorage School District average; the district grade overstates school quality for this exact location.
- Market conditions: Rents rising fast (+4.9%/yr); 149 active listings in the ZIP; solid renter incomes; 306 units permitted in Anchorage Municipality in 2024 (90 in 5+ unit buildings).
- At $6,246/mo this rent would consume 95% of the median local household income ($79k/yr) (locally 1248% of renters already pay >50% of income on rent) — very limited rent-growth headroom before tenants either downsize or default.
Forward outlook
- Local home prices are declining (-3.0%/yr); year-one equity from $4k of loan paydown is wiped out by about $16k of value loss. Plan a longer hold.
- Anchorage County population projected at +12% by 2050 — modest demand growth; plan on rents tracking national, not racing it.
- At projected returns (-3.0% appreciation + 4.9% rent growth), your $146k cash investment doubles in ~9 years — after that, you're playing with house money.
Negotiation context
- Only 3 days on market — expect competitive offers; lowballing is unlikely to land.
- 3 sale attempts since 11y ago with the ask held roughly flat each time — persistent listings suggest the price (not the market) is what's stuck; bring a comps-based counter.
Questions for the listing agent
- Can we see the unit-by-unit rent roll, current vacancy, and any below-market leases? What's the average tenancy length?
- What capital expenditures (roof, boiler, parking lot, exteriors) have been made in the last 5 years, and what's planned in the next 2?
- Is there a deadline driving the sale (1031 exchange, divorce, estate, relocation)? That informs how much negotiation room exists.
- Schools are B-rated — typically a magnet for longer-tenancy family renters. What's the average tenant stay here, and is there a school-zone premium baked into asking?
- Crime grade is F in this area — have there been break-ins, vandalism, or insurance claims at this property in the last 3 years? What carrier currently insures it and at what premium?
- What's the average days-on-market for RENTAL listings here right now (not sales)? A rising rental-DOM trend means longer vacancies and softer asking-rent achievability than the comps imply.
- What's the recent tenant-quality profile in this submarket — average credit score on applications, eviction rate, late-payment / NSF rate, and stable-employment percentage? A property-management company in the area should have these aggregated.
- How much new apartment / multifamily construction is in the pipeline within 1–3 miles? Heavy new supply (>2% of stock underway) typically softens rents 12–24 months out; light construction supports rent growth.
Investment metrics
- 1% rule
- 1.20% ✓
- Cap rate
- 9.39%
- Cash-on-cash
- 11.05%
- DSCR
- 1.49
- GRM
- 6.9
CMA / ARV
- ARV (on-the-fly)
- $512,720
- Comps found
- 12
Show comp detail 12 sales within ~0.75 mi
| Address | Dist | Beds/Ba | Sqft | Sold | Price | $/sf | Match |
|---|---|---|---|---|---|---|---|
| 617 N Flower St | 0.40mi | 8/4.0 | 3,456 (-2%) | 2mo | $620,000 | $179 | 76 |
| 741 N Bliss St | 0.24mi | 8/4.0 | 3,264 (-8%) | 6mo | $485,000 | $149 | 71 |
| 605 Mumford St | 0.63mi | 8/4.0 | 3,500 (-1%) | 3mo | $539,900 | $154 | 66 |
| 4502 McPhee Ave | 0.30mi | 9/4.0 (+1) | 3,792 (+7%) | 3mo | $549,900 | $145 | 66 |
| 740 N Bragaw St | 0.53mi | 9/4.0 (+1) | 3,560 (+1%) | 6mo | $474,000 | $133 | 64 |
| 633 N Flower St | 0.40mi | 8/4.0 | 3,780 (+7%) | 8mo | $180,000 | $48 | 63 |
| 4406 Parsons Ave | 0.21mi | 8/4.0 | 4,056 (+15%) | 9mo | $520,000 | $128 | 58 |
| 627 N Flower St | 0.40mi | 8/6.0 | 3,780 (+7%) | 8mo | $180,000 | $48 | 55 |
| 544 N Park St | 0.30mi | 9/4.0 (+1) | 3,932 (+11%) | 9mo | $540,000 | $137 | 55 |
| 601 Irwin St | 0.51mi | 9/4.0 (+1) | 3,780 (+7%) | 6mo | $577,700 | $153 | 55 |
| 808 N Flower St | 0.48mi | 9/4.0 (+1) | 3,840 (+9%) | 5mo | $540,000 | $141 | 54 |
| 314 Flower St | 0.62mi | 8/4.0 | 3,360 (-5%) | 12mo | $615,000 | $183 | 53 |
Match score weights: distance 35% · size 25% · config 20% · recency 20%. Top-matched comps best support the ARV.
Projected returns pro-forma
-3.0% appreciation · 4.88% rent growth · sell at horizon
- IRR
- 2.3%
- Equity multiple
- 1.09×
- Total profit
- $13,260
- Equity at exit
- $77,534
- IRR
- 13.7%
- Equity multiple
- 2.19×
- Total profit
- $173,210
- Equity at exit
- $44,960
Cash invested: $145,600 (down + closing). Projections, not guarantees.
Landlord ↔ Tenant lean methodology
- Overall (STATE)
- 80 Strongly Landlord-Friendly
- State Alaska
- 80 Strongly Landlord-Friendly · R+8
- County
- — inherits STATE
- City
- — inherits STATE
ZIP-level market 99508
- Rents YoY
- 4.9%
- Active inventory
- 149
- Price-to-rent
- 27.8×
Monthly cashflow live
- Estimated rent
- $6,246 high interval (Pro) →
- Mortgage (P&I)
- −$2,727
- Tax est. 1.5%
- −$650 /mo · $7,800/yr
- Insurance
- −$217
- HOA
- −$0
- Vacancy / Maint / Mgmt
- −$1,312
- Net cashflow
- $1,341
Break-even live
Sensitivity live
| Price | -10% $1,700 | -5% $1,520 | +0% $1,341 | +5% $1,161 | +10% $981 |
|---|---|---|---|---|---|
| Rent | -10% $847 | -5% $1,094 | +0% $1,341 | +5% $1,587 | +10% $1,834 |
| Rate | -1.0pp $1,603 | -0.5pp $1,473 | base $1,341 | +0.5pp $1,206 | +1.0pp $1,069 |
4-unit breakdown (identical units grouped — click to expand)
| Units | Beds | Baths | Est. rent |
|---|---|---|---|
| 4× units | 2 | 1 | $6,248 |
| #1 | 2 | 1 | $1,562 |
| #2 | 2 | 1 | $1,562 |
| #3 | 2 | 1 | $1,562 |
| #4 | 2 | 1 | $1,562 |
| Total (4 units) | $6,246 | ||
UW: 25.0% down · 7.5% · 30yr · 1.5% tax · 5.0% vac · 8.0% maint · 8.0% mgmt
Financing live
Cash to close
- Down payment
- $130,000
- Closing costs
- $15,600
- Reserves months
- —
- Total cash needed
- —
Loan-product check · same deal, 3 products live
Conventional
25% down · 7.5% · 30yr
- Down + closing
- —
- Monthly P&I
- —
- Monthly cashflow
- —
- DSCR
- —
- Eligible?
- —
Personal DTI + credit; lowest rate.
DSCR
20% down · 8.5% · 30yr
- Down + closing
- —
- Monthly P&I
- —
- Monthly cashflow
- —
- DSCR
- —
- Eligible?
- —
No personal income docs; deal must DSCR.
Hard money
10% down · 12.0% · 12mo
- Down + closing
- —
- Monthly P&I
- —
- Monthly cashflow
- —
- DSCR
- —
- Eligible?
- —
Short-term bridge; refi at stabilization.
Listing history 6 events
-
2026-06-01status $520,000 Pending 3 DOM
-
2026-05-31days on market $520,000 Active 3 DOM
-
2026-05-30days on market $520,000 Active 2 DOM
-
2026-05-28$520,000 Active
-
2016-03-25$388,500
-
2015-08-05$389,000
ⓘ Source: listings_history table (triggers on properties + properties_extension) + one-shot
backfill from property_details.listing_events for pre-trigger history.
Climate risk First Street
- Flood 1/10 Low FEMA zone X (unshaded) · 0% chance over 30 yrs
- Air quality 1/10 Low
Nearby sold comps map
Loading sold comps map…
Walkable amenities ~0.75 mi
Loading nearby amenities…
Taxation est. · year 1
- Rental income
- $74,952
- − Mortgage interest
- −$29,128
- − Property taxes
- −$7,800
- − Insurance
- −$2,600
- − Repairs & maintenance
- −$5,996
- − Management
- −$5,996
- − Depreciation
- −$15,127
- Taxable income
- $8,304
- Est. tax owed @ 24.0%
- −$1,993
- After-tax cash flow
- $14,096/yr
For passive investors: Depreciation is non-cash, so a rental often shows a tax loss while cash-flowing — sheltering income. Rental losses are passive: they offset passive income freely, and up to $25,000/yr can offset ordinary (W-2) income if you actively participate and your MAGI is under $100k (phasing out to $0 by $150k); unused losses carry forward. On sale, claimed depreciation is recaptured at up to 25%, and gains may owe capital-gains tax (a 1031 exchange can defer both). Figures are a year-1 estimate at your 24.0% rate — not tax advice; consult a CPA.
Condition & rehab AI · 12 photos
This 4-plex is well-maintained and ready for new owners. A fresh coat of paint and new carpet will enhance its curb appeal and interior comfort.
Value-add opportunities
- Both Paint the exterior and interior walls — Fresh paint enhances curb appeal and interior aesthetics.
- Both Replace the carpet in the living areas — New carpet improves comfort and adds value.
- Both Clean and maintain the HVAC system — A clean HVAC system ensures comfort and energy efficiency, attracting buyers and renters alike.
Renovation cost estimate screening
Value-add ROI direction
- Both Paint the exterior and interior walls — Fresh paint enhances curb appeal and interior aesthetics. ↑
- Both Replace the carpet in the living areas — New carpet improves comfort and adds value. ↑
- Both Clean and maintain the HVAC system — A clean HVAC system ensures comfort and energy efficiency, attracting buyers and renters alike. ↑
ⓘ Cost ranges are severity-bucket heuristics (US national rule-of-thumb). Get contractor quotes + a written scope before underwriting a rehab budget.
Schools (NCES district)
- District
- Anchorage School District
- NCES district ID
- 0200180
- Math proficiency
- 37% ▼ -2.00%
- Reading proficiency
- 43% ▲ 1.00%
- Median HH income
- $76,447
- Composite
- 37.0/100
- National rank
- #4523
- State rank
- #6 of 21 in AK
Livability — Anchorage
- Score
- 78/100
- State rank
- #6
- US rank
- #2553
Category grades
Schools grade is shown separately in the Schools card above.
Census & demographics
- Census place
- Anchorage, AK
- County
- Anchorage Borough · 246,594 people
- City population
- 218,117
- Metro
- Anchorage, AK
- Population (ZIP)
- 36,458
- Household income
- $79,314
- Rent vs Own
- Severe rent burden
- 1248.0
Population outlook (Anchorage County) Hauer SSP2
- Today (2025)
- 314,993 people
- By 2030
- 321,771 · +2.2%
- By 2040
- 335,493 · +6.5%
- By 2050
- 352,799 · +12.0%
- By 2075
- 414,771 · +31.7%
- By 2100
- 474,485 · +50.6%
Race, ethnicity, and origin ACS 2023
- Neighborhood character
- Highly diverse neighborhood (Simpson 0.82)
- Race & ethnicity
- White 38% Two or more races 14% Asian 13% Hispanic / Latino 13% Native American 10% Pacific Islander 8% Black 6%
- Hispanic origin (detail)
- Mexican 4% Puerto Rican 2% Cuban 1% Dominican 3%
- Common ancestry
- Portuguese 3% Iranian 2% Romanian 2%
- Foreign-born
- 15% · Canada, Jamaica, South Korea
- Languages at home
- 72% English-only · Other Asian/Pacific 11% Spanish 8% Tagalog/Filipino 4%
Political lean MEDSL · Anchorage
- 2024 margin
- D (+12.7) · D 56.3% · R 43.7%
- 2016→2024 swing
- +27.9pp toward D · 2016: -15.2pp · 2024: 12.7pp
- All cycles
- 2024: D+12.7 2016: R+15.2
Not yet ingested
- Civics
- —
Market trends
- HPI YoY
- ▼ -203.51%
- Current HPI
- 257.8807
- Rent YoY
- ▲ 4.88%
- Metro
- Anchorage, AK
- State GDP YoY
- —
- F500 in state
- 0
Price history
+33.7% since first listed3 events — show timeline
- 2026-05-28 Listed $520,000 AKMLS
- 2016-03-25 Listed $388,500 AKMLS
- 2015-08-05 Listed $389,000 AKMLS
Cash-flow waterfall
monthlySold comps — $/sqft
last 12 mo · ≤1 miLoading sold comps…