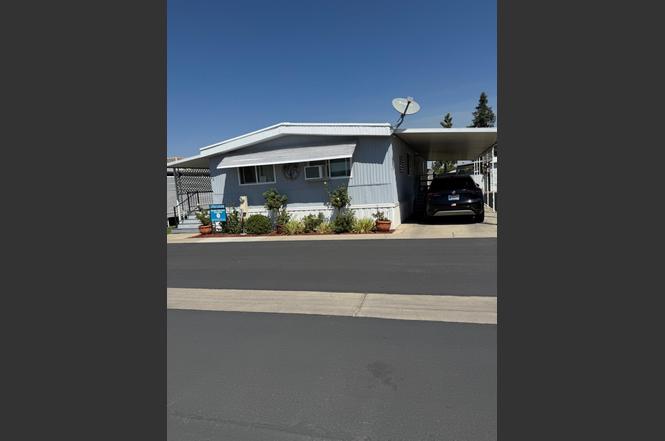
1500 W Villa #32 · Clovis, CA
Flood risk 5/10 · Moderate
- FEMA flood zone
- X (shaded)
- Chance of flooding over 30 yrs
- 0.58%
- Est. flood insurance / yr
- $507 – $1,088
Fire risk 1/10 · Minimal
- Est. fire insurance / yr
- $659 – $1,223
Heat risk 8/10 · Major
- Hot days now (above 105°F)
- 6 days/yr
- Hot days in 30 yrs
- 14 days/yr
Wind risk 1/10 · Minimal
- Chance of severe wind over 30 yrs
- —
Air-quality risk 10/10 · Severe
- Unhealthy air days now
- 57 days/yr
- Unhealthy air days in 30 yrs
- 60 days/yr
Risk factors via First Street. Map © Google.
Why this score? — see what drove the B+ grade
The composite is a weighted blend of 9 inputs, each scored 0–100. Each bar is that input's sub-score; the figure is the points it added to the 100-point composite (weight × sub-score).
- Cash flow +30.0/30.0
- ARV discount +10.8/15.0
- 1% rule +10.0/10.0
- DSCR +10.0/10.0
- Schools +5.9/10.0
- Livability +3.8/5.0
- Rent growth +3.2/5.0
- Condition / age +2.5/5.0
- Appreciation +0.0/10.0
$98,500
🖨 Deal sheet (PDF) 📄 Offer letter ✓ Due diligence
Listing remarks
Welcome to wonderful Arabian Villa Mobile Home Park 55+ Community ! handicap Mobile Home 2 bedroom 2 bath, Master bath has a roll in shower! 2nd bath a Jack & Jill Master bedroom is good size with two closets Living Room is good size with dinning area. Plank flooring living Room , bedrooms, > Kitchen and Baths have tile Kitchen has lots cabinets and dinning and laundry room ceiling fans in all rooms except Kitchen !>Has two lifts carport and back. Park has a beautiful Club House with many actives. ! Nice size Laundry Room<includes washer in dryer</Mobile Home that feels like home , very comfortable
Key facts
- Jack & jill
- Tile kitchen
- Ceiling fans
Tags
Neighborhood map
What this means for you Summary
Snapshot
- This is a 2-bed/2.0-bath manufactured listed at $98k.
Deal economics
- At list price, monthly cash flow is $821 ($10k/yr) — positive.
- The deal already cash-flows at list — no discount required.
- Meets the 1% rule at list price ($2k rent vs $98k).
- Recommended offer: $93k (6.0% below list) — sets the bar for market timing.
- Cap rate 16.3% vs local median 3.0% in Clovis — top-decile yield for the area; either an underpriced asset or a hidden risk that comps aren't pricing in. Stress-test before assuming the spread holds.
Location & tenants
- Location reads 76/100 on livability (#92 in CA, #3,307 nationally) — a middle-class / working-renter tenant base. Strengths: commute A+, housing A+, employment A; Watch: amenities C-, health & safety D, cost of living F.
- Clovis Unified (suburban): math 58% / reading 72% proficiency, ranked #152 of 1,400 in CA (top 11%) — acceptable for families but not a draw, mixed tenant base, ~2y average lease.
- Zoned schools: Sierra Vista Elementary (503 students, 87% FRL); Clark Intermediate (1,462 students, 61% FRL); Clovis High (2,905 students, 48% FRL) — zoned schools average 65% FRL vs 32% district-wide (34 pts higher); higher-poverty schools than district average — tighter screening recommended.
- Market conditions: Rents rising (+2.6%/yr); 86 active listings in the ZIP; 40 comparable units currently listed for rent nearby; rentals at typical pace (median 25d on market — plan ~3-4 weeks tenant-placement turnaround); 42% of comp listings sitting > 30 days — soft ceiling on asking rent; 2,426 units permitted in Fresno County in 2024 (296 in 5+ unit buildings).
- This rent runs 32% of the median local income ($67k/yr) — at the standard rent-burdened threshold; future hikes will face affordability resistance.
Forward outlook
- Local home prices are declining (-3.0%/yr); year-one equity from $681 of loan paydown is wiped out by about $3k of value loss. Plan a longer hold.
- Fresno County population projected at +11% by 2050 — modest demand growth; plan on rents tracking national, not racing it.
- At projected returns (-3.0% appreciation + 2.6% rent growth), your $28k cash investment doubles in ~4 years — after that, you're playing with house money.
Negotiation context
- It's been on market 85 days — a 6% lower offer ($93k) is reasonable based on typical stale-listing flexibility.
Risks & watch-outs
- Climate carrying-cost: moderate flood risk; extreme-heat days projected 6→14/yr by 2055 (HVAC capex compounding) — expect insurance premiums to compound above CPI over the hold.
Questions for the listing agent
- It's been on market 85 days. Have you received any prior offers? Is the seller open to a 6% concession, seller financing, or rate buy-down credit?
- Built in 1976 — when were the roof, HVAC, electrical panel, plumbing, and water heater last replaced?
- Why hasn't it sold? Are there any deal-killer items the seller is aware of (foundation, flood, title, zoning, code violations)?
- Is there a deadline driving the sale (1031 exchange, divorce, estate, relocation)? That informs how much negotiation room exists.
- Schools are B-rated — typically a magnet for longer-tenancy family renters. What's the average tenant stay here, and is there a school-zone premium baked into asking?
- What's the average days-on-market for RENTAL listings here right now (not sales)? A rising rental-DOM trend means longer vacancies and softer asking-rent achievability than the comps imply.
- What's the recent tenant-quality profile in this submarket — average credit score on applications, eviction rate, late-payment / NSF rate, and stable-employment percentage? A property-management company in the area should have these aggregated.
- How much new for-sale + rental construction is in the pipeline within 1–3 miles? Heavy new supply typically softens prices + rents 12–24 months out; constrained supply supports both.
Investment metrics
- 1% rule
- 1.80% ✓
- Cap rate
- 16.30%
- Cash-on-cash
- 35.74%
- DSCR
- 2.59
- GRM
- 4.6
CMA / ARV
- ARV (on-the-fly)
- $106,176
- Comps found
- 12
Show comp detail 12 sales within ~0.75 mi
| Address | Dist | Beds/Ba | Sqft | Sold | Price | $/sf | Match |
|---|---|---|---|---|---|---|---|
| 1500 W Villa #32 | 0.00mi | 2/2.0 | 1,248 (-7%) | 1mo | $98,500 | $79 | 87 |
| 1500 Villa Ave #94 | 0.00mi | 2/2.0 | 1,440 (+7%) | 8mo | $45,000 | $31 | 82 |
| 1500 Villa Ave #76 | 0.00mi | 2/1.8 | 1,440 (+7%) | 7mo | $59,000 | $41 | 81 |
| 1500 Villa Ave #117 | 0.01mi | 2/2.0 | 1,440 (+7%) | 8mo | $60,000 | $42 | 81 |
| 1001 Sylmar Ave #131 | 0.43mi | 3/2.0 (+1) | 1,404 (+4%) | 1mo | $136,500 | $97 | 67 |
| 1001 Sylmar Ave. #198 | 0.43mi | 2/2.0 | 1,248 (-7%) | 6mo | $129,000 | $103 | 63 |
| 1001 Sylmar Ave Spc 2 | 0.43mi | 2/2.0 | 1,440 (+7%) | 6mo | $100,000 | $69 | 63 |
| 1001 Sylmar Ave #218 | 0.46mi | 2/2.0 | 1,440 (+7%) | 8mo | $85,000 | $59 | 60 |
| 1001 Sylmar Ave #92 | 0.46mi | 3/2.0 (+1) | 1,456 (+8%) | 5mo | $170,000 | $117 | 56 |
| 1001 Sylmar Ave #99 | 0.43mi | 3/2.0 (+1) | 1,488 (+11%) | 2mo | $135,000 | $91 | 55 |
| 1001 Sylmar Ave #155 | 0.43mi | 2/2.0 | 1,536 (+14%) | 2mo | $100,000 | $65 | 55 |
| 1001 Sylmar #94 | 0.46mi | 3/2.0 (+1) | 1,536 (+14%) | 1mo | $149,900 | $98 | 49 |
Match score weights: distance 35% · size 25% · config 20% · recency 20%. Top-matched comps best support the ARV.
Projected returns pro-forma
-3.0% appreciation · 2.65% rent growth · sell at horizon
- IRR
- 31.0%
- Equity multiple
- 2.29×
- Total profit
- $35,701
- Equity at exit
- $14,687
- IRR
- 38.0%
- Equity multiple
- 4.47×
- Total profit
- $95,777
- Equity at exit
- $8,516
Cash invested: $27,580 (down + closing). Projections, not guarantees.
Landlord ↔ Tenant lean methodology
- Overall (STATE)
- 18 Strongly Tenant-Friendly
- State California
- 18 Strongly Tenant-Friendly · D+13
- County
- — inherits STATE
- City
- — inherits STATE
ZIP-level market 93612
- Rents YoY
- 2.6%
- Active inventory
- 86
- Price-to-rent
- 4.6×
Monthly cashflow live
- Estimated rent
- $1,770 high interval (Pro) →
- Mortgage (P&I)
- −$517
- Tax from tax record
- −$19 /mo · $231/yr
- Insurance
- −$41
- HOA
- −$0
- Vacancy / Maint / Mgmt
- −$372
- Net cashflow
- $821
Break-even live
Sensitivity live
| Price | -10% $877 | -5% $849 | +0% $821 | +5% $794 | +10% $766 |
|---|---|---|---|---|---|
| Rent | -10% $682 | -5% $752 | +0% $821 | +5% $891 | +10% $961 |
| Rate | -1.0pp $871 | -0.5pp $847 | base $821 | +0.5pp $796 | +1.0pp $770 |
UW: 25.0% down · 7.5% · 30yr · 1.5% tax · 5.0% vac · 8.0% maint · 8.0% mgmt
Financing live
Cash to close
- Down payment
- $24,625
- Closing costs
- $2,955
- Reserves months
- —
- Total cash needed
- —
Loan-product check · same deal, 3 products live
Conventional
25% down · 7.5% · 30yr
- Down + closing
- —
- Monthly P&I
- —
- Monthly cashflow
- —
- DSCR
- —
- Eligible?
- —
Personal DTI + credit; lowest rate.
DSCR
20% down · 8.5% · 30yr
- Down + closing
- —
- Monthly P&I
- —
- Monthly cashflow
- —
- DSCR
- —
- Eligible?
- —
No personal income docs; deal must DSCR.
Hard money
10% down · 12.0% · 12mo
- Down + closing
- —
- Monthly P&I
- —
- Monthly cashflow
- —
- DSCR
- —
- Eligible?
- —
Short-term bridge; refi at stabilization.
Rent comps 40 comps
| Address | Beds | Baths | Sqft | Rent | $/sqft | DOM | Units | Dist |
|---|---|---|---|---|---|---|---|---|
| 322 W Barstow Ave Unit 101 Clovis, CA | 2.0 | 2.0 | 1100 | $2,150 | $1.95 | 45d | 1 | 0.15mi |
| 1108 Villa Ave Clovis, CA | 2.0 | 1.5 | 900 | $1,500 | $1.67 | 45d | 1 | 0.23mi |
| 1099 Sylmar Ave Clovis, CA | 2.0 | 1.0 | 965 | $1,750 | $1.81 | 25d | 3 | 0.35mi |
| 139 W Portals Ave Clovis, CA | 2.0 | 1.0 | 1014 | $1,600 | $1.58 | 45d | 1 | 0.35mi |
| 608 W Scott Ave Clovis, CA | 3.0 | 2.0 | 1398 | $2,100 | $1.50 | 3d | 1 | 0.40mi |
| 50 W 9th St Clovis, CA | 2.0 | 2.0 | 1100 | $1,500 | $1.36 | 25d | 1 | 0.50mi |
| 1038 Tollhouse Rd Unit 1038 Clovis, CA | 2.0 | 1.5 | 1100 | $1,800 | $1.64 | 4d | 1 | 0.58mi |
| 707 Bush Ave Clovis, CA | 2.0 | 1.0 | 950 | $1,575 | $1.66 | 45d | 1 | 0.59mi |
| 2243 Helm Ave Unit 102 Clovis, CA | 2.0 | 2.0 | 1100 | $1,925 | $1.75 | 23d | 1 | 0.61mi |
| 1042 Adler Dr Clovis, CA | 2.0 | 1.5 | 1200 | $1,895 | $1.58 | 45d | 1 | 0.61mi |
| 740 Villa Ave Clovis, CA | 2.0 | 2.0 | 922 | $1,950 | $2.11 | 23d | 1 | 0.61mi |
| 33 W Santa Ana Ave Apt A Clovis, CA | 2.0 | 1.5 | 900 | $1,450 | $1.61 | 4d | 1 | 0.64mi |
| 145 Rall Ave Clovis, CA | 3.0 | 2.0 | 1200 | $1,900 | $1.58 | 17d | 1 | 0.78mi |
| 55 W Bullard Ave Clovis, CA | 1.0–2.0 | 1.0 | 800 | $1,771 | $2.21 | 3d | 13 | 0.81mi |
| 400 W Gettysburg Ave Apt 204A Clovis, CA | 2.0 | 1.0 | 904 | $1,600 | $1.77 | 45d | 1 | 0.86mi |
| 400 W Gettysburg Ave Unit 215B Clovis, CA | 2.0 | 2.0 | 994 | $1,780 | $1.79 | 45d | 1 | 0.86mi |
| 400 W Gettysburg Ave Apt 208A Clovis, CA | 2.0 | 1.0 | 904 | $1,500 | $1.66 | 45d | 1 | 0.86mi |
| 400 W Gettysburg Ave Unit 143A Clovis, CA | 2.0 | 1.0 | 904 | $1,650 | $1.83 | 23d | 1 | 0.86mi |
| 400 W Gettysburg Ave Unit 206B Clovis, CA | 2.0 | 1.0 | 904 | $1,500 | $1.66 | 25d | 1 | 0.86mi |
| 400 W Gettysburg Ave Unit 101A Clovis, CA | 2.0 | 1.0 | 904 | $1,580 | $1.75 | 25d | 1 | 0.86mi |
| 400 W Gettysburg Ave Unit 116B Clovis, CA | 2.0 | 2.0 | 994 | $1,795 | $1.81 | 45d | 1 | 0.86mi |
| 400 W Gettysburg Ave Apt 223A Clovis, CA | 2.0 | 2.0 | 994 | $1,700 | $1.71 | 45d | 1 | 0.86mi |
| 400 W Gettysburg Ave Unit 243A Clovis, CA | 2.0 | 1.0 | 904 | $1,500 | $1.66 | 4d | 1 | 0.86mi |
| 841 W San Gabriel Ave Clovis, CA | 3.0 | 2.0 | 1288 | $1,995 | $1.55 | 45d | 1 | 0.91mi |
| 5082 Primitivo Way Fresno, CA | 1.0–2.0 | 1.0 | 847 | $1,945 | $2.30 | 13d | 2 | 0.93mi |
| 2777 Willow Ave Clovis, CA | 1.0–2.0 | 1.0 | 812 | $1,769 | $2.18 | 3d | 8 | 0.93mi |
| 835 W Pico Ave Clovis, CA | 1.0–2.0 | 1.0 | 761 | $1,595 | $2.10 | 3d | 3 | 0.96mi |
| 3143 Matoian Way Fresno, CA | 1.0–2.0 | 1.0–2.0 | 971 | $1,960 | $2.02 | 45d | 1 | 1.00mi |
| 2967 Terry Ave Clovis, CA | 3.0 | 1.5 | 1099 | $2,095 | $1.91 | 25d | 1 | 1.00mi |
| 537 W Escalon Ave Apt 101 Clovis, CA | 2.0 | 2.0 | 1000 | $1,600 | $1.60 | 45d | 1 | 1.03mi |
| 2810 Willow Ave Clovis, CA | 2.0 | 2.0 | 890 | $1,572 | $1.77 | 12d | 1 | 1.03mi |
| 2810 Willow Ave Clovis, CA | 2.0 | 2.0 | 928 | $1,623 | $1.75 | 25d | 1 | 1.03mi |
| 2800 Willow Ave Clovis, CA | 1.0–2.0 | 1.0–2.0 | 774 | $1,633 | $2.11 | 3d | 7 | 1.06mi |
| 5477 E Indianapolis Ave Fresno, CA | 3.0 | 1.0 | 1403 | $2,295 | $1.64 | 45d | 1 | 1.07mi |
| 251 Minnewawa Ave Clovis, CA | 2.0 | 1.5 | 1100 | $2,100 | $1.91 | 16d | 1 | 1.08mi |
| 1201 Scott Ave Clovis, CA | 2.0 | 1.0 | 932 | $1,568 | $1.68 | 5d | 4 | 1.20mi |
| 4885 N Chestnut Ave Fresno, CA | 2.0 | 1.5 | 1125 | $1,565 | $1.39 | 45d | 1 | 1.28mi |
| 551 W Ashlan Ave Unit 101 858 Clovis, CA | 2.0 | 2.0 | 1000 | $1,450 | $1.45 | 45d | 1 | 1.32mi |
| 700 Music Ave Unit 102 Clovis, CA | 2.0 | 1.5 | 950 | $1,675 | $1.76 | 45d | 1 | 1.36mi |
| 700 Music Ave Clovis, CA | 2.0 | 2.0 | 950 | $1,675 | $1.76 | 25d | 1 | 1.36mi |
Listing history 4 events
-
2026-03-31status Pending
-
2026-02-17price $98,500
-
2026-01-04$103,000 Active
-
2025-09-27price $103,000
ⓘ Source: listings_history table (triggers on properties + properties_extension) + one-shot
backfill from property_details.listing_events for pre-trigger history.
Tax reassessment forecast CA · Resets to sale price
- Current annual tax
- $231 · $19/mo
- Projected year-2 tax
- $749 · $62/mo
- Expected delta
- +$518/yr (+$43/mo · 224.1%)
ⓘ Screening estimate from a state-policy table — verify with the county assessor before closing.
Climate risk First Street
- Flood 5/10 Major FEMA zone X (shaded) · 58% chance over 30 yrs
- Wildfire 1/10 Low
- Heat 8/10 Severe 6 d/yr ≥105°F today · 14 d/yr by 30 yrs out
- Wind 1/10 Low
- Air quality 10/10 Extreme 57 unhealthy d/yr today · 60 by 30 yrs out
Nearby sold comps map
Loading sold comps map…
Walkable amenities ~0.75 mi
Loading nearby amenities…
Taxation est. · year 1
- Rental income
- $21,240
- − Mortgage interest
- −$5,518
- − Property taxes
- −$231
- − Insurance
- −$492
- − Repairs & maintenance
- −$1,699
- − Management
- −$1,699
- − Depreciation
- −$2,865
- Taxable income
- $8,735
- Est. tax owed @ 24.0%
- −$2,096
- After-tax cash flow
- $7,761/yr
For passive investors: Depreciation is non-cash, so a rental often shows a tax loss while cash-flowing — sheltering income. Rental losses are passive: they offset passive income freely, and up to $25,000/yr can offset ordinary (W-2) income if you actively participate and your MAGI is under $100k (phasing out to $0 by $150k); unused losses carry forward. On sale, claimed depreciation is recaptured at up to 25%, and gains may owe capital-gains tax (a 1031 exchange can defer both). Figures are a year-1 estimate at your 24.0% rate — not tax advice; consult a CPA.
Schools (NCES district)
- District
- Clovis Unified
- NCES district ID
- 0609030
- Math proficiency
- 58% ▲ 1.00%
- Reading proficiency
- 72% ▲ 2.00%
- Median HH income
- $71,950
- Composite
- 58.7/100
- National rank
- #2003
- State rank
- #152 of 1400 in CA
Livability — Clovis
- Score
- 76/100
- State rank
- #92
- US rank
- #3307
Category grades
Schools grade is shown separately in the Schools card above.
Census & demographics
- Census place
- Clovis, CA
- County
- Fresno County · 834,801 people
- City population
- 139,989
- Metro
- Fresno, CA
- Population (ZIP)
- 37,755
- Household income
- $66,683
- Rent vs Own
- Severe rent burden
- 2487.0
Population outlook (Fresno County) Hauer SSP2
- Today (2025)
- 1,042,971 people
- By 2030
- 1,072,198 · +2.8%
- By 2040
- 1,122,408 · +7.6%
- By 2050
- 1,157,251 · +11.0%
- By 2075
- 1,182,575 · +13.4%
- By 2100
- 1,105,899 · +6.0%
Race, ethnicity, and origin ACS 2023
- Neighborhood character
- Diverse neighborhood (Simpson 0.65)
- Race & ethnicity
- Hispanic / Latino 41% White 41% Two or more races 18% Asian 12% Black 2% Native American 2%
- Hispanic origin (detail)
- Mexican 37%
- Common ancestry
- Slovak 2% Lithuanian 1% Italian 1%
- Foreign-born
- 12% · Canada, China, Vietnam
- Languages at home
- 73% English-only · Spanish 18% Other Asian/Pacific 4% Tagalog/Filipino 2%
Political lean MEDSL · Fresno
- 2024 margin
- Toss-up / Even · D 46.5% · R 50.9% · Other 2.6%
- 2008→2024 swing
- -6.5pp toward R · 2008: 2.1pp · 2024: -4.4pp
- All cycles
- 2024: R+4.4 2020: D+7.8 2016: D+3.9 2012: R+2.9 2008: D+2.1
Not yet ingested
- Civics
- —
Market trends
- HPI YoY
- ▼ -352.97%
- Current HPI
- 357.6089
- Rent YoY
- ▲ 2.65%
- Metro
- Fresno, CA
- State GDP YoY
- ▲ 3.21%
- F500 in state
- 116
Industry mix (Fortune 500 HQ in CA)
| Industry | F500 HQs | Revenue |
|---|---|---|
| Technology | 27 | $1,492B |
|
||
| Financial Services | 3 | $174B |
|
||
| Retail | 3 | $44B |
|
||
| Insurance | 3 | $26B |
|
||
| Media / Entertainment | 2 | $115B |
|
||
| Pharmaceuticals / Biotech | 2 | $62B |
|
||
Price history
-4.4% since first listed4 events — show timeline
- 2026-03-31 Pending — FRESNOMLS
- 2026-02-17 Price Changed $98,500 FRESNOMLS
- 2026-01-04 Listed $103,000 FRESNOMLS
- 2025-09-27 Price Changed $103,000 FRESNOMLS
Cash-flow waterfall
monthlySold comps — $/sqft
last 12 mo · ≤1 miLoading sold comps…