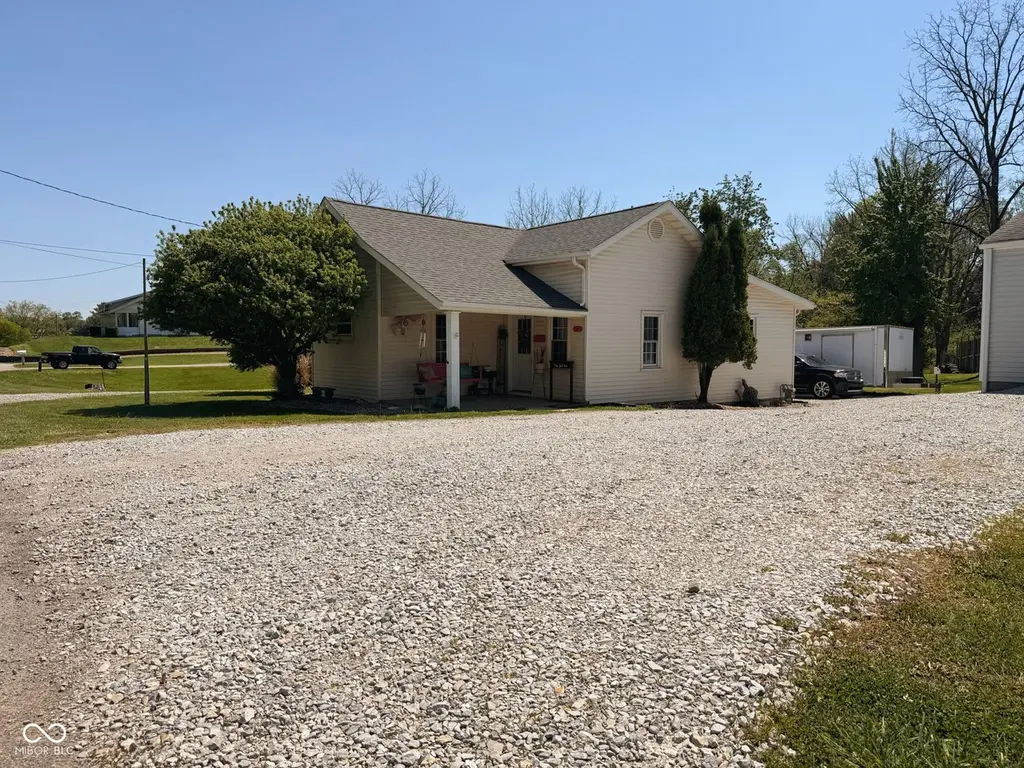
507 S Michigan Ave · Greensburg, IN
Flood risk 1/10 · Minimal
- FEMA flood zone
- X (unshaded)
- Chance of flooding over 30 yrs
- 0.0%
- Est. flood insurance / yr
- $473 – $860
Fire risk 1/10 · Minimal
- Est. fire insurance / yr
- $717 – $1,331
Heat risk 3/10 · Minor
- Hot days now (above 100°F)
- 7 days/yr
- Hot days in 30 yrs
- 19 days/yr
Wind risk 2/10 · Minimal
- Chance of severe wind over 30 yrs
- 1.0%
Air-quality risk 2/10 · Minimal
- Unhealthy air days now
- 1 days/yr
- Unhealthy air days in 30 yrs
- 2 days/yr
Risk factors via First Street. Map © Google.
Why this score? — see what drove the B grade
The composite is a weighted blend of 9 inputs, each scored 0–100. Each bar is that input's sub-score; the figure is the points it added to the 100-point composite (weight × sub-score).
- Cash flow +30.0/30.0
- ARV discount +10.5/15.0
- DSCR +10.0/10.0
- 1% rule +7.7/10.0
- Schools +3.8/10.0
- Livability +3.5/5.0
- Rent growth +2.5/5.0
- Condition / age +2.5/5.0
- Appreciation +0.0/10.0
$315,000
🖨 Deal sheet (PDF) 📄 Offer letter ✓ Due diligence
Listing remarks MLS
Rare 4 bedroom / 2 bath home sitting on nearly an acre of land. This home has beautiful Birch custom cabinets in a Pleak designed kitchen. You have newly sanded and refinished hardwood floors, professionally cleaned carpets, new professional interior paint and a family room on lower level. The septic was new in 2014. There is a peaceful back yard with Koorman Shed, mature trees and room to play.
Key facts
- Hardwood flooring
- Delightful porch
- Generous island
Tags
Property features AI
Exterior
- Parking: Gravel parking; no garage listed
- Security: Smoke alarm
- Utilities: Public water; Septic system
- Home design: Single-family residence; Tri-level design; Additional parcels included
- Construction: Vinyl siding; Block foundation; Finished daylight basement with walk-out access
- Exterior features: Covered patio/porch; Storage shed; Mature trees and wooded lot
Interior
- Kitchen: Dishwasher; Gas oven; Microwave with hood
- Bedrooms: Four bedrooms total — two on the main level, two on the upper level, plus one bedroom in the basement
- Flooring: Hardwood floors
- Bathrooms: Two full bathrooms (one on the main level, one on the upper level)
- Heating & cooling: Forced air heating (natural gas); Central air conditioning
- Interior features: Hardwood floors; Stained/painted woodwork; Kitchen island; Smoke alarm
- Laundry & utility: Laundry located in the basement; Electric water heater
Neighborhood map
What this means for you Summary
Snapshot
- This is a 4-bed/2.0-bath single-family listed at $315k.
Deal economics
- At list price, monthly cash flow is $1k ($16k/yr) — positive.
- The deal already cash-flows at list — no discount required.
- Meets the 1% rule at list price ($4k rent vs $315k).
- Recommended offer: $296k (6.0% below list) — sets the bar for market timing.
- Cap rate 11.3% vs local median 5.9% in Greensburg — top-decile yield for the area; either an underpriced asset or a hidden risk that comps aren't pricing in. Stress-test before assuming the spread holds.
Location & tenants
- Location reads 69/100 on livability (#200 in IN) — a middle-class / working-renter tenant base. Strengths: cost of living A+, housing A+, crime B+; Watch: employment C-, amenities F, commute F.
- Greensburg Community Schools (town): math 38% / reading 51% proficiency, ranked #102 of 301 in IN (top 34%) — families likely to look elsewhere, expect single-tenant / working-renter base with shorter leases.
- Zoned schools: Greensburg Elementary (math 60% / reading 47%, grade C, #225 of 994 statewide, top 23%, 1,037 students, 55% FRL); Greensburg Community Jr High (math 24% / reading 49%, grade F, #156 of 330 statewide, top 48%, 441 students, 48% FRL); Greensburg Community High School (math 27% / reading 67%, grade D-, #143 of 369 statewide, top 44%, 671 students, 44% FRL).
- Market conditions: 158 active listings in the ZIP; 1 comparable units currently listed for rent nearby; 66 units permitted in Decatur County in 2024 (0 in 5+ unit buildings).
Forward outlook
- Local home prices are declining (-3.0%/yr); year-one equity from $2k of loan paydown is wiped out by about $9k of value loss. Plan a longer hold.
- Decatur County population projected at +6% by 2050 — modest demand growth; plan on rents tracking national, not racing it.
- At projected returns (-3.0% appreciation + 3.0% rent growth), your $88k cash investment doubles in ~7 years — after that, you're playing with house money.
Negotiation context
- It's been on market 62 days — a 6% lower offer ($296k) is reasonable based on typical stale-listing flexibility.
- 4 sale attempts since 17y ago with the ask held roughly flat each time — persistent listings suggest the price (not the market) is what's stuck; bring a comps-based counter.
- Current owner paid $160k; list at $315k implies a 97% gain — meaningful room to come down on a strong offer.
Risks & watch-outs
- Watch-outs: built in 1880 — expect roof / HVAC / electrical / plumbing capex.
Questions for the listing agent
- It's been on market 62 days. Have you received any prior offers? Is the seller open to a 6% concession, seller financing, or rate buy-down credit?
- Built in 1880 — when were the roof, HVAC, electrical panel, plumbing, and water heater last replaced?
- Why hasn't it sold? Are there any deal-killer items the seller is aware of (foundation, flood, title, zoning, code violations)?
- Is there a deadline driving the sale (1031 exchange, divorce, estate, relocation)? That informs how much negotiation room exists.
- Schools are D-rated, which usually means shorter tenancies and higher turnover. Who's the typical renter profile here, and what's been the actual vacancy rate?
- What's the average days-on-market for RENTAL listings here right now (not sales)? A rising rental-DOM trend means longer vacancies and softer asking-rent achievability than the comps imply.
- What's the recent tenant-quality profile in this submarket — average credit score on applications, eviction rate, late-payment / NSF rate, and stable-employment percentage? A property-management company in the area should have these aggregated.
- How much new for-sale + rental construction is in the pipeline within 1–3 miles? Heavy new supply typically softens prices + rents 12–24 months out; constrained supply supports both.
Investment metrics
- 1% rule
- 1.27% ✓
- Cap rate
- 11.25%
- Cash-on-cash
- 17.71%
- DSCR
- 1.79
- GRM
- 6.6
CMA / ARV
- ARV (median comp)
- $337,343
- List price
- $315,000
- Delta
- -6.62%
- Verdict
- FAIR
- Comps
- 20 within 1.0 mi
Show comp detail 12 sales within ~0.75 mi
| Address | Dist | Beds/Ba | Sqft | Sold | Price | $/sf | Match |
|---|---|---|---|---|---|---|---|
| 125 S Vine St | 0.29mi | 4/1.0 | 1,804 (+10%) | 3mo | $31,000 | $17 | 62 |
| 1037 E Lakeshore Dr | 0.41mi | 3/2.0 (-1) | 1,512 (-7%) | 3mo | $281,000 | $186 | 61 |
| 1033 E Tara Rd | 0.37mi | 3/2.0 (-1) | 1,718 (+5%) | 10mo | $335,000 | $195 | 60 |
| 912 E Hendricks St | 0.69mi | 3/2.0 (-1) | 1,652 (+1%) | 1mo | $300,000 | $182 | 60 |
| 1129 E Tara Rd | 0.57mi | 3/1.5 (-1) | 1,580 (-3%) | 7mo | $225,000 | $142 | 56 |
| 937 E Hendricks St | 0.61mi | 3/2.0 (-1) | 1,512 (-7%) | 2mo | $323,000 | $214 | 53 |
| 1037 E Tara Rd | 0.38mi | 3/2.0 (-1) | 1,468 (-10%) | 9mo | $255,000 | $174 | 53 |
| 311 E Central Ave | 0.64mi | 3/2.0 (-1) | 1,808 (+11%) | 1mo | $185,000 | $102 | 46 |
| 1114 S Maureen Rd | 0.58mi | 4/2.5 | 1,802 (+10%) | 10mo | $260,000 | $144 | 45 |
| 327 W Bryant St | 0.74mi | 3/1.0 (-1) | 1,709 (+5%) | 7mo | $200,000 | $117 | 43 |
| 1123 E Tara Rd | 0.55mi | 3/2.0 (-1) | 1,394 (-15%) | 2mo | $270,000 | $194 | 43 |
| 420 N East St | 0.68mi | 3/2.0 (-1) | 1,477 (-10%) | 10mo | $212,000 | $144 | 39 |
Match score weights: distance 35% · size 25% · config 20% · recency 20%. Top-matched comps best support the ARV.
Projected returns pro-forma
-3.0% appreciation · 3.0% rent growth · sell at horizon
- IRR
- 9.2%
- Equity multiple
- 1.36×
- Total profit
- $31,735
- Equity at exit
- $46,968
- IRR
- 18.3%
- Equity multiple
- 2.52×
- Total profit
- $133,843
- Equity at exit
- $27,235
Cash invested: $88,200 (down + closing). Projections, not guarantees.
Landlord ↔ Tenant lean methodology
- Overall (STATE)
- 90 Strongly Landlord-Friendly
- State Indiana
- 90 Strongly Landlord-Friendly · R+11
- County
- — inherits STATE
- City
- — inherits STATE
ZIP-level market 47240
- Home prices YoY
- -25.0%
- Active inventory
- 158
- Price-to-rent
- 6.6×
Monthly cashflow live
- Estimated rent
- $3,995 medium interval (Pro) →
- Mortgage (P&I)
- −$1,652
- Tax from tax record
- −$71 /mo · $852/yr
- Insurance
- −$131
- HOA
- −$0
- Vacancy / Maint / Mgmt
- −$839
- Net cashflow
- $1,302
Break-even live
Sensitivity live
| Price | -10% $1,480 | -5% $1,391 | +0% $1,302 | +5% $1,213 | +10% $1,124 |
|---|---|---|---|---|---|
| Rent | -10% $986 | -5% $1,144 | +0% $1,302 | +5% $1,460 | +10% $1,617 |
| Rate | -1.0pp $1,461 | -0.5pp $1,382 | base $1,302 | +0.5pp $1,220 | +1.0pp $1,137 |
UW: 25.0% down · 7.5% · 30yr · 1.5% tax · 5.0% vac · 8.0% maint · 8.0% mgmt
Financing live
Cash to close
- Down payment
- $78,750
- Closing costs
- $9,450
- Reserves months
- —
- Total cash needed
- —
Loan-product check · same deal, 3 products live
Conventional
25% down · 7.5% · 30yr
- Down + closing
- —
- Monthly P&I
- —
- Monthly cashflow
- —
- DSCR
- —
- Eligible?
- —
Personal DTI + credit; lowest rate.
DSCR
20% down · 8.5% · 30yr
- Down + closing
- —
- Monthly P&I
- —
- Monthly cashflow
- —
- DSCR
- —
- Eligible?
- —
No personal income docs; deal must DSCR.
Hard money
10% down · 12.0% · 12mo
- Down + closing
- —
- Monthly P&I
- —
- Monthly cashflow
- —
- DSCR
- —
- Eligible?
- —
Short-term bridge; refi at stabilization.
Rent comps 1 comps
| Address | Beds | Baths | Sqft | Rent | $/sqft | DOM | Units | Dist |
|---|---|---|---|---|---|---|---|---|
| 1011 N Anderson St Greensburg, IN | 3.0 | 2.5 | 1620 | $3,995 | $2.47 | 14d | 1 | 1.31mi |
Listing history 26 events
-
2026-06-22days on market $315,000 Active 62 DOM
-
2026-06-21days on market $315,000 Active 61 DOM
-
2026-06-21days on market $315,000 Active 60 DOM
-
2026-06-18days on market $315,000 Active 58 DOM
-
2026-06-17days on market $315,000 Active 57 DOM
-
2026-06-16days on market $315,000 Active 56 DOM
-
2026-06-15days on market $315,000 Active 55 DOM
-
2026-06-13days on market $315,000 Active 53 DOM
-
2026-06-12days on market $315,000 Active 52 DOM
-
2026-06-09days on market $315,000 Active 49 DOM
-
2026-06-08days on market $315,000 Active 48 DOM
-
2026-06-07days on market $315,000 Active 47 DOM
-
2026-06-05days on market $315,000 Active 45 DOM
-
2026-06-04days on market $315,000 Active 43 DOM
-
2026-06-02days on market $315,000 Active 42 DOM
-
2026-06-01days on market $315,000 Active 41 DOM
-
2026-05-31days on market $315,000 Active 40 DOM
-
2026-05-31days on market $315,000 Active 39 DOM
-
2026-04-21$325,000 Active 1150-char remark
-
2018-10-01soldstatus $159,900 Sold 402-char remark
Show marketing remark (402 chars)
Rare 4 bedroom / 2 bath home sitting on nearly an acre of land. This home has beautiful Birch custom cabinets in a Pleak designed kitchen. You have newly sanded and refinished hardwood floors, professionally cleaned carpets, new professional interior paint and a family room on lower level. The septic was new in 2014. There is a peaceful back yard with Koorman Shed, mature trees and room to play.
-
2018-08-15status Pending 402-char remark
Show marketing remark (402 chars)
Rare 4 bedroom / 2 bath home sitting on nearly an acre of land. This home has beautiful Birch custom cabinets in a Pleak designed kitchen. You have newly sanded and refinished hardwood floors, professionally cleaned carpets, new professional interior paint and a family room on lower level. The septic was new in 2014. There is a peaceful back yard with Koorman Shed, mature trees and room to play.
-
2018-08-07$159,900 Active 402-char remark
Show marketing remark (402 chars)
Rare 4 bedroom / 2 bath home sitting on nearly an acre of land. This home has beautiful Birch custom cabinets in a Pleak designed kitchen. You have newly sanded and refinished hardwood floors, professionally cleaned carpets, new professional interior paint and a family room on lower level. The septic was new in 2014. There is a peaceful back yard with Koorman Shed, mature trees and room to play.
-
2014-12-01historical
-
2014-11-07$137,000
-
2011-03-03historical
-
2009-10-12$129,900
ⓘ Source: listings_history table (triggers on properties + properties_extension) + one-shot
backfill from property_details.listing_events for pre-trigger history.
Tax reassessment forecast IN · Partial reset (capped growth)
- Current annual tax
- $852 · $71/mo
- Projected year-2 tax
- $1,765 · $147/mo
- Expected delta
- +$913/yr (+$76/mo · 107.1%)
ⓘ Screening estimate from a state-policy table — verify with the county assessor before closing.
Climate risk First Street
- Flood 1/10 Low FEMA zone X (unshaded) · 0% chance over 30 yrs
- Wildfire 1/10 Low
- Heat 3/10 Moderate 7 d/yr ≥100°F today · 19 d/yr by 30 yrs out
- Wind 2/10 Low 100% chance of damaging wind over 30 yrs
- Air quality 2/10 Low 1 unhealthy d/yr today · 2 by 30 yrs out
Nearby sold comps map
Loading sold comps map…
Walkable amenities ~0.75 mi
Loading nearby amenities…
Taxation est. · year 1
- Rental income
- $47,940
- − Mortgage interest
- −$17,645
- − Property taxes
- −$852
- − Insurance
- −$1,575
- − Repairs & maintenance
- −$3,835
- − Management
- −$3,835
- − Depreciation
- −$9,164
- Taxable income
- $11,034
- Est. tax owed @ 24.0%
- −$2,648
- After-tax cash flow
- $12,974/yr
For passive investors: Depreciation is non-cash, so a rental often shows a tax loss while cash-flowing — sheltering income. Rental losses are passive: they offset passive income freely, and up to $25,000/yr can offset ordinary (W-2) income if you actively participate and your MAGI is under $100k (phasing out to $0 by $150k); unused losses carry forward. On sale, claimed depreciation is recaptured at up to 25%, and gains may owe capital-gains tax (a 1031 exchange can defer both). Figures are a year-1 estimate at your 24.0% rate — not tax advice; consult a CPA.
Schools (NCES district)
- District
- Greensburg Community Schools
- NCES district ID
- 1804080
- Math proficiency
- 38% ▼ -7.00%
- Reading proficiency
- 51% ▼ -2.00%
- Median HH income
- $47,723
- Composite
- 37.96/100
- National rank
- #4301
- State rank
- #102 of 301 in IN
Livability — Greensburg
- Score
- 69/100
- State rank
- #200
- US rank
- #8922
Category grades
Schools grade is shown separately in the Schools card above.
Census & demographics
- Census place
- Greensburg, IN
- Population (ZIP)
- 21,514
Population outlook (Decatur County) Hauer SSP2
- Today (2025)
- 27,709 people
- By 2030
- 28,278 · +2.1%
- By 2040
- 29,195 · +5.4%
- By 2050
- 29,512 · +6.5%
- By 2075
- 29,835 · +7.7%
- By 2100
- 27,192 · -1.9%
Race, ethnicity, and origin ACS 2023
- Neighborhood character
- Predominantly White (93%)
- Race & ethnicity
- White 93% Two or more races 5% Hispanic / Latino 3%
- Common ancestry
- Slovak 2% Serbian 1% Romanian 1%
- Foreign-born
- 1% · Canada
- Languages at home
- 98% English-only · Spanish 2%
Political lean MEDSL · Decatur
- 2024 margin
- Solid R (+58.5) · D 19.9% · R 78.4% · Other 1.8%
- 2008→2024 swing
- -34.1pp toward R · 2008: -24.4pp · 2024: -58.5pp
- All cycles
- 2024: R+58.5 2020: R+58.1 2016: R+57.4 2012: R+40.5 2008: R+24.4
Not yet ingested
- Civics
- —
Market trends
- HPI YoY
- ▼ -70.13%
- Current HPI
- 210.3591
- Rent YoY
- —
- Metro
- —
- State GDP YoY
- ▲ 2.90%
- F500 in state
- 18
Industry mix (Fortune 500 HQ in IN)
| Industry | F500 HQs | Revenue |
|---|---|---|
| Industrial Machinery | 2 | $37B |
|
||
| Healthcare | 1 | $177B |
|
||
| Pharmaceuticals | 1 | $45B |
|
||
| Metals / Steel | 1 | $18B |
|
||
| Agriculture | 1 | $17B |
|
||
| Packaging | 1 | $12B |
|
||
Price history
+142.5% since first listed10 events — show timeline
- 2026-05-29 Price Changed $315,000 MIBOR as Distributed by MLS Grid
- 2026-05-27 Price Changed $319,900 MIBOR as Distributed by MLS Grid
- 2026-04-21 Listed $325,000 MIBOR as Distributed by MLS Grid
- 2018-10-01 Sold (MLS) $159,900 MIBOR as Distributed by MLS Grid
- 2018-08-15 Pending — MIBOR as Distributed by MLS Grid
- 2018-08-07 Listed $159,900 MIBOR as Distributed by MLS Grid
- 2014-12-01 Listing Removed — MIBOR as Distributed by MLS Grid
- 2014-11-07 Listed $137,000 MIBOR as Distributed by MLS Grid
- 2011-03-03 Listing Removed — MIBOR as Distributed by MLS Grid
- 2009-10-12 Listed $129,900 MIBOR as Distributed by MLS Grid
Property tax history
+5.7%/yrLatest (2023): $852 · +26.0% YoY. Source: county tax records.
Cash-flow waterfall
monthlySold comps — $/sqft
last 12 mo · ≤1 miLoading sold comps…