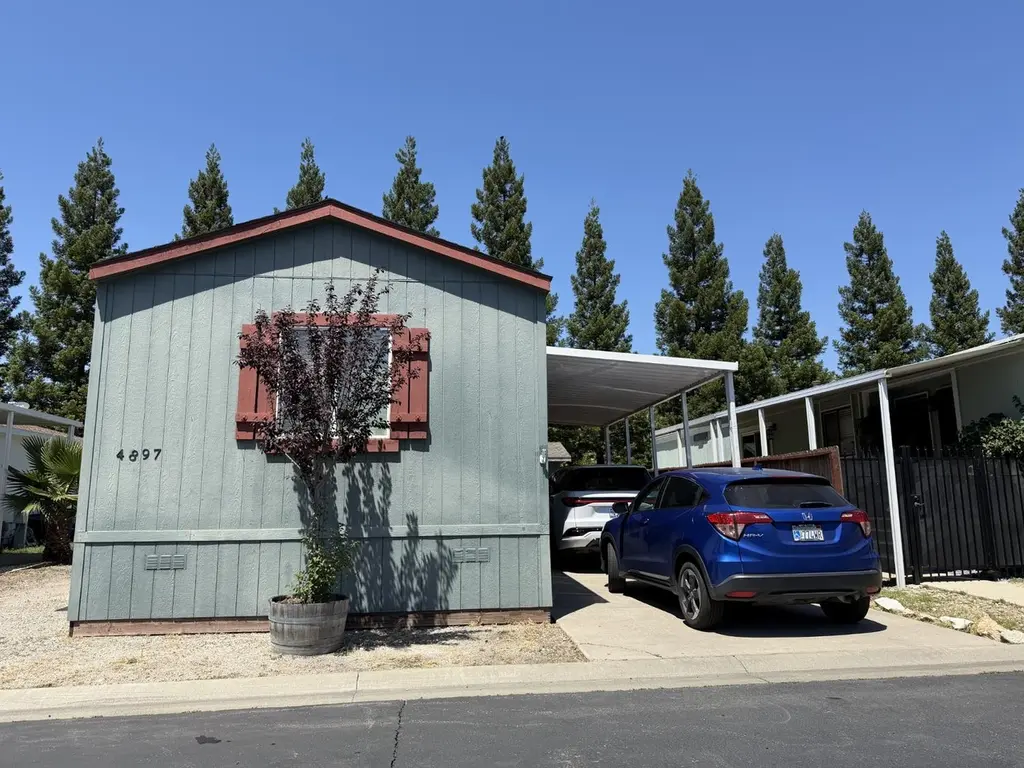
4897 Brookdale Dr #155 · Sacramento, CA
Flood risk 4/10 · Minor
- FEMA flood zone
- A99
- Chance of flooding over 30 yrs
- 0.2%
- Est. flood insurance / yr
- $1,009 – $1,996
Fire risk 5/10 · Moderate
- Est. fire insurance / yr
- $659 – $1,223
Heat risk 7/10 · Major
- Hot days now (above 103°F)
- 7 days/yr
- Hot days in 30 yrs
- 14 days/yr
Wind risk 1/10 · Minimal
- Chance of severe wind over 30 yrs
- —
Air-quality risk 10/10 · Severe
- Unhealthy air days now
- 27 days/yr
- Unhealthy air days in 30 yrs
- 33 days/yr
Risk factors via First Street. Map © Google.
Why this score? — see what drove the C- grade
The composite is a weighted blend of 9 inputs, each scored 0–100. Each bar is that input's sub-score; the figure is the points it added to the 100-point composite (weight × sub-score).
- Cash flow +15.0/30.0
- ARV discount +15.0/15.0
- 1% rule +5.0/10.0
- DSCR +5.0/10.0
- Schools +4.1/10.0
- Livability +3.6/5.0
- Rent growth +2.7/5.0
- Condition / age +2.5/5.0
- Appreciation +0.0/10.0
$54,900
🖨 Deal sheet 📄 Offer letter ✓ Due diligence
Listing remarks
MANUFACTURED HOME IN STADIUM CLUB ESTATES SR. COMMUNITY FOR 55 +. THIS SINGLE WIDE 2 BEDROOM, 2 BATH IS THE PERFECT HOME. BUILT IN 2015. KITCHEN W/ DINING BAR & DINING AREA, DOUBLE STAINLESS SINK, GRANITE LOOKING COUNTERTOPS, F/S GAS STOVE, DISHWASHER & DARK CABINETS. GREAT ROOM & DINING AREA W/ TILE LOOKING LINO. . DUAL PANE WINDOWS, 2 BLINDS & TEXTURED WALLS. OUTDOOR PATIO AREA & LGE. SHED WITH LIGHTS & WINDOWS FOR EXTRA STORAGE. LOW MAINTENANCE YARD WITH ROCK/GRAVEL WAITING FOR THAT EXTRA TOUCH. 2-CAR CARPORT W/ AWNING & SO MUCH MORE. CLUBHOUSE W/ POOL, SPA, EXERCISE RM, GAME RM, BBQ PITTS, SHUFFLE BOARD & LAUNDRY FACILITIES AVAILABLE. ENJO
Key facts
- Low maintenance yard
- Clubhouse
- Spa
Tags
Property features AI
Finance
- Other: Land lease: No (listed land lease amount present in source but excluded per instructions)
- HOA & community: No homeowners association; Senior community
Exterior
- Parking: Off-street parking; Guest parking available
- Utilities: Individual electric meter; Individual gas meter; Public water; Public sewer
- Home design: Manufactured home in a park; Single-wide; Built in 2015
- Construction: Composition roof; CMH Manufacturing make; Skirting: Other
- Exterior features: Carport awning; Porch awning; Regular-shaped lot
Interior
- Kitchen: Laminate counters
- Bedrooms: 2 bedrooms
- Flooring: Carpet; Linoleum
- Bathrooms: 2 full bathrooms; Tub with shower over; Shower stall(s)
- Heating & cooling: Central heating; Central air; Ceiling fans
- Interior features: Great room-style living area; Dual-pane full windows; Pets allowed
- Laundry & utility: Indoor laundry area; Gas hook-up for laundry; 220V outlet in laundry
Neighborhood map
What this means for you Summary
Snapshot
- This is a 2-bed/2.0-bath manufactured listed at $55k.
Deal economics
- At list price, monthly cash flow is $1k ($17k/yr) — positive.
- The deal already cash-flows at list — no discount required.
- Meets the 1% rule at list price ($2k rent vs $55k).
- Cap rate 39.1% vs local median 3.0% in Sacramento — top-decile yield for the area; either an underpriced asset or a hidden risk that comps aren't pricing in. Stress-test before assuming the spread holds.
Location & tenants
- Location reads 71/100 on livability (#218 in CA) — a middle-class / working-renter tenant base. Strengths: amenities A+, commute A+, housing A; Watch: schools D+, crime F, cost of living F.
- Natomas Unified (urban): math 33% / reading 60% proficiency, ranked #155 of 517 in CA (top 30%) — families likely to look elsewhere, expect single-tenant / working-renter base with shorter leases.
- Market conditions: Rents flat; 145 active listings in the ZIP; 15 comparable units currently listed for rent nearby; rentals leasing fast (median 2d on market — plan ~1-2 weeks tenant-placement turnaround); solid renter incomes; 6,825 units permitted in Sacramento County in 2024 (1,752 in 5+ unit buildings).
Forward outlook
- Local home prices are declining (-3.0%/yr); year-one equity from $380 of loan paydown is wiped out by about $2k of value loss. Plan a longer hold.
- Sacramento County population projected at +17% by 2050 — long-run rental-demand tailwind backs the buy-and-hold thesis.
- At projected returns (-3.0% appreciation + 0.8% rent growth), your $15k cash investment doubles in ~2 years — after that, you're playing with house money.
Negotiation context
- Only 13 days on market — expect competitive offers; lowballing is unlikely to land.
Risks & watch-outs
- Watch-outs: flood insurance adds $125/mo.
- Climate carrying-cost: in FEMA flood zone A99 (mandatory federal flood insurance); moderate wildfire risk; extreme-heat days projected 7→14/yr by 2055 (HVAC capex compounding) — expect insurance premiums to compound above CPI over the hold.
Questions for the listing agent
- What's the actual annual flood-insurance premium (NFIP or private), and is the property in a SFHA with mandatory coverage?
- Is there a deadline driving the sale (1031 exchange, divorce, estate, relocation)? That informs how much negotiation room exists.
- Schools are D-rated, which usually means shorter tenancies and higher turnover. Who's the typical renter profile here, and what's been the actual vacancy rate?
- Crime grade is F in this area — have there been break-ins, vandalism, or insurance claims at this property in the last 3 years? What carrier currently insures it and at what premium?
- What's the average days-on-market for RENTAL listings here right now (not sales)? A rising rental-DOM trend means longer vacancies and softer asking-rent achievability than the comps imply.
- What's the recent tenant-quality profile in this submarket — average credit score on applications, eviction rate, late-payment / NSF rate, and stable-employment percentage? A property-management company in the area should have these aggregated.
- How much new for-sale + rental construction is in the pipeline within 1–3 miles? Heavy new supply typically softens prices + rents 12–24 months out; constrained supply supports both.
Investment metrics
- 1% rule
- 4.32% ✓
- Cap rate
- 39.13%
- Cash-on-cash
- 117.29%
- DSCR
- 6.22
- GRM
- 1.9
CMA / ARV
- ARV (on-the-fly)
- $66,304
- Comps found
- 1
Show comp detail 1 sale within ~0.75 mi
| Address | Dist | Beds/Ba | Sqft | Sold | Price | $/sf | Match |
|---|---|---|---|---|---|---|---|
| 4860 Brookdale Dr #169 | 0.10mi | 2/2.0 | 880 (-2%) | 13mo | $64,900 | $74 | 81 |
Match score weights: distance 35% · size 25% · config 20% · recency 20%. Top-matched comps best support the ARV.
Projected returns pro-forma
-3.0% appreciation · 0.82% rent growth · sell at horizon
- IRR
- —
- Equity multiple
- 5.80×
- Total profit
- $73,835
- Equity at exit
- $8,186
- IRR
- —
- Equity multiple
- 11.26×
- Total profit
- $157,669
- Equity at exit
- $4,747
Cash invested: $15,372 (down + closing). Projections, not guarantees.
Landlord ↔ Tenant lean methodology
- Overall (STATE)
- 18 Strongly Tenant-Friendly
- State California
- 18 Strongly Tenant-Friendly · D+13
- County
- — inherits STATE
- City
- — inherits STATE
ZIP-level market 95834
- Home prices YoY
- -13.2%
- Rents YoY
- 0.8%
- Active inventory
- 145
- Price-to-rent
- 1.9×
Monthly cashflow live
- Estimated rent
- $2,374 high interval (Pro) →
- Mortgage (P&I)
- −$288
- Tax from tax record
- −$62 /mo · $746/yr
- Insurance
- −$23
- Flood insurance flood zone
- −$125 /mo · $1,502/yr
- HOA
- −$0
- Vacancy / Maint / Mgmt
- −$499
- Net cashflow
- $1,377
Break-even live
UW: 25.0% down · 7.5% · 30yr · 1.5% tax · 5.0% vac · 8.0% maint · 8.0% mgmt
Financing live
Cash to close
- Down payment
- $13,725
- Closing costs
- $1,647
- Reserves months
- —
- Total cash needed
- —
Loan-product check · same deal, 3 products live
Conventional
25% down · 7.5% · 30yr
- Down + closing
- —
- Monthly P&I
- —
- Monthly cashflow
- —
- DSCR
- —
- Eligible?
- —
Personal DTI + credit; lowest rate.
DSCR
20% down · 8.5% · 30yr
- Down + closing
- —
- Monthly P&I
- —
- Monthly cashflow
- —
- DSCR
- —
- Eligible?
- —
No personal income docs; deal must DSCR.
Hard money
10% down · 12.0% · 12mo
- Down + closing
- —
- Monthly P&I
- —
- Monthly cashflow
- —
- DSCR
- —
- Eligible?
- —
Short-term bridge; refi at stabilization.
Rent comps 15 comps
| Address | Beds | Baths | Sqft | Rent | $/sqft | DOM | Units | Dist |
|---|---|---|---|---|---|---|---|---|
| 3301 Arena Blvd Sacramento, CA | 1.0–3.0 | 1.0–2.5 | 952 | $2,300 | $2.42 | 1d | 1 | 0.21mi |
| 4450 El Centro Rd Sacramento, CA | 1.0 | 1.0 | 845 | $2,014 | $2.38 | 1d | 9 | 0.51mi |
| 4200 E Commerce Way #1012 Sacramento, CA | 2.0 | 2.0 | 958 | $1,795 | $1.87 | 43d | 1 | 0.73mi |
| 4200 E Commerce Way Sacramento, CA | 1.0–2.0 | 1.0–2.0 | 812 | $1,695 | $2.09 | 4d | 2 | 0.76mi |
| 4190 E Commerce Way Sacramento, CA | 1.0–3.0 | 1.0–2.0 | 940 | $2,675 | $2.85 | 1d | 20 | 0.82mi |
| 4800 Westlake Pkwy Sacramento, CA | 1.0–2.0 | 1.5–2.5 | 1214 | $2,250 | $1.85 | 1d | 3 | 0.83mi |
| 3610 Duckhorn Dr Sacramento, CA | 1.0–3.0 | 1.0–2.0 | 927 | $2,635 | $2.84 | 1d | 29 | 0.96mi |
| 3791 E Commerce Way Sacramento, CA | 2.0 | 1.0–2.0 | 865 | $2,970 | $3.43 | 2d | 21 | 1.04mi |
| 3761 E Commerce Way Sacramento, CA | 2.0 | 1.0–2.0 | 865 | $3,231 | $3.74 | 1d | 29 | 1.08mi |
| 2201 Arena Blvd Sacramento, CA | 1.0–2.0 | 1.0–2.0 | 1015 | $2,777 | $2.74 | 2d | 14 | 1.18mi |
| 4800 Kokomo Dr Sacramento, CA | 1.0–3.0 | 1.0–3.5 | 1229 | $2,906 | $2.36 | 1d | 26 | 1.19mi |
| 4101 Innovator Dr Sacramento, CA | 1.0–2.0 | 1.0–2.0 | 950 | $2,695 | $2.84 | 1d | 10 | 1.30mi |
| 4100 Innovator Dr Sacramento, CA | 2.0 | 1.0–2.0 | 860 | $2,990 | $3.47 | 1d | 18 | 1.39mi |
| 3351 Duckhorn Dr Sacramento, CA | 1.0 | 1.0 | 981 | $2,030 | $2.07 | 1d | 8 | 1.41mi |
| 2490 Quiet Trail Ln Sacramento, CA | 1.0–3.0 | 1.0–2.0 | 1113 | $2,899 | $2.60 | 1d | 14 | 1.41mi |
Listing history 2 events
-
2026-06-01status $54,900 Pending 13 DOM
-
2026-05-31days on market $54,900 Active 13 DOM
ⓘ Source: listings_history table (triggers on properties + properties_extension) + one-shot
backfill from property_details.listing_events for pre-trigger history.
Tax reassessment forecast CA · Resets to sale price
- Current annual tax
- $746 · $62/mo
- Projected year-2 tax
- $746 · $62/mo
- Expected delta
- $0/yr ($0/mo · 0.0%)
ⓘ Screening estimate from a state-policy table — verify with the county assessor before closing.
Climate risk First Street
- Flood 4/10 Moderate FEMA zone A99 · 20% chance over 30 yrs
- Wildfire 5/10 Major
- Heat 7/10 Severe 7 d/yr ≥103°F today · 14 d/yr by 30 yrs out
- Wind 1/10 Low
- Air quality 10/10 Extreme 27 unhealthy d/yr today · 33 by 30 yrs out
Nearby sold comps map
Loading sold comps map…
Walkable amenities ~0.75 mi
Loading nearby amenities…
Taxation est. · year 1
- Rental income
- $28,487
- − Mortgage interest
- −$3,075
- − Property taxes
- −$746
- − Insurance
- −$1,777
- − Repairs & maintenance
- −$2,279
- − Management
- −$2,279
- − Depreciation
- −$1,597
- Taxable income
- $16,734
- Est. tax owed @ 24.0%
- −$4,016
- After-tax cash flow
- $12,511/yr
For passive investors: Depreciation is non-cash, so a rental often shows a tax loss while cash-flowing — sheltering income. Rental losses are passive: they offset passive income freely, and up to $25,000/yr can offset ordinary (W-2) income if you actively participate and your MAGI is under $100k (phasing out to $0 by $150k); unused losses carry forward. On sale, claimed depreciation is recaptured at up to 25%, and gains may owe capital-gains tax (a 1031 exchange can defer both). Figures are a year-1 estimate at your 24.0% rate — not tax advice; consult a CPA.
Schools (NCES district)
- District
- Natomas Unified
- NCES district ID
- 0600036
- Math proficiency
- 33% ▼ -1.00%
- Reading proficiency
- 60% ▲ 13.00%
- Median HH income
- $67,969
- Composite
- 41.49/100
- National rank
- #3457
- State rank
- #155 of 517 in CA
Livability — Sacramento
- Score
- 71/100
- State rank
- #218
- US rank
- #6957
Category grades
Schools grade is shown separately in the Schools card above.
Census & demographics
- Census place
- Sacramento, CA
- County
- Sacramento County · 1,539,646 people
- City population
- 761,410
- Metro
- Sacramento-Roseville-Folsom, CA
- Population (ZIP)
- 36,245
- Household income
- $101,260
- Rent vs Own
- Severe rent burden
- 1444.0
Population outlook (Sacramento County) Hauer SSP2
- Today (2025)
- 1,660,763 people
- By 2030
- 1,732,990 · +4.3%
- By 2040
- 1,855,755 · +11.7%
- By 2050
- 1,941,335 · +16.9%
- By 2075
- 2,046,162 · +23.2%
- By 2100
- 1,961,444 · +18.1%
Race, ethnicity, and origin ACS 2023
- Neighborhood character
- Highly diverse neighborhood (Simpson 0.78)
- Race & ethnicity
- Asian 29% Hispanic / Latino 28% White 19% Two or more races 16% Black 15% Pacific Islander 1%
- Hispanic origin (detail)
- Mexican 21%
- Common ancestry
- Lithuanian 2% Subsaharan African 1% Russian 1%
- Foreign-born
- 30% · Canada, China, Vietnam
- Languages at home
- 58% English-only · Spanish 15% Other Indo-European 14% Other Asian/Pacific 3%
Political lean MEDSL · Sacramento
- 2024 margin
- D (+19.7) · D 58.1% · R 38.4% · Other 3.5%
- 2008→2024 swing
- +0.7pp no change · 2008: 19.0pp · 2024: 19.7pp
- All cycles
- 2024: D+19.7 2020: D+25.3 2016: D+23.7 2012: D+16.3 2008: D+19.0
Not yet ingested
- Civics
- —
Market trends
- HPI YoY
- ▼ -45.12%
- Current HPI
- 295.8305
- Rent YoY
- ▲ 0.82%
- Metro
- Sacramento-Roseville-Folsom, CA
- State GDP YoY
- ▲ 3.21%
- F500 in state
- 116
Industry mix (Fortune 500 HQ in CA)
| Industry | F500 HQs | Revenue |
|---|---|---|
| Technology | 27 | $1,492B |
|
||
| Financial Services | 3 | $174B |
|
||
| Retail | 3 | $44B |
|
||
| Insurance | 3 | $26B |
|
||
| Media / Entertainment | 2 | $115B |
|
||
| Pharmaceuticals / Biotech | 2 | $62B |
|
||
Property tax history
+0.3%/yrLatest (2025): $746 · -9.4% YoY. Source: county tax records.
Cash-flow waterfall
monthlySold comps — $/sqft
last 12 mo · ≤1 miLoading sold comps…