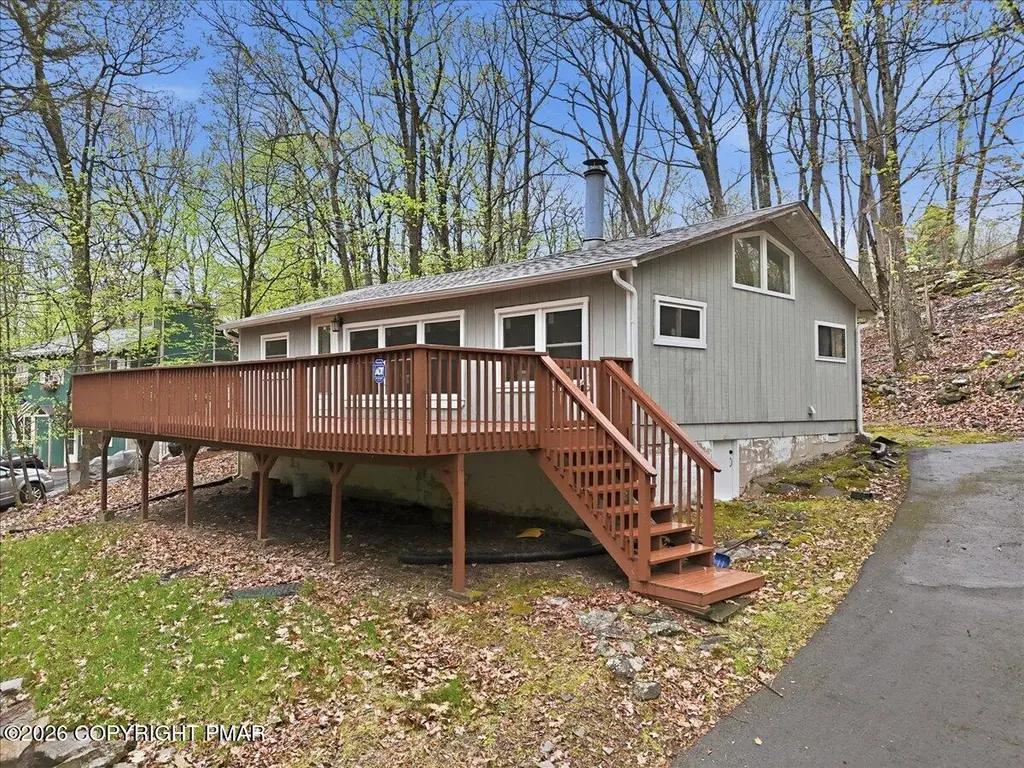
112 Fairview Dr · Pocono Ranch Lands, PA
Flood risk 1/10 · Minimal
- FEMA flood zone
- X (unshaded)
- Chance of flooding over 30 yrs
- 0.0%
- Est. flood insurance / yr
- $473 – $860
Fire risk 4/10 · Minor
- Est. fire insurance / yr
- $511 – $949
Heat risk 3/10 · Minor
- Hot days now (above 95°F)
- 7 days/yr
- Hot days in 30 yrs
- 15 days/yr
Wind risk 4/10 · Minor
- Chance of severe wind over 30 yrs
- 8.0%
Air-quality risk 2/10 · Minimal
- Unhealthy air days now
- 1 days/yr
- Unhealthy air days in 30 yrs
- 2 days/yr
Risk factors via First Street. Map © Google.
Why this score? — see what drove the B grade
The composite is a weighted blend of 9 inputs, each scored 0–100. Each bar is that input's sub-score; the figure is the points it added to the 100-point composite (weight × sub-score).
- Cash flow +23.0/30.0
- ARV discount +13.6/15.0
- Appreciation +10.0/10.0
- DSCR +7.4/10.0
- 1% rule +6.8/10.0
- Schools +4.7/10.0
- Livability +3.3/5.0
- Rent growth +2.5/5.0
- Condition / age +2.2/5.0
$160,000
🖨 Deal sheet (PDF) 📄 Offer letter ✓ Due diligence
Listing remarks
Charming 3-bedroom, 1-bath ranch nestled in the desirable Wild Acres community. This warm and inviting home features an open-concept floor plan with stunning vaulted beamed ceilings that create a spacious yet cozy atmosphere. The bright living area flows seamlessly into the dining space and kitchen, making it perfect for entertaining or relaxing weekends in the Poconos. Enjoy comfortable one-floor living with generously sized bedrooms, natural light throughout, and a layout designed for easy living. Whether you're looking for a primary residence, vacation getaway, or investment opportunity, this property offers the perfect blend of charm and convenience. Located in the amenity-filled Wild A
Key facts
- Outdoor recreation
- Close to lakes
- One-floor living
Tags
Property features AI
Finance
- HOA & community: Homeowners association with gated community and security; Community amenities include pool, tennis courts, and picnic area; HOA fee $1,200 annually (about $100/month)
Exterior
- Parking: 4 off-street paved parking spaces
- Security: Security system
- Utilities: Public water; Septic tank sewer
- Home design: Single-family house; Residential property
- Construction: House construction; Crawl space foundation
- Exterior features: Deck; Shingle roof; Residential lot in Wild Acres subdivision
Interior
- Kitchen: Electric range; Refrigerator; Dishwasher
- Flooring: Carpet; Hardwood
- Bathrooms: 1 full bathroom
- Heating & cooling: Baseboard heating (electric); Ductless cooling
- Interior features: Eat-in kitchen; Unfurnished; Main-level laundry; Crawl space basement; Wood-burning fireplace in the living room
- Laundry & utility: Washer; Dryer
Neighborhood map
What this means for you Summary
Snapshot
- This is a 3-bed/1.0-bath single-family listed at $160k. Condition is rated fair.
Deal economics
- At list price, monthly cash flow is $284 ($3k/yr) — positive.
- The deal already cash-flows at list — no discount required.
- Meets the 1% rule at list price ($2k rent vs $160k).
- Cap rate 8.4% vs local median 4.5% in Pocono Ranch Lands — top-decile yield for the area; either an underpriced asset or a hidden risk that comps aren't pricing in. Stress-test before assuming the spread holds.
Location & tenants
- Location reads 66/100 on livability (#1,037 in PA) — a middle-class / working-renter tenant base. Strengths: crime A+, cost of living A+, housing A; Watch: employment D, health & safety D, amenities F.
- Delaware Valley SD (rural): math 41% / reading 66% proficiency, ranked #121 of 539 in PA (top 22%) — acceptable for families but not a draw, mixed tenant base, ~2y average lease.
- Zoned schools: Delaware Valley Hs (math 77% / reading 75%, grade A-, #25 of 437 statewide, top 6%, 1,418 students, 37% FRL).
- Zoned-school proficiency averages 76% at this address vs 54% district-wide (+22 pts) — the actual schools serving this property are materially stronger than the Delaware Valley SD average implies; a family-tenant draw the district grade alone would hide.
- Market conditions: 213 active listings in the ZIP; 213 units permitted in Pike County in 2024 (0 in 5+ unit buildings).
Forward outlook
- In year one you build about $17k of equity ($1k loan paydown + $16k appreciation (10.0% local appreciation)).
- Pike County population projected at -25% by 2050 — secular population decline; favor cash flow + early exit over multi-decade hold.
- At projected returns (10.0% appreciation + 3.0% rent growth), your $45k cash investment doubles in ~3 years — after that, you're playing with house money.
- By year 3, paydown + projected appreciation supports a ~$43k cash-out refi (75% LTV) — recoverable capital for the next deal without selling this one.
Negotiation context
- Only 8 days on market — expect competitive offers; lowballing is unlikely to land.
Questions for the listing agent
- Have any recent inspections been done? Can we get a copy of the seller's disclosures and any deferred-maintenance estimates?
- Built in 1975 — when were the roof, HVAC, electrical panel, plumbing, and water heater last replaced?
- What does the HOA fee cover, when was the last increase, and are there any pending special assessments or reserve-fund shortfalls?
- Is there a deadline driving the sale (1031 exchange, divorce, estate, relocation)? That informs how much negotiation room exists.
- Schools are F-rated, which usually means shorter tenancies and higher turnover. Who's the typical renter profile here, and what's been the actual vacancy rate?
- What's the average days-on-market for RENTAL listings here right now (not sales)? A rising rental-DOM trend means longer vacancies and softer asking-rent achievability than the comps imply.
- What's the recent tenant-quality profile in this submarket — average credit score on applications, eviction rate, late-payment / NSF rate, and stable-employment percentage? A property-management company in the area should have these aggregated.
- How much new for-sale + rental construction is in the pipeline within 1–3 miles? Heavy new supply typically softens prices + rents 12–24 months out; constrained supply supports both.
Investment metrics
- 1% rule
- 1.18% ✓
- Cap rate
- 8.42%
- Cash-on-cash
- 7.60%
- DSCR
- 1.34
- GRM
- 7.1
CMA / ARV
- ARV (on-the-fly)
- $185,136
- Comps found
- 9
Show comp detail 9 sales within ~0.75 mi
| Address | Dist | Beds/Ba | Sqft | Sold | Price | $/sf | Match |
|---|---|---|---|---|---|---|---|
| 109 Autumn Rd | 0.22mi | 3/1.0 | 864 (-5%) | 10mo | $170,000 | $197 | 72 |
| 147 Spring Dr | 0.31mi | 3/1.0 | 1,008 (+10%) | 11mo | $222,000 | $220 | 59 |
| 112 Keystone Ct | 0.26mi | 2/1.0 (-1) | 960 (+5%) | 21mo | $188,837 | $197 | 57 |
| 107 Summer Dr | 0.25mi | 2/1.0 (-1) | 984 (+8%) | 18mo | $200,000 | $203 | 55 |
| 158 Mountain Lake Dr | 0.30mi | 2/1.0 (-1) | 864 (-5%) | 24mo | $130,000 | $150 | 53 |
| 159 Sandstone Dr | 0.35mi | 2/1.0 (-1) | 781 (-14%) | 6mo | $106,000 | $136 | 50 |
| 260 High Ridge Rd | 0.57mi | 3/1.0 | 960 (+5%) | 18mo | $235,000 | $245 | 49 |
| 164 Westwood Dr | 0.52mi | 2/1.0 (-1) | 992 (+9%) | 15mo | $215,000 | $217 | 44 |
| 310 Wild Acres Dr | 0.54mi | 2/1.0 (-1) | 848 (-7%) | 19mo | $182,500 | $215 | 43 |
Match score weights: distance 35% · size 25% · config 20% · recency 20%. Top-matched comps best support the ARV.
Projected returns pro-forma
10.0% appreciation · 3.0% rent growth · sell at horizon
- IRR
- 29.8%
- Equity multiple
- 3.35×
- Total profit
- $105,295
- Equity at exit
- $144,141
- IRR
- 25.9%
- Equity multiple
- 7.61×
- Total profit
- $296,050
- Equity at exit
- $310,845
Cash invested: $44,800 (down + closing). Projections, not guarantees.
Landlord ↔ Tenant lean methodology
- Overall (STATE)
- 62 Landlord-Friendly
- State Pennsylvania
- 62 Landlord-Friendly · EVEN
- County
- — inherits STATE
- City
- — inherits STATE
ZIP-level market 18328
- Home prices YoY
- 18.1%
- Active inventory
- 213
- Price-to-rent
- 7.1×
Monthly cashflow live
- Estimated rent
- $1,885 medium interval (Pro) →
- Mortgage (P&I)
- −$839
- Tax est. 1.5%
- −$200 /mo · $2,400/yr
- Insurance
- −$67
- HOA
- −$100
- Vacancy / Maint / Mgmt
- −$396
- Net cashflow
- $284
Break-even live
Sensitivity live
| Price | -10% $394 | -5% $339 | +0% $284 | +5% $228 | +10% $173 |
|---|---|---|---|---|---|
| Rent | -10% $135 | -5% $209 | +0% $284 | +5% $358 | +10% $433 |
| Rate | -1.0pp $364 | -0.5pp $324 | base $284 | +0.5pp $242 | +1.0pp $200 |
UW: 25.0% down · 7.5% · 30yr · 1.5% tax · 5.0% vac · 8.0% maint · 8.0% mgmt
Financing live
Cash to close
- Down payment
- $40,000
- Closing costs
- $4,800
- Reserves months
- —
- Total cash needed
- —
Loan-product check · same deal, 3 products live
Conventional
25% down · 7.5% · 30yr
- Down + closing
- —
- Monthly P&I
- —
- Monthly cashflow
- —
- DSCR
- —
- Eligible?
- —
Personal DTI + credit; lowest rate.
DSCR
20% down · 8.5% · 30yr
- Down + closing
- —
- Monthly P&I
- —
- Monthly cashflow
- —
- DSCR
- —
- Eligible?
- —
No personal income docs; deal must DSCR.
Hard money
10% down · 12.0% · 12mo
- Down + closing
- —
- Monthly P&I
- —
- Monthly cashflow
- —
- DSCR
- —
- Eligible?
- —
Short-term bridge; refi at stabilization.
HOA detail
- Monthly dues
- $100 · $1,200/yr
Listing history 1 events
-
2026-05-19$160,000 Active
ⓘ Source: listings_history table (triggers on properties + properties_extension) + one-shot
backfill from property_details.listing_events for pre-trigger history.
Climate risk First Street
- Flood 1/10 Low FEMA zone X (unshaded) · 0% chance over 30 yrs
- Wildfire 4/10 Moderate
- Heat 3/10 Moderate 7 d/yr ≥95°F today · 15 d/yr by 30 yrs out
- Wind 4/10 Moderate 8% chance of damaging wind over 30 yrs
- Air quality 2/10 Low 1 unhealthy d/yr today · 2 by 30 yrs out
Nearby sold comps map
Loading sold comps map…
Walkable amenities ~0.75 mi
Loading nearby amenities…
Taxation est. · year 1
- Rental income
- $22,623
- − Mortgage interest
- −$8,962
- − Property taxes
- −$2,400
- − Insurance
- −$800
- − Repairs & maintenance
- −$1,810
- − Management
- −$1,810
- − HOA
- −$1,200
- − Depreciation
- −$4,655
- Taxable income
- $986
- Est. tax owed @ 24.0%
- −$237
- After-tax cash flow
- $3,167/yr
For passive investors: Depreciation is non-cash, so a rental often shows a tax loss while cash-flowing — sheltering income. Rental losses are passive: they offset passive income freely, and up to $25,000/yr can offset ordinary (W-2) income if you actively participate and your MAGI is under $100k (phasing out to $0 by $150k); unused losses carry forward. On sale, claimed depreciation is recaptured at up to 25%, and gains may owe capital-gains tax (a 1031 exchange can defer both). Figures are a year-1 estimate at your 24.0% rate — not tax advice; consult a CPA.
Condition & rehab AI · 13 photos
This home requires moderate repairs and maintenance, including painting the exterior and interior, and repairing the deck. These updates can significantly increase its resale and rental value.
Repairs flagged
- Moderate Deck — Signs of wear and tear on the deck planks.
- Moderate Exterior siding — Weathered appearance of the siding, possibly requiring repainting or replacement.
- Minor Roof — No visible damage, but may need inspection for minor issues
Value-add opportunities
- Resale Painting the exterior siding — Fresh paint can significantly improve curb appeal and home value.
- Both Deck repair — A repaired deck can enhance both the aesthetic and functionality of the home.
- Resale Painting the interior walls — Fresh paint can make the interior look more modern and appealing to potential buyers.
Renovation cost estimate screening
| Repair item | Severity | Est. cost |
|---|---|---|
| Deck · Signs of wear and tear on the deck planks. | Moderate | $3,000–15,000 |
| Exterior siding · Weathered appearance of the siding, possibly requiring repainting or replacement. | Moderate | $3,000–15,000 |
| Roof · No visible damage, but may need inspection for minor issues | Minor | $500–3,000 |
| Total estimated repair cost · 3 items | $6,500–33,000 |
Value-add ROI direction
- Resale Painting the exterior siding — Fresh paint can significantly improve curb appeal and home value. ↑
- Both Deck repair — A repaired deck can enhance both the aesthetic and functionality of the home. ↑
- Resale Painting the interior walls — Fresh paint can make the interior look more modern and appealing to potential buyers. ↑
ⓘ Cost ranges are severity-bucket heuristics (US national rule-of-thumb). Get contractor quotes + a written scope before underwriting a rehab budget.
Schools (NCES district)
- District
- Delaware Valley SD
- NCES district ID
- 4207530
- Math proficiency
- 41% ▼ -12.00%
- Reading proficiency
- 66% ▼ -9.00%
- Median HH income
- $64,202
- Composite
- 46.95/100
- National rank
- #2359
- State rank
- #121 of 539 in PA
Livability — Pocono Ranch Lands
- Score
- 66/100
- State rank
- #1037
- US rank
- #11566
Category grades
Schools grade is shown separately in the Schools card above.
Census & demographics
- Population (ZIP)
- 8,061
Population outlook (Pike County) Hauer SSP2
- Today (2025)
- 53,548 people
- By 2030
- 51,622 · -3.6%
- By 2040
- 46,490 · -13.2%
- By 2050
- 40,372 · -24.6%
- By 2075
- 31,951 · -40.3%
- By 2100
- 26,821 · -49.9%
Race, ethnicity, and origin ACS 2023
- Neighborhood character
- Predominantly White (85%)
- Race & ethnicity
- White 85% Hispanic / Latino 10% Two or more races 8%
- Hispanic origin (detail)
- Puerto Rican 5%
- Common ancestry
- Scotch-Irish 6% Romanian 6% Iranian 4%
- Foreign-born
- 9% · Canada, Jamaica
- Languages at home
- 86% English-only · Spanish 6% Russian/Polish/Slavic 5% Other Indo-European 2%
Political lean MEDSL · Pike
- 2024 margin
- Strong R (+24.1) · D 37.6% · R 61.6%
- 2008→2024 swing
- -19.8pp toward R · 2008: -4.2pp · 2024: -24.1pp
- All cycles
- 2024: R+24.1 2020: R+19.0 2016: R+26.0 2012: R+11.0 2008: R+4.2
Not yet ingested
- Civics
- —
Market trends
- HPI YoY
- ▲ 38.13%
- Current HPI
- 248.4494
- Rent YoY
- —
- Metro
- —
- State GDP YoY
- ▲ 1.68%
- F500 in state
- 34
Industry mix (Fortune 500 HQ in PA)
| Industry | F500 HQs | Revenue |
|---|---|---|
| Healthcare | 2 | $309B |
|
||
| Insurance | 2 | $27B |
|
||
| Telecommunications / Media | 1 | $124B |
|
||
| Industrial Distribution | 1 | $22B |
|
||
| Financial Services | 1 | $20B |
|
||
| Chemicals / Materials | 1 | $18B |
|
||
Price history
1 event — show timeline
- 2026-05-19 Listed $160,000 PMAR
Cash-flow waterfall
monthlySold comps — $/sqft
last 12 mo · ≤1 miLoading sold comps…