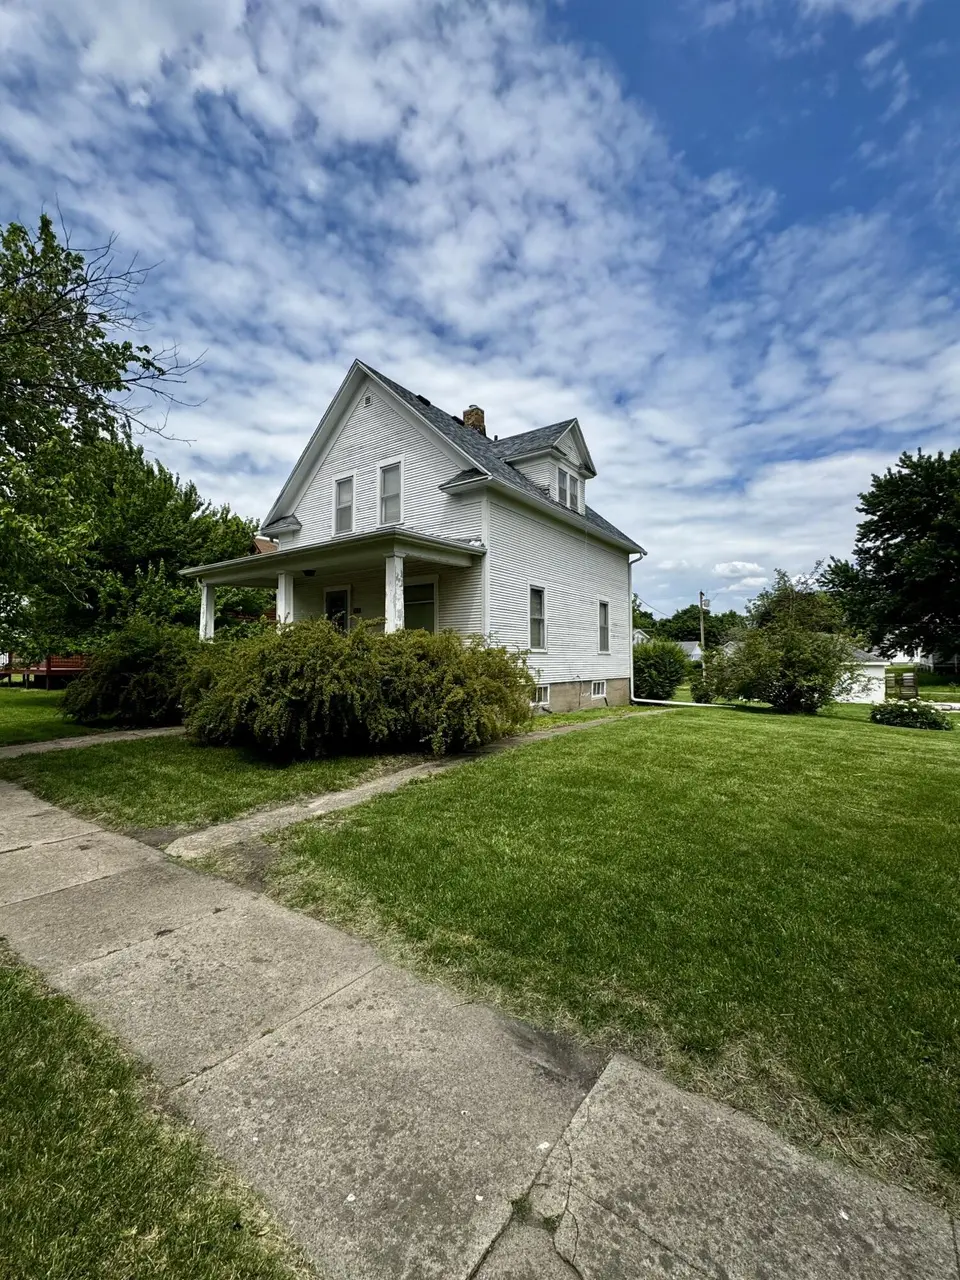
918 Burns St · Stratford, IA
Flood risk 1/10 · Minimal
- FEMA flood zone
- X (unshaded)
- Chance of flooding over 30 yrs
- 0.0%
- Est. flood insurance / yr
- $473 – $860
Fire risk 3/10 · Minor
- Est. fire insurance / yr
- $902 – $1,676
Heat risk 3/10 · Minor
- Hot days now (above 102°F)
- 7 days/yr
- Hot days in 30 yrs
- 16 days/yr
Wind risk 2/10 · Minimal
- Chance of severe wind over 30 yrs
- —
Air-quality risk 1/10 · Minimal
- Unhealthy air days now
- 0 days/yr
- Unhealthy air days in 30 yrs
- 0 days/yr
Risk factors via First Street. Map © Google.
Why this score? — see what drove the C+ grade
The composite is a weighted blend of 9 inputs, each scored 0–100. Each bar is that input's sub-score; the figure is the points it added to the 100-point composite (weight × sub-score).
- Cash flow +21.6/30.0
- Appreciation +7.9/10.0
- ARV discount +7.5/15.0
- DSCR +6.9/10.0
- 1% rule +5.5/10.0
- Schools +5.2/10.0
- Livability +3.5/5.0
- Rent growth +2.5/5.0
- Condition / age +2.5/5.0
$95,000
🖨 Deal sheet (PDF) 📄 Offer letter ✓ Due diligence
Listing remarks
Charming 2-story home featuring 2 bedrooms and 1¾ baths with classic character throughout. Beautiful oak built-ins, hardwood floors, and original oak woodwork add warmth and timeless appeal. Enjoy both a welcoming front porch and a relaxing back porch. The spacious yard provides plenty of room for outdoor activities, gardening, or future improvements. An additional lot located at 912 Burns is included with the sale, offering added space and potential. Conveniently situated within walking distance of the school. Great opportunity for homeowners, investors, or buyers looking to add their personal touch. Property is being sold AS IS.
Key facts
- Spacious yard
- Oak built-ins
- Hardwood floors
Tags
Property features AI
Exterior
- Parking: Has garage
- Utilities: Public sewer
- Home design: Single-family residence; Two levels; Residential property
- Construction: Wood siding; Block foundation
- Exterior features: Deck
Interior
- Flooring: Vinyl; Hardwood; Carpet
- Bathrooms: 1 full bathroom; 1 three-quarter bathroom
- Heating & cooling: Natural gas heating; Central air conditioning
- Interior features: Vinyl, hardwood, and carpet flooring; Full, unfinished basement
- Laundry & utility: Main level laundry
Neighborhood map
What this means for you Summary
Snapshot
- This is a 3-bed/1.0-bath single-family listed at $95k.
Deal economics
- At list price, monthly cash flow is $144 ($2k/yr) — positive.
- The deal already cash-flows at list — no discount required.
- Meets the 1% rule at list price ($998 rent vs $95k).
Location & tenants
- Location reads 69/100 on livability (#393 in IA) — a middle-class / working-renter tenant base. Strengths: cost of living A+, housing A+, health & safety A+; Watch: employment D+, amenities F, commute F.
- Stratford Community School District (rural): math 60% / reading 60% proficiency, ranked #283 of 330 in IA (top 86%) — acceptable for families but not a draw, mixed tenant base, ~2y average lease.
- Market conditions: 7 active listings in the ZIP; 29 units permitted in Hamilton County in 2024 (5 in 5+ unit buildings).
Forward outlook
- In year one you build about $6k of equity ($657 loan paydown + $5k appreciation (5.8% local appreciation)).
- Hamilton County population projected at -15% by 2050 — secular population decline; favor cash flow + early exit over multi-decade hold.
- At projected returns (5.8% appreciation + 3.0% rent growth), your $27k cash investment doubles in ~4 years — after that, you're playing with house money.
- By year 6, paydown + projected appreciation supports a ~$33k cash-out refi (75% LTV) — recoverable capital for the next deal without selling this one.
Negotiation context
- Only 13 days on market — expect competitive offers; lowballing is unlikely to land.
Risks & watch-outs
- Watch-outs: built in 1903 — expect roof / HVAC / electrical / plumbing capex.
Questions for the listing agent
- Built in 1903 — when were the roof, HVAC, electrical panel, plumbing, and water heater last replaced?
- Is there a deadline driving the sale (1031 exchange, divorce, estate, relocation)? That informs how much negotiation room exists.
- Schools are B-rated — typically a magnet for longer-tenancy family renters. What's the average tenant stay here, and is there a school-zone premium baked into asking?
- What's the average days-on-market for RENTAL listings here right now (not sales)? A rising rental-DOM trend means longer vacancies and softer asking-rent achievability than the comps imply.
- What's the recent tenant-quality profile in this submarket — average credit score on applications, eviction rate, late-payment / NSF rate, and stable-employment percentage? A property-management company in the area should have these aggregated.
- How much new for-sale + rental construction is in the pipeline within 1–3 miles? Heavy new supply typically softens prices + rents 12–24 months out; constrained supply supports both.
Investment metrics
- 1% rule
- 1.05% ✓
- Cap rate
- 8.11%
- Cash-on-cash
- 6.49%
- DSCR
- 1.29
- GRM
- 7.9
CMA / ARV
No comps found within radius.
Projected returns pro-forma
5.78% appreciation · 3.0% rent growth · sell at horizon
- IRR
- 20.2%
- Equity multiple
- 2.33×
- Total profit
- $35,348
- Equity at exit
- $58,391
- IRR
- 19.6%
- Equity multiple
- 4.65×
- Total profit
- $97,161
- Equity at exit
- $104,761
Cash invested: $26,600 (down + closing). Projections, not guarantees.
Landlord ↔ Tenant lean methodology
- Overall (STATE)
- 83 Strongly Landlord-Friendly
- State Iowa
- 83 Strongly Landlord-Friendly · R+6
- County
- — inherits STATE
- City
- — inherits STATE
ZIP-level market 50249
- Home prices YoY
- 3.2%
- Active inventory
- 7
- Price-to-rent
- 7.9×
Monthly cashflow live
- Estimated rent
- $998 medium interval (Pro) →
- Mortgage (P&I)
- −$498
- Tax from tax record
- −$107 /mo · $1,280/yr
- Insurance
- −$40
- HOA
- −$0
- Vacancy / Maint / Mgmt
- −$210
- Net cashflow
- $144
Break-even live
Sensitivity live
| Price | -10% $198 | -5% $171 | +0% $144 | +5% $117 | +10% $90 |
|---|---|---|---|---|---|
| Rent | -10% $65 | -5% $104 | +0% $144 | +5% $183 | +10% $223 |
| Rate | -1.0pp $192 | -0.5pp $168 | base $144 | +0.5pp $119 | +1.0pp $94 |
UW: 25.0% down · 7.5% · 30yr · 1.5% tax · 5.0% vac · 8.0% maint · 8.0% mgmt
Financing live
Cash to close
- Down payment
- $23,750
- Closing costs
- $2,850
- Reserves months
- —
- Total cash needed
- —
Loan-product check · same deal, 3 products live
Conventional
25% down · 7.5% · 30yr
- Down + closing
- —
- Monthly P&I
- —
- Monthly cashflow
- —
- DSCR
- —
- Eligible?
- —
Personal DTI + credit; lowest rate.
DSCR
20% down · 8.5% · 30yr
- Down + closing
- —
- Monthly P&I
- —
- Monthly cashflow
- —
- DSCR
- —
- Eligible?
- —
No personal income docs; deal must DSCR.
Hard money
10% down · 12.0% · 12mo
- Down + closing
- —
- Monthly P&I
- —
- Monthly cashflow
- —
- DSCR
- —
- Eligible?
- —
Short-term bridge; refi at stabilization.
Listing history 10 events
-
2026-06-15statusdays on market $95,000 Pending 13 DOM
-
2026-06-13days on market $95,000 Active 12 DOM
-
2026-06-12days on market $95,000 Active 11 DOM
-
2026-06-09days on market $95,000 Active 8 DOM
-
2026-06-08days on market $95,000 Active 7 DOM
-
2026-06-07days on market $95,000 Active 6 DOM
-
2026-06-05days on market $95,000 Active 4 DOM
-
2026-06-04days on market $95,000 Active 2 DOM
-
2026-06-02remarks 638-char remark
-
2026-06-02$95,000 Active 1 DOM
ⓘ Source: listings_history table (triggers on properties + properties_extension) + one-shot
backfill from property_details.listing_events for pre-trigger history.
Tax reassessment forecast IA · Partial reset (capped growth)
- Current annual tax
- $1,280 · $107/mo
- Projected year-2 tax
- $1,386 · $115/mo
- Expected delta
- +$106/yr (+$9/mo · 8.3%)
ⓘ Screening estimate from a state-policy table — verify with the county assessor before closing.
Climate risk First Street
- Flood 1/10 Low FEMA zone X (unshaded) · 0% chance over 30 yrs
- Wildfire 3/10 Moderate
- Heat 3/10 Moderate 7 d/yr ≥102°F today · 16 d/yr by 30 yrs out
- Wind 2/10 Low
- Air quality 1/10 Low 0 unhealthy d/yr today · 0 by 30 yrs out
Nearby sold comps map
Loading sold comps map…
Walkable amenities ~0.75 mi
Loading nearby amenities…
Taxation est. · year 1
- Rental income
- $11,974
- − Mortgage interest
- −$5,321
- − Property taxes
- −$1,280
- − Insurance
- −$475
- − Repairs & maintenance
- −$958
- − Management
- −$958
- − Depreciation
- −$2,764
- Taxable income
- $218
- Est. tax owed @ 24.0%
- −$52
- After-tax cash flow
- $1,674/yr
For passive investors: Depreciation is non-cash, so a rental often shows a tax loss while cash-flowing — sheltering income. Rental losses are passive: they offset passive income freely, and up to $25,000/yr can offset ordinary (W-2) income if you actively participate and your MAGI is under $100k (phasing out to $0 by $150k); unused losses carry forward. On sale, claimed depreciation is recaptured at up to 25%, and gains may owe capital-gains tax (a 1031 exchange can defer both). Figures are a year-1 estimate at your 24.0% rate — not tax advice; consult a CPA.
Schools (NCES district)
- District
- Stratford Community School District
- NCES district ID
- 1927480
- Math proficiency
- 60% ▼ -10.00%
- Reading proficiency
- 60% ▼ -10.00%
- Median HH income
- $47,548
- Composite
- 52.45/100
- National rank
- #3407
- State rank
- #283 of 330 in IA
Livability — Stratford
- Score
- 69/100
- State rank
- #393
- US rank
- #8311
Category grades
Schools grade is shown separately in the Schools card above.
Census & demographics
- Census place
- Stratford, IA
- Population (ZIP)
- 1,256
Population outlook (Hamilton County) Hauer SSP2
- Today (2025)
- 14,602 people
- By 2030
- 14,210 · -2.7%
- By 2040
- 13,312 · -8.8%
- By 2050
- 12,469 · -14.6%
- By 2075
- 11,449 · -21.6%
- By 2100
- 10,806 · -26.0%
Race, ethnicity, and origin ACS 2023
- Neighborhood character
- Predominantly White (92%)
- Race & ethnicity
- White 92% Black 4% Hispanic / Latino 1% Two or more races 1%
- Common ancestry
- Portuguese 3% Slovak 3% Lithuanian 2%
- Foreign-born
- 1% · Canada
- Languages at home
- 99% English-only · Spanish 0%
Political lean MEDSL · Hamilton
- 2024 margin
- Solid R (+33.3) · D 32.8% · R 66.1% · Other 1.1%
- 2008→2024 swing
- -34.6pp toward R · 2008: 1.3pp · 2024: -33.3pp
- All cycles
- 2024: R+33.3 2020: R+26.6 2016: R+22.9 2012: R+2.7 2008: D+1.3
Not yet ingested
- Civics
- —
Market trends
- HPI YoY
- ▲ 5.78%
- Current HPI
- 187.1688
- Rent YoY
- —
- Metro
- —
- State GDP YoY
- ▲ 2.48%
- F500 in state
- 4
Industry mix (Fortune 500 HQ in IA)
| Industry | F500 HQs | Revenue |
|---|---|---|
| Financial Services | 1 | $16B |
|
||
| Retail / Convenience | 1 | $15B |
|
||
Price history
1 event — show timeline
- 2026-06-01 Listed $95,000 CIBOR
Property tax history
+3.6%/yrLatest (2025): $1,280 · +3.8% YoY. Source: county tax records.
Cash-flow waterfall
monthlySold comps — $/sqft
last 12 mo · ≤1 miLoading sold comps…