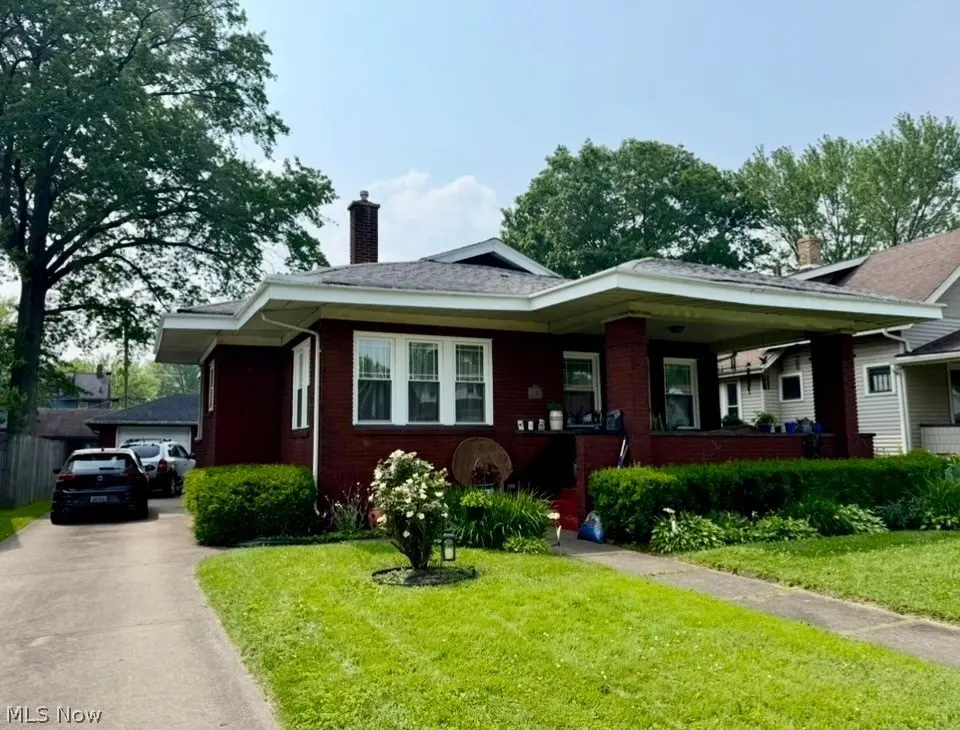
578 SE Oak Knoll Ave SE · Warren, OH
Flood risk 1/10 · Minimal
- FEMA flood zone
- X (unshaded)
- Chance of flooding over 30 yrs
- 0.0%
- Est. flood insurance / yr
- $473 – $860
Fire risk 1/10 · Minimal
- Est. fire insurance / yr
- $713 – $1,323
Heat risk 3/10 · Minor
- Hot days now (above 98°F)
- 7 days/yr
- Hot days in 30 yrs
- 17 days/yr
Wind risk 1/10 · Minimal
- Chance of severe wind over 30 yrs
- —
Air-quality risk 3/10 · Minor
- Unhealthy air days now
- 1 days/yr
- Unhealthy air days in 30 yrs
- 4 days/yr
Risk factors via First Street. Map © Google.
Why this score? — see what drove the C+ grade
The composite is a weighted blend of 9 inputs, each scored 0–100. Each bar is that input's sub-score; the figure is the points it added to the 100-point composite (weight × sub-score).
- Cash flow +24.6/30.0
- ARV discount +15.0/15.0
- DSCR +8.0/10.0
- 1% rule +5.5/10.0
- Livability +3.7/5.0
- Rent growth +2.5/5.0
- Condition / age +2.5/5.0
- Schools +2.2/10.0
- Appreciation +0.0/10.0
$95,000
🖨 Deal sheet (PDF) 📄 Offer letter ✓ Due diligence
Listing remarks MLS
Immaculate two bedroom home w/ 2 full baths, formal dining room, eat-in kitchen w/ appliances, partially remodeled main bath, new carpet in most rooms, new roof 2006, furnace 2008, waterproofed basement, glass block windows, upgraded electric service, large covered front porch. Very clean home! Double garage, privacy fence on 3 sides belong to neighbors.
Key facts
- Flexible spaces
- Abundant built-ins
- Updated windows
Tags
Property features AI
Finance
- HOA & community: Neighborhood features include sidewalks, street lights, nearby park and medical services
Exterior
- Parking: Detached garage and driveway; Concrete surfaces; Garage faces front with garage door opener; Lighted parking areas
- Utilities: Public water; Public sewer
- Home design: Single-story home; Faces east; Brick construction
- Construction: Brick construction; Asphalt roof; Block foundation; Built according to public records
- Exterior features: Private front and back yard, landscaped; Private entrance; Covered front and side porch and patio; Rain gutters; Outdoor lighting; Partial privacy fencing around backyard
Interior
- Bedrooms: Two main-level bedrooms
- Bathrooms: Two full bathrooms, one located on the main level
- Heating & cooling: Central air conditioning; Forced air heating
- Interior features: Blinds and window treatments throughout; Double pane, insulated, low-emissivity and ENERGY STAR windows; Storm windows and screens; Window coverings and drapes; Laundry chute; Common full basement with exterior entry, interior entry, walk-up and walk-out access
- Laundry & utility: Washer hookup and gas dryer hookup in basement; Laundry tub and sink
Neighborhood map
What this means for you Summary
Snapshot
- This is a 2-bed/1.0-bath single-family listed at $95k.
Deal economics
- At list price, monthly cash flow is $197 ($2k/yr) — positive.
- The deal already cash-flows at list — no discount required.
- Meets the 1% rule at list price ($996 rent vs $95k).
- Cap rate 8.8% vs local median 6.0% in Warren — top-decile yield for the area; either an underpriced asset or a hidden risk that comps aren't pricing in. Stress-test before assuming the spread holds.
Location & tenants
- Location reads 73/100 on livability (#312 in OH) — a middle-class / working-renter tenant base. Strengths: cost of living A+, health & safety A+, housing A; Watch: crime D-, commute F, employment F.
- Warren City (urban): math 22% / reading 32% proficiency, ranked #599 of 656 in OH (top 91%) — low school quality limits family demand, transient renter base, plan for 1-2y turnover; 75% free/reduced lunch — lower-income household profile, screen leases tightly.
- Market conditions: 107 active listings in the ZIP; 7 comparable units currently listed for rent nearby; rentals at typical pace (median 14d on market — plan ~3-4 weeks tenant-placement turnaround); 129 units permitted in Trumbull County in 2024 (0 in 5+ unit buildings).
Forward outlook
- Local home prices are declining (-3.0%/yr); year-one equity from $657 of loan paydown is wiped out by about $3k of value loss. Plan a longer hold.
- Trumbull County population projected at -22% by 2050 — secular population decline; favor cash flow + early exit over multi-decade hold.
Negotiation context
- Only 9 days on market — expect competitive offers; lowballing is unlikely to land.
- 2 sale attempts since 15y ago with the ask held roughly flat each time — persistent listings suggest the price (not the market) is what's stuck; bring a comps-based counter.
- Current owner paid $45k; list at $95k implies a 111% gain — meaningful room to come down on a strong offer.
Risks & watch-outs
- Watch-outs: built in 1922 — expect roof / HVAC / electrical / plumbing capex.
Questions for the listing agent
- Built in 1922 — when were the roof, HVAC, electrical panel, plumbing, and water heater last replaced?
- Is there a deadline driving the sale (1031 exchange, divorce, estate, relocation)? That informs how much negotiation room exists.
- Crime grade is D in this area — have there been break-ins, vandalism, or insurance claims at this property in the last 3 years? What carrier currently insures it and at what premium?
- What's the average days-on-market for RENTAL listings here right now (not sales)? A rising rental-DOM trend means longer vacancies and softer asking-rent achievability than the comps imply.
- What's the recent tenant-quality profile in this submarket — average credit score on applications, eviction rate, late-payment / NSF rate, and stable-employment percentage? A property-management company in the area should have these aggregated.
- How much new for-sale + rental construction is in the pipeline within 1–3 miles? Heavy new supply typically softens prices + rents 12–24 months out; constrained supply supports both.
Investment metrics
- 1% rule
- 1.05% ✓
- Cap rate
- 8.78%
- Cash-on-cash
- 8.88%
- DSCR
- 1.40
- GRM
- 7.9
CMA / ARV
- ARV (on-the-fly)
- $117,276
- Comps found
- 12
Show comp detail 12 sales within ~0.75 mi
| Address | Dist | Beds/Ba | Sqft | Sold | Price | $/sf | Match |
|---|---|---|---|---|---|---|---|
| 419 Kenilworth Ave SE | 0.12mi | 2/1.0 | 1,008 (-0%) | 10mo | $127,000 | $126 | 86 |
| 2026 Ada Ave SE | 0.17mi | 3/1.0 (+1) | 1,065 (+5%) | 5mo | $89,900 | $84 | 74 |
| 1205 Belle St SE | 0.46mi | 2/1.0 | 984 (-3%) | 4mo | $21,000 | $21 | 71 |
| 327 Adelaide | 0.19mi | 3/1.0 (+1) | 1,144 (+13%) | 6mo | $127,900 | $112 | 60 |
| 424 Kenilworth Ave NE | 0.63mi | 3/1.0 (+1) | 1,008 (-0%) | 7mo | $35,263 | $35 | 59 |
| 336 Willard Ave SE | 0.36mi | 3/1.5 (+1) | 1,136 (+12%) | 2mo | $130,000 | $114 | 54 |
| 191 Willard Ave NE | 0.52mi | 2/1.5 | 1,089 (+8%) | 10mo | $126,000 | $116 | 53 |
| 1006 Trumbull Ave | 0.67mi | 3/1.0 (+1) | 1,080 (+7%) | 9mo | $150,000 | $139 | 45 |
| 213 Kenmore Ave NE | 0.51mi | 3/1.0 (+1) | 1,142 (+13%) | 6mo | $116,000 | $102 | 45 |
| 1104 Kenmore Ave SE | 0.45mi | 3/2.0 (+1) | 888 (-12%) | 8mo | $129,000 | $145 | 43 |
| 200 Willard Ave SE | 0.40mi | 3/1.5 (+1) | 1,162 (+15%) | 8mo | $139,000 | $120 | 43 |
| 696 Meadowbrook Ave SE | 0.69mi | 3/1.5 (+1) | 1,140 (+13%) | 2mo | $150,000 | $132 | 38 |
Match score weights: distance 35% · size 25% · config 20% · recency 20%. Top-matched comps best support the ARV.
Projected returns pro-forma
-3.0% appreciation · 3.0% rent growth · sell at horizon
- IRR
- -2.9%
- Equity multiple
- 0.89×
- Total profit
- $-2,880
- Equity at exit
- $14,165
- IRR
- 6.8%
- Equity multiple
- 1.51×
- Total profit
- $13,534
- Equity at exit
- $8,214
Cash invested: $26,600 (down + closing). Projections, not guarantees.
Landlord ↔ Tenant lean methodology
- Overall (STATE)
- 73 Landlord-Friendly
- State Ohio
- 73 Landlord-Friendly · R+6
- County
- — inherits STATE
- City
- — inherits STATE
ZIP-level market 44483
- Home prices YoY
- -16.3%
- Active inventory
- 107
- Price-to-rent
- 7.9×
Monthly cashflow live
- Estimated rent
- $996 high interval (Pro) →
- Mortgage (P&I)
- −$498
- Tax from tax record
- −$52 /mo · $626/yr
- Insurance
- −$40
- HOA
- −$0
- Vacancy / Maint / Mgmt
- −$209
- Net cashflow
- $197
Break-even live
Sensitivity live
| Price | -10% $251 | -5% $224 | +0% $197 | +5% $170 | +10% $143 |
|---|---|---|---|---|---|
| Rent | -10% $118 | -5% $158 | +0% $197 | +5% $236 | +10% $276 |
| Rate | -1.0pp $245 | -0.5pp $221 | base $197 | +0.5pp $172 | +1.0pp $147 |
UW: 25.0% down · 7.5% · 30yr · 1.5% tax · 5.0% vac · 8.0% maint · 8.0% mgmt
Financing live
Cash to close
- Down payment
- $23,750
- Closing costs
- $2,850
- Reserves months
- —
- Total cash needed
- —
Loan-product check · same deal, 3 products live
Conventional
25% down · 7.5% · 30yr
- Down + closing
- —
- Monthly P&I
- —
- Monthly cashflow
- —
- DSCR
- —
- Eligible?
- —
Personal DTI + credit; lowest rate.
DSCR
20% down · 8.5% · 30yr
- Down + closing
- —
- Monthly P&I
- —
- Monthly cashflow
- —
- DSCR
- —
- Eligible?
- —
No personal income docs; deal must DSCR.
Hard money
10% down · 12.0% · 12mo
- Down + closing
- —
- Monthly P&I
- —
- Monthly cashflow
- —
- DSCR
- —
- Eligible?
- —
Short-term bridge; refi at stabilization.
Rent comps 7 comps
| Address | Beds | Baths | Sqft | Rent | $/sqft | DOM | Units | Dist |
|---|---|---|---|---|---|---|---|---|
| 840 Woodbine Ave SE Unit 838 Warren, OH | 2.0 | 1.0 | 1009 | $1,000 | $0.99 | 14d | 1 | 0.30mi |
| 2232 Youngstown Rd SE Warren, OH | 2.0 | 1.0 | 800 | $1,050 | $1.31 | 14d | 1 | 0.45mi |
| 1151 Kenilworth Ave SE Warren, OH | 2.0 | 1.0 | 1207 | $900 | $0.75 | 14d | 1 | 0.48mi |
| 341 Charles AVE Warren, OH | 3.0 | 1.0 | 1232 | $1,100 | $0.89 | 44d | 1 | 0.58mi |
| 259 Perkinswood Blvd NE Warren, OH | 1.0–2.0 | 1.0 | 743 | $845 | $1.14 | 14d | 3 | 0.62mi |
| 1216 Hollywood St NE Warren, OH | 3.0 | 1.0 | 1158 | $1,050 | $0.91 | 21d | 1 | 1.14mi |
| 407 Washington St NE Niles, OH | 3.0 | 1.5 | 1388 | $1,250 | $0.90 | 14d | 1 | 1.29mi |
Listing history 9 events
-
2026-06-18status $95,000 Pending 9 DOM
-
2026-06-17days on market $95,000 Active 9 DOM
-
2026-06-16days on market $95,000 Active 8 DOM
-
2026-06-15days on market $95,000 Active 7 DOM
-
2026-06-14days on market $95,000 Active 5 DOM
-
2026-06-13days on market $95,000 Active 4 DOM
-
2026-06-10days on market $95,000 Active 2 DOM
-
2026-06-09remarks 699-char remark
-
2026-06-09$95,000 Active 1 DOM
ⓘ Source: listings_history table (triggers on properties + properties_extension) + one-shot
backfill from property_details.listing_events for pre-trigger history.
Tax reassessment forecast OH · Partial reset (capped growth)
- Current annual tax
- $626 · $52/mo
- Projected year-2 tax
- $1,054 · $88/mo
- Expected delta
- +$428/yr (+$36/mo · 68.4%)
ⓘ Screening estimate from a state-policy table — verify with the county assessor before closing.
Climate risk First Street
- Flood 1/10 Low FEMA zone X (unshaded) · 0% chance over 30 yrs
- Wildfire 1/10 Low
- Heat 3/10 Moderate 7 d/yr ≥98°F today · 17 d/yr by 30 yrs out
- Wind 1/10 Low
- Air quality 3/10 Moderate 1 unhealthy d/yr today · 4 by 30 yrs out
Nearby sold comps map
Loading sold comps map…
Walkable amenities ~0.75 mi
Loading nearby amenities…
Taxation est. · year 1
- Rental income
- $11,952
- − Mortgage interest
- −$5,321
- − Property taxes
- −$626
- − Insurance
- −$475
- − Repairs & maintenance
- −$956
- − Management
- −$956
- − Depreciation
- −$2,764
- Taxable income
- $853
- Est. tax owed @ 24.0%
- −$205
- After-tax cash flow
- $2,158/yr
For passive investors: Depreciation is non-cash, so a rental often shows a tax loss while cash-flowing — sheltering income. Rental losses are passive: they offset passive income freely, and up to $25,000/yr can offset ordinary (W-2) income if you actively participate and your MAGI is under $100k (phasing out to $0 by $150k); unused losses carry forward. On sale, claimed depreciation is recaptured at up to 25%, and gains may owe capital-gains tax (a 1031 exchange can defer both). Figures are a year-1 estimate at your 24.0% rate — not tax advice; consult a CPA.
Schools (NCES district)
- District
- Warren City
- NCES district ID
- 3904499
- Math proficiency
- 22% ▼ -16.00%
- Reading proficiency
- 32% ▼ -9.00%
- Median HH income
- $28,222
- Composite
- 21.6/100
- National rank
- #8299
- State rank
- #599 of 656 in OH
Livability — Warren
- Score
- 73/100
- State rank
- #312
- US rank
- #5068
Category grades
Schools grade is shown separately in the Schools card above.
Census & demographics
- Census place
- Warren, OH
- County
- Trumbull County · 61,158 people
- City population
- 25,805
- Metro
- Youngstown-Warren-Boardman, OH-PA
- Population (ZIP)
- 25,805
- Household income
- $49,017
- Rent vs Own
- Severe rent burden
- 989.0
Population outlook (Trumbull County) Hauer SSP2
- Today (2025)
- 191,696 people
- By 2030
- 184,015 · -4.0%
- By 2040
- 166,810 · -13.0%
- By 2050
- 149,857 · -21.8%
- By 2075
- 115,769 · -39.6%
- By 2100
- 83,617 · -56.4%
Race, ethnicity, and origin ACS 2023
- Neighborhood character
- Predominantly White (77%)
- Race & ethnicity
- White 77% Black 14% Two or more races 7% Hispanic / Latino 4%
- Common ancestry
- Romanian 3% Slovak 2% Italian 1%
- Foreign-born
- 2% · Canada
- Languages at home
- 96% English-only · Other Indo-European 2% Spanish 2%
Political lean MEDSL · Trumbull
- 2024 margin
- R (+16.8) · D 41.2% · R 58.0%
- 2008→2024 swing
- -39.2pp toward R · 2008: 22.4pp · 2024: -16.8pp
- All cycles
- 2024: R+16.8 2020: R+10.6 2016: R+6.4 2012: D+22.2 2008: D+22.4
Not yet ingested
- Civics
- —
Market trends
- HPI YoY
- ▼ -42.50%
- Current HPI
- 218.3455
- Rent YoY
- —
- Metro
- Youngstown-Warren-Boardman, OH-PA
- State GDP YoY
- ▲ 1.98%
- F500 in state
- 48
Industry mix (Fortune 500 HQ in OH)
| Industry | F500 HQs | Revenue |
|---|---|---|
| Insurance | 3 | $145B |
|
||
| Industrial Machinery | 3 | $49B |
|
||
| Financial Services | 3 | $24B |
|
||
| Consumer Goods | 2 | $93B |
|
||
| Aerospace / Defense | 2 | $47B |
|
||
| Utilities | 2 | $33B |
|
||
Price history
+93.9% since first listed5 events — show timeline
- 2026-06-07 Listed $95,000 MLSNOW
- 2012-04-10 Sold (Public Records) $45,000 Public Records
- 2012-04-09 Sold (MLS) $45,000 MLSNOW
- 2011-09-16 Listed $55,000 MLSNOW
- 1995-08-15 Sold (Public Records) $49,000 Public Records
Property tax history
+4.7%/yrLatest (2025): $626 · -0.8% YoY. Source: county tax records.
Cash-flow waterfall
monthlySold comps — $/sqft
last 12 mo · ≤1 miLoading sold comps…