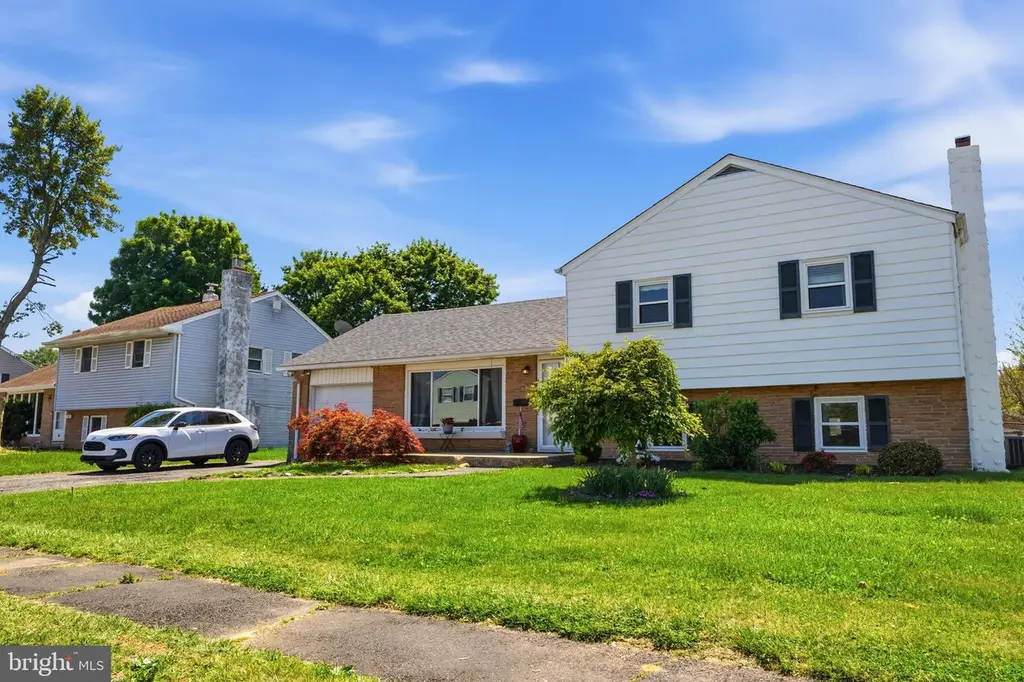
10 Darwin Rd · Bear, DE
Flood risk 1/10 · Minimal
- FEMA flood zone
- X (unshaded)
- Chance of flooding over 30 yrs
- 0.0%
- Est. flood insurance / yr
- $473 – $860
Fire risk 1/10 · Minimal
- Est. fire insurance / yr
- $476 – $884
Heat risk 7/10 · Major
- Hot days now (above 102°F)
- 7 days/yr
- Hot days in 30 yrs
- 15 days/yr
Wind risk 6/10 · Moderate
- Chance of severe wind over 30 yrs
- 27.0%
Air-quality risk 4/10 · Minor
- Unhealthy air days now
- 3 days/yr
- Unhealthy air days in 30 yrs
- 5 days/yr
Risk factors via First Street. Map © Google.
Why this score? — see what drove the C- grade
The composite is a weighted blend of 9 inputs, each scored 0–100. Each bar is that input's sub-score; the figure is the points it added to the 100-point composite (weight × sub-score).
- Cash flow +16.1/30.0
- ARV discount +15.0/15.0
- DSCR +5.0/10.0
- 1% rule +3.7/10.0
- Livability +3.7/5.0
- Rent growth +3.0/5.0
- Schools +2.5/10.0
- Condition / age +2.5/5.0
- Appreciation +0.0/10.0
$299,900
🖨 Deal sheet (PDF) 📄 Offer letter ✓ Due diligence
Listing remarks MLS
Nice 3 Bedroom, 2 Full Bath single family home with over 2,000 sq. ft of living space, in the subdivision of Glendale. This home features hardwood floors throughout, updated amenities, and has real wood fireplace. There is a large fenced backyard as well as plenty of driveway parking.
Key facts
- 0.23 acre lot
- Garage
- Built 1954
Property features AI
Exterior
- Parking: Attached garage with front entry and inside access; Garage door opener; Covered parking; Asphalt driveway with about 4 driveway spaces; On-street parking; Total of about 5 garage/parking spaces
- Utilities: Public water; Public sewer; Electric hot water
- Home design: Detached property; Pitched shingle roof; Good condition; Fee simple ownership; Lot dimensions approximately 75 x 135
- Construction: Brick, vinyl siding and aluminum siding exterior; Concrete perimeter foundation with crawl space; Built above grade; Fully finished basement
- Exterior features: Sidewalks; Patio(s); Porch(es)
Interior
- Kitchen: Electric oven/range; Refrigerator; Dishwasher; Eat-in kitchen with pantry
- Bedrooms: Three bedrooms on the upper level
- Flooring: Hardwood; Luxury vinyl plank; Ceramic tile
- Bathrooms: Two full bathrooms (one on upper level, one on lower level)
- Heating & cooling: 90% efficient forced air heating (oil-fired); Central heating; Central air conditioning (electric)
- Interior features: Attic; Tub with shower; Walk-in shower; Ceiling fans; Dining area; Family room off the kitchen; Eat-in kitchen; Pantry; Recessed lighting; Water treatment system; Wood floors; Plaster walls
- Laundry & utility: Washer and dryer included; Laundry on lower floor; Electric hot water; Water conditioner (owned)
Neighborhood map
What this means for you Summary
Snapshot
- This is a 3-bed/1.5-bath single-family listed at $300k.
Deal economics
- At list price, monthly cash flow is $153 ($2k/yr) — positive.
- The deal already cash-flows at list — no discount required.
- To meet the 1% rule (rent ≥ 1% of price), the offer needs to be $261k (12.8% below list).
- Recommended offer: $261k (12.8% below list) — sets the bar for 1% rule.
- Cap rate 6.9% vs local median 4.7% in Bear — top-decile yield for the area; either an underpriced asset or a hidden risk that comps aren't pricing in. Stress-test before assuming the spread holds.
Location & tenants
- Location reads 73/100 on livability (#8 in DE) — a middle-class / working-renter tenant base. Strengths: housing A+, employment A-, cost of living A-; Watch: crime C-, amenities F, commute F.
- Christina School District (suburban): math 22% / reading 33% proficiency, ranked #18 of 26 in DE (top 69%) — low school quality limits family demand, transient renter base, plan for 1-2y turnover.
- Zoned schools: Leasure (May B.) Elementary School (math 17% / reading 32%, grade F, #67 of 105 statewide, top 65%, 335 students, 0% FRL); Kirk (George V.) Middle School (math 10% / reading 27%, grade F, #30 of 36 statewide, top 86%, 742 students, 0% FRL); Christiana High School (math 49% / reading 66%, grade C, #3 of 40 statewide, top 5%, 1,256 students, 0% FRL) — zoned schools average 0% FRL vs 50% district-wide (50 pts lower); this property's tenant base skews higher-income than the district average.
- Market conditions: Rents rising (+2.2%/yr); 154 active listings in the ZIP; 2 comparable units currently listed for rent nearby; solid renter incomes; 1,367 units permitted in New Castle County in 2024 (201 in 5+ unit buildings).
- This rent runs 34% of the median local income ($92k/yr) — at the standard rent-burdened threshold; future hikes will face affordability resistance.
Forward outlook
- Local home prices are declining (-3.0%/yr); year-one equity from $2k of loan paydown is wiped out by about $9k of value loss. Plan a longer hold.
- New Castle County population projected at +9% by 2050 — modest demand growth; plan on rents tracking national, not racing it.
Negotiation context
- Only 3 days on market — expect competitive offers; lowballing is unlikely to land.
- 7 sale attempts since 26y ago with the ask held roughly flat each time — persistent listings suggest the price (not the market) is what's stuck; bring a comps-based counter.
Risks & watch-outs
- Watch-outs: built in 1954 — expect roof / HVAC / electrical / plumbing capex.
- Climate carrying-cost: major wind risk, 27% chance of damaging wind over 30y; extreme-heat days projected 7→15/yr by 2055 (HVAC capex compounding) — expect insurance premiums to compound above CPI over the hold.
Questions for the listing agent
- Built in 1954 — when were the roof, HVAC, electrical panel, plumbing, and water heater last replaced?
- Is there a deadline driving the sale (1031 exchange, divorce, estate, relocation)? That informs how much negotiation room exists.
- Schools are D-rated, which usually means shorter tenancies and higher turnover. Who's the typical renter profile here, and what's been the actual vacancy rate?
- What's the average days-on-market for RENTAL listings here right now (not sales)? A rising rental-DOM trend means longer vacancies and softer asking-rent achievability than the comps imply.
- What's the recent tenant-quality profile in this submarket — average credit score on applications, eviction rate, late-payment / NSF rate, and stable-employment percentage? A property-management company in the area should have these aggregated.
- How much new for-sale + rental construction is in the pipeline within 1–3 miles? Heavy new supply typically softens prices + rents 12–24 months out; constrained supply supports both.
Investment metrics
- 1% rule
- 0.87% ✗
- Cap rate
- 6.90%
- Cash-on-cash
- 2.18%
- DSCR
- 1.10
- GRM
- 9.6
CMA / ARV
- ARV (median comp)
- $419,859
- List price
- $299,900
- Delta
- -28.57%
- Verdict
- UNDERPRICED
- Comps
- 20 within 1.0 mi
Show comp detail 12 sales within ~0.75 mi
| Address | Dist | Beds/Ba | Sqft | Sold | Price | $/sf | Match |
|---|---|---|---|---|---|---|---|
| 10 Darwin Rd | 0.00mi | 3/2.0 | 2,075 (0%) | 0mo | $345,000 | $166 | 98 |
| 8 Cassandra Rd | 0.16mi | 3/2.0 | 2,225 (+7%) | 8mo | $405,000 | $182 | 72 |
| 18 Regal Ct | 0.35mi | 3/2.5 | 2,025 (-2%) | 10mo | $449,000 | $222 | 67 |
| 106 Kingston Dr | 0.58mi | 3/2.0 | 2,025 (-2%) | 4mo | $450,000 | $222 | 64 |
| 5 Vellan Dr | 0.63mi | 3/2.0 | 2,125 (+2%) | 4mo | $485,000 | $228 | 61 |
| 254 Rushes Dr | 0.31mi | 3/3.0 | 1,925 (-7%) | 7mo | $450,000 | $234 | 61 |
| 47 Rawlings Dr | 0.67mi | 4/2.5 (+1) | 2,050 (-1%) | 2mo | $450,000 | $220 | 57 |
| 515 Hambleton Ln | 0.63mi | 2/2.0 (-1) | 2,175 (+5%) | 0mo | $470,000 | $216 | 56 |
| 121 Wynnefield Rd | 0.52mi | 4/2.5 (+1) | 2,200 (+6%) | 5mo | $510,000 | $232 | 52 |
| 16 Lochview Dr | 0.46mi | 4/2.5 (+1) | 2,350 (+13%) | 6mo | $525,000 | $223 | 42 |
| 109 Pigeon Run Dr | 0.68mi | 4/2.5 (+1) | 2,300 (+11%) | 0mo | $500,000 | $217 | 41 |
| 2 Foxfield Ct | 0.69mi | 4/2.5 (+1) | 2,325 (+12%) | 5mo | $487,000 | $209 | 35 |
Match score weights: distance 35% · size 25% · config 20% · recency 20%. Top-matched comps best support the ARV.
Projected returns pro-forma
-3.0% appreciation · 2.19% rent growth · sell at horizon
- IRR
- -13.7%
- Equity multiple
- 0.51×
- Total profit
- $-41,033
- Equity at exit
- $44,716
- IRR
- -6.1%
- Equity multiple
- 0.62×
- Total profit
- $-31,965
- Equity at exit
- $25,930
Cash invested: $83,972 (down + closing). Projections, not guarantees.
Landlord ↔ Tenant lean methodology
- Overall (STATE)
- 70 Landlord-Friendly
- State Delaware
- 70 Landlord-Friendly · D+7
- County
- — inherits STATE
- City
- — inherits STATE
ZIP-level market 19702
- Rents YoY
- 2.2%
- Active inventory
- 154
- Price-to-rent
- 9.6×
Monthly cashflow live
- Estimated rent
- $2,614 medium interval (Pro) →
- Mortgage (P&I)
- −$1,573
- Tax from tax record
- −$214 /mo · $2,572/yr
- Insurance
- −$125
- HOA
- −$0
- Vacancy / Maint / Mgmt
- −$549
- Net cashflow
- $153
Break-even live
Sensitivity live
| Price | -10% $323 | -5% $238 | +0% $153 | +5% $68 | +10% $-17 |
|---|---|---|---|---|---|
| Rent | -10% $-54 | -5% $50 | +0% $153 | +5% $256 | +10% $359 |
| Rate | -1.0pp $304 | -0.5pp $229 | base $153 | +0.5pp $75 | +1.0pp $-4 |
UW: 25.0% down · 7.5% · 30yr · 1.5% tax · 5.0% vac · 8.0% maint · 8.0% mgmt
Financing live
Cash to close
- Down payment
- $74,975
- Closing costs
- $8,997
- Reserves months
- —
- Total cash needed
- —
Loan-product check · same deal, 3 products live
Conventional
25% down · 7.5% · 30yr
- Down + closing
- —
- Monthly P&I
- —
- Monthly cashflow
- —
- DSCR
- —
- Eligible?
- —
Personal DTI + credit; lowest rate.
DSCR
20% down · 8.5% · 30yr
- Down + closing
- —
- Monthly P&I
- —
- Monthly cashflow
- —
- DSCR
- —
- Eligible?
- —
No personal income docs; deal must DSCR.
Hard money
10% down · 12.0% · 12mo
- Down + closing
- —
- Monthly P&I
- —
- Monthly cashflow
- —
- DSCR
- —
- Eligible?
- —
Short-term bridge; refi at stabilization.
Rent comps 2 comps
| Address | Beds | Baths | Sqft | Rent | $/sqft | DOM | Units | Dist |
|---|---|---|---|---|---|---|---|---|
| 1 Iris Pl Newark, DE | 3.0 | 2.0 | 1525 | $2,400 | $1.57 | 18d | 1 | 0.96mi |
| 1 Kennedy Cir Bear, DE | 2.0–3.0 | 2.0–3.0 | 1702 | $3,315 | $1.95 | 0d | 34 | 1.09mi |
Listing history 27 events
-
2026-05-12status Pending 3110-char remark
-
2026-05-09historical 3110-char remark
-
2026-05-07$299,900 Active 3110-char remark
-
2026-04-17historical $299,900 3110-char remark
-
2014-04-09soldstatus $157,000
-
2014-04-04soldstatus $157,000 286-char remark
Show marketing remark (286 chars)
Nice 3 Bedroom, 2 Full Bath single family home with over 2,000 sq. ft of living space, in the subdivision of Glendale. This home features hardwood floors throughout, updated amenities, and has real wood fireplace. There is a large fenced backyard as well as plenty of driveway parking.
-
2014-04-04soldstatus $157,000 Sold
Show marketing remark (286 chars)
Nice 3 Bedroom, 2 Full Bath single family home with over 2,000 sq. ft of living space, in the subdivision of Glendale. This home features hardwood floors throughout, updated amenities, and has real wood fireplace. There is a large fenced backyard as well as plenty of driveway parking.
-
2014-03-05status Under Contract
Show marketing remark (286 chars)
Nice 3 Bedroom, 2 Full Bath single family home with over 2,000 sq. ft of living space, in the subdivision of Glendale. This home features hardwood floors throughout, updated amenities, and has real wood fireplace. There is a large fenced backyard as well as plenty of driveway parking.
-
2014-02-11historical 286-char remark
Show marketing remark (286 chars)
Nice 3 Bedroom, 2 Full Bath single family home with over 2,000 sq. ft of living space, in the subdivision of Glendale. This home features hardwood floors throughout, updated amenities, and has real wood fireplace. There is a large fenced backyard as well as plenty of driveway parking.
-
2013-12-20soldstatus $109,000
-
2013-11-25price $163,500 Active
Show marketing remark (286 chars)
Nice 3 Bedroom, 2 Full Bath single family home with over 2,000 sq. ft of living space, in the subdivision of Glendale. This home features hardwood floors throughout, updated amenities, and has real wood fireplace. There is a large fenced backyard as well as plenty of driveway parking.
-
2013-08-27$170,000 Active No-Show
Show marketing remark (286 chars)
Nice 3 Bedroom, 2 Full Bath single family home with over 2,000 sq. ft of living space, in the subdivision of Glendale. This home features hardwood floors throughout, updated amenities, and has real wood fireplace. There is a large fenced backyard as well as plenty of driveway parking.
-
2013-08-27$163,500 286-char remark
Show marketing remark (286 chars)
Nice 3 Bedroom, 2 Full Bath single family home with over 2,000 sq. ft of living space, in the subdivision of Glendale. This home features hardwood floors throughout, updated amenities, and has real wood fireplace. There is a large fenced backyard as well as plenty of driveway parking.
-
2013-03-16historical
-
2012-08-27$171,000
-
2012-06-10historical
-
2011-06-10$135,000
-
2007-10-02soldstatus $217,000
-
2007-09-28soldstatus $217,000
-
2007-08-19historical
-
2007-08-16$217,000
-
2000-07-05soldstatus $110,500
-
2000-06-29soldstatus $108,500
-
2000-05-16historical
-
2000-05-11$108,500
-
1986-03-01soldstatus $65,000
-
1985-03-01soldstatus $59,900
ⓘ Source: listings_history table (triggers on properties + properties_extension) + one-shot
backfill from property_details.listing_events for pre-trigger history.
Tax reassessment forecast DE · Partial reset (capped growth)
- Current annual tax
- $2,572 · $214/mo
- Projected year-2 tax
- $2,572 · $214/mo
- Expected delta
- $0/yr ($0/mo · 0.0%)
ⓘ Screening estimate from a state-policy table — verify with the county assessor before closing.
Climate risk First Street
- Flood 1/10 Low FEMA zone X (unshaded) · 0% chance over 30 yrs
- Wildfire 1/10 Low
- Heat 7/10 Severe 7 d/yr ≥102°F today · 15 d/yr by 30 yrs out
- Wind 6/10 Major 27% chance of damaging wind over 30 yrs
- Air quality 4/10 Moderate 3 unhealthy d/yr today · 5 by 30 yrs out
Nearby sold comps map
Loading sold comps map…
Walkable amenities ~0.75 mi
Loading nearby amenities…
Taxation est. · year 1
- Rental income
- $31,365
- − Mortgage interest
- −$16,799
- − Property taxes
- −$2,572
- − Insurance
- −$1,500
- − Repairs & maintenance
- −$2,509
- − Management
- −$2,509
- − Depreciation
- −$8,724
- Taxable loss
- −$3,248
- Est. tax savings @ 24.0%
- +$780
- After-tax cash flow
- $2,614/yr
For passive investors: Depreciation is non-cash, so a rental often shows a tax loss while cash-flowing — sheltering income. Rental losses are passive: they offset passive income freely, and up to $25,000/yr can offset ordinary (W-2) income if you actively participate and your MAGI is under $100k (phasing out to $0 by $150k); unused losses carry forward. On sale, claimed depreciation is recaptured at up to 25%, and gains may owe capital-gains tax (a 1031 exchange can defer both). Figures are a year-1 estimate at your 24.0% rate — not tax advice; consult a CPA.
Schools (NCES district)
- District
- Christina School District
- NCES district ID
- 1000200
- Math proficiency
- 22% ▼ -12.00%
- Reading proficiency
- 33% ▼ -5.00%
- Median HH income
- $58,838
- Composite
- 24.93/100
- National rank
- #7567
- State rank
- #18 of 26 in DE
Livability — Bear
- Score
- 73/100
- State rank
- #8
- US rank
- #5158
Category grades
Schools grade is shown separately in the Schools card above.
Census & demographics
- Census place
- Bear, DE
- County
- New Castle County · 483,412 people
- City population
- 42,984
- Metro
- Philadelphia-Camden-Wilmington, PA-NJ-DE-MD
- Population (ZIP)
- 55,683
- Household income
- $92,446
- Rent vs Own
- Severe rent burden
- 1421.0
Population outlook (New Castle County) Hauer SSP2
- Today (2025)
- 594,686 people
- By 2030
- 609,164 · +2.4%
- By 2040
- 632,154 · +6.3%
- By 2050
- 649,068 · +9.1%
- By 2075
- 687,771 · +15.7%
- By 2100
- 694,961 · +16.9%
Race, ethnicity, and origin ACS 2023
- Neighborhood character
- Highly diverse neighborhood (Simpson 0.73)
- Race & ethnicity
- White 38% Black 31% Hispanic / Latino 14% Asian 12% Two or more races 8%
- Hispanic origin (detail)
- Mexican 7% Puerto Rican 3%
- Common ancestry
- Romanian 3% Lithuanian 1% Slovak 1%
- Foreign-born
- 22% · Canada, China, South Korea
- Languages at home
- 73% English-only · Spanish 11% Other Indo-European 5% Other Asian/Pacific 3%
Political lean MEDSL · New Castle
- 2024 margin
- Solid D (+32.6) · D 65.5% · R 32.9% · Other 1.6%
- 2008→2024 swing
- -8.1pp toward R · 2008: 40.6pp · 2024: 32.6pp
- All cycles
- 2024: D+32.6 2020: D+37.1 2016: D+29.6 2012: D+34.1 2008: D+40.6
Not yet ingested
- Civics
- —
Market trends
- HPI YoY
- ▼ -241.79%
- Current HPI
- 248.8414
- Rent YoY
- ▲ 2.19%
- Metro
- Philadelphia-Camden-Wilmington, PA-NJ-DE-MD
- State GDP YoY
- —
- F500 in state
- 0
Price history
+476.0% since first listed28 events — show timeline
- 2026-06-19 Sold (MLS) $345,000 BRIGHT MLS
- 2026-05-12 Pending — BRIGHT MLS
- 2026-05-09 Listing Removed — BRIGHT MLS
- 2026-05-07 Listed $299,900 BRIGHT MLS
- 2026-04-17 Coming Soon $299,900 BRIGHT MLS
- 2014-04-09 Sold (Public Records) $157,000 Public Records
- 2014-04-04 Sold (MLS) $157,000 TREND
- 2014-04-04 Sold (MLS) $157,000 BRIGHT MLS
- 2014-03-05 Pending — TREND
- 2014-02-11 Listing Removed — BRIGHT MLS
- 2013-12-20 Sold (Public Records) $109,000 Public Records
- 2013-11-25 Price Changed $163,500 TREND
- 2013-08-27 Listed $170,000 TREND
- 2013-08-27 Listed $163,500 BRIGHT MLS
- 2013-03-16 Listing Removed — BRIGHT MLS
- 2012-08-27 Listed $171,000 BRIGHT MLS
- 2012-06-10 Listing Removed — BRIGHT MLS
- 2011-06-10 Listed $135,000 BRIGHT MLS
- 2007-10-02 Sold (Public Records) $217,000 Public Records
- 2007-09-28 Sold (MLS) $217,000 BRIGHT MLS
- 2007-08-19 Listing Removed — BRIGHT MLS
- 2007-08-16 Listed $217,000 BRIGHT MLS
- 2000-07-05 Sold (Public Records) $110,500 Public Records
- 2000-06-29 Sold (MLS) $108,500 BRIGHT MLS
- 2000-05-16 Listing Removed — BRIGHT MLS
- 2000-05-11 Listed $108,500 BRIGHT MLS
- 1986-03-01 Sold (Public Records) $65,000 Public Records
- 1985-03-01 Sold (Public Records) $59,900 Public Records
Property tax history
+3.8%/yrLatest (2024): $2,572 · +2.8% YoY. Source: county tax records.
Cash-flow waterfall
monthlySold comps — $/sqft
last 12 mo · ≤1 miLoading sold comps…