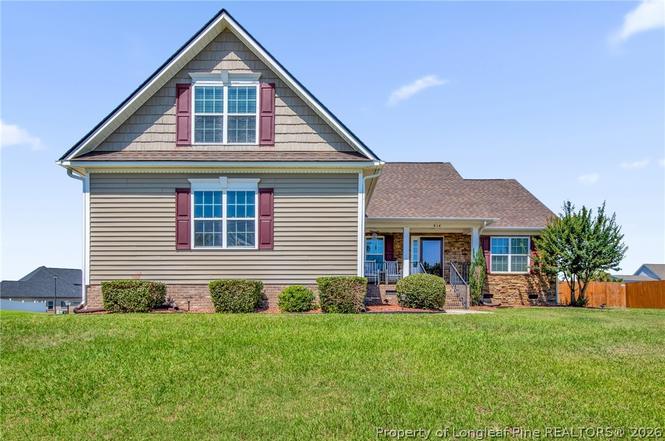
314 Bridle Dr · Rockfish, NC
Flood risk 1/10 · Minimal
- FEMA flood zone
- X (unshaded)
- Chance of flooding over 30 yrs
- 0.0%
- Est. flood insurance / yr
- $507 – $1,088
Fire risk 7/10 · Major
- Est. fire insurance / yr
- $906 – $1,684
Heat risk 7/10 · Major
- Hot days now (above 107°F)
- 7 days/yr
- Hot days in 30 yrs
- 16 days/yr
Wind risk 6/10 · Moderate
- Chance of severe wind over 30 yrs
- 73.0%
Air-quality risk 1/10 · Minimal
- Unhealthy air days now
- 0 days/yr
- Unhealthy air days in 30 yrs
- 0 days/yr
Risk factors via First Street. Map © Google.
Why this score? — see what drove the D+ grade
The composite is a weighted blend of 9 inputs, each scored 0–100. Each bar is that input's sub-score; the figure is the points it added to the 100-point composite (weight × sub-score).
- ARV discount +14.3/15.0
- Cash flow +12.7/30.0
- DSCR +3.8/10.0
- Livability +3.6/5.0
- Schools +3.2/10.0
- Rent growth +3.0/5.0
- 1% rule +2.9/10.0
- Condition / age +2.5/5.0
- Appreciation +0.0/10.0
$305,000
🖨 Deal sheet 📄 Offer letter ✓ Due diligence
Listing remarks MLS
Very attractive ranch w/ bonus sits handsomely on a corner lot w/ side entry double garage. Back yard has privacy fence, deck & screened porch. Stone front façade coupled w/ vinyl trim & a nice front porch offer a warm welcome. Hardwoods in Foyer, Formal Dining, Family Room & spacious Eat-in Kitchen. Refrigerator remains. Corner fireplace is attractive feature in family room. Split Bedrooms downstairs plus fourth bedroom & private bath & Bonus are upstairs. BROWNSTONE FARMS $218,000 4BR/3BA. Plus Bonus. Fenced. Screened Porch + Deck. Dbl Side entry garage. Vinyl & stone trim. Hardwoods. Foyer, Formal Dining, Tiled Kitchen, lrg Eat-in Area. Refrigerator remains. Corner FP in Family Room. Split plan/three BRs down. Bedroom, Bath & Bonus up. (314B)
Key facts
- Private bonus area
- Flexible floor plan
- Vaulted ceilings
Tags
Property features AI
Finance
- HOA & community: Homeowners association with annual fee of $260 (about $21.67/month); Curbs in community; Subdivision: Brownstone Farms
Exterior
- Parking: Attached 2-car garage; 2 covered parking spaces
- Utilities: Public water; Septic tank and holding tank
- Home design: Single-family residence; Residential property; Cleared lot
- Construction: Stone and vinyl siding exterior
- Exterior features: Porch with screened area; Storm doors; Back yard fencing; Shed(s)
Interior
- Kitchen: Refrigerator; Dishwasher; Disposal; Microwave; Range; Exhaust fan; Granite counters
- Bedrooms: Total rooms: 8
- Flooring: Carpet; Tile; Other
- Bathrooms: 3 full bathrooms
- Heating & cooling: Heat pump; Central air; Ceiling fans
- Interior features: Tray ceilings; Coffered ceilings; Ceiling fans; Double vanity; Granite counters; Storage; Walk-in closets; Gas log fireplace (1)
- Laundry & utility: Washer hookup; Crawl space
Neighborhood map
What this means for you Summary
Snapshot
- This is a 4-bed/2.5-bath single-family listed at $305k.
Deal economics
- At list price, monthly cash flow is $-31 ($-370/yr) — negative.
- To cash-flow at today's rent, offer at most $300k (1.8% below list).
- To meet the 1% rule (rent ≥ 1% of price), the offer needs to be $240k (21.3% below list).
- Recommended offer: $240k (21.3% below list) — sets the bar for 1% rule.
- Cap rate 6.2% vs local median 4.7% in Rockfish — top-decile yield for the area; either an underpriced asset or a hidden risk that comps aren't pricing in. Stress-test before assuming the spread holds.
Location & tenants
- Location reads 71/100 on livability (#108 in NC) — a middle-class / working-renter tenant base. Strengths: cost of living A+, housing A+, crime A; Watch: amenities F, commute F.
- Hoke County Schools (suburban): math 35% / reading 40% proficiency, ranked #123 of 178 in NC (top 69%) — families likely to look elsewhere, expect single-tenant / working-renter base with shorter leases.
- Zoned schools: Sandy Grove Middle (math 32% / reading 44%, grade F, #251 of 475 statewide, top 54%, 645 students, 99% FRL); Hoke County High (math 42% / reading 44%, grade F, #372 of 535 statewide, top 69%, 2,060 students, 100% FRL) — zoned schools average 100% FRL vs 57% district-wide (43 pts higher); higher-poverty schools than district average — tighter screening recommended.
- Market conditions: Rents rising (+1.9%/yr); 566 active listings in the ZIP; 4 comparable units currently listed for rent nearby; rentals at typical pace (median 23d on market — plan ~3-4 weeks tenant-placement turnaround); 685 units permitted in Hoke County in 2024 (0 in 5+ unit buildings).
- This rent runs 43% of the median local income ($66k/yr) — at the standard rent-burdened threshold; future hikes will face affordability resistance.
Forward outlook
- Local home prices are declining (-3.0%/yr); year-one equity from $2k of loan paydown is wiped out by about $9k of value loss. Plan a longer hold.
- Hoke County population projected at +36% by 2050 — long-run rental-demand tailwind backs the buy-and-hold thesis.
Negotiation context
- Only 1 days on market — expect competitive offers; lowballing is unlikely to land.
- 2 sale attempts since 11y ago with the ask held roughly flat each time — persistent listings suggest the price (not the market) is what's stuck; bring a comps-based counter.
- Current owner paid $213k; 43% above their basis — modest negotiation headroom, anchor on the comps not their cost.
Risks & watch-outs
- Climate carrying-cost: major wind risk, 73% chance of damaging wind over 30y; major wildfire risk; extreme-heat days projected 7→16/yr by 2055 (HVAC capex compounding) — expect insurance premiums to compound above CPI over the hold.
Questions for the listing agent
- What do current leases actually rent for vs. the listed asking? Can we see a recent rent roll and the last 12 months of T-12 income?
- What does the HOA fee cover, when was the last increase, and are there any pending special assessments or reserve-fund shortfalls?
- Is there a deadline driving the sale (1031 exchange, divorce, estate, relocation)? That informs how much negotiation room exists.
- Schools are A-rated — typically a magnet for longer-tenancy family renters. What's the average tenant stay here, and is there a school-zone premium baked into asking?
- The area grade is low — what's the realistic commute time and amenity access for the typical tenant pool here? Any planned neighborhood developments (good or bad) we should know about?
- What's the average days-on-market for RENTAL listings here right now (not sales)? A rising rental-DOM trend means longer vacancies and softer asking-rent achievability than the comps imply.
- What's the recent tenant-quality profile in this submarket — average credit score on applications, eviction rate, late-payment / NSF rate, and stable-employment percentage? A property-management company in the area should have these aggregated.
- How much new for-sale + rental construction is in the pipeline within 1–3 miles? Heavy new supply typically softens prices + rents 12–24 months out; constrained supply supports both.
Investment metrics
- 1% rule
- 0.79% ✗
- Cap rate
- 6.17%
- Cash-on-cash
- -0.43%
- DSCR
- 0.98
- GRM
- 10.6
CMA / ARV
- ARV (on-the-fly)
- $359,450
- Comps found
- 12
Show comp detail 12 sales within ~0.75 mi
| Address | Dist | Beds/Ba | Sqft | Sold | Price | $/sf | Match |
|---|---|---|---|---|---|---|---|
| 245 Bourbon St | 0.67mi | 4/2.5 | 2,350 (+3%) | 0mo | $352,500 | $150 | 63 |
| 297 Brownstone Dr | 0.26mi | 3/3.5 (-1) | 2,432 (+7%) | 7mo | $325,000 | $134 | 61 |
| 112 Peeler Cir | 0.59mi | 4/2.5 | 2,439 (+7%) | 1mo | $369,999 | $152 | 60 |
| 120 Ironbark Dr | 0.74mi | 4/2.5 | 2,338 (+3%) | 2mo | $369,900 | $158 | 60 |
| 186 Peeler Cir | 0.65mi | 4/2.5 | 2,154 (-5%) | 5mo | $350,999 | $163 | 57 |
| 132 Easy St | 0.67mi | 4/2.5 | 2,100 (-8%) | 1mo | $310,695 | $148 | 55 |
| 162 Bourbon (lot 62) St | 0.63mi | 3/2.5 (-1) | 2,185 (-4%) | 9mo | $349,900 | $160 | 51 |
| 103 Kennedy Dr | 0.55mi | 3/2.0 (-1) | 2,026 (-11%) | 4mo | $296,500 | $146 | 46 |
| 154 Easy St | 0.65mi | 4/2.5 | 1,952 (-14%) | 0mo | $310,695 | $159 | 46 |
| 111 Kennedy Dr | 0.49mi | 3/2.0 (-1) | 1,947 (-14%) | 6mo | $284,000 | $146 | 41 |
| 276 Ironbark (lot 47) Dr | 0.74mi | 3/2.5 (-1) | 2,069 (-9%) | 6mo | $350,000 | $169 | 40 |
| 198 Peeler Cir | 0.63mi | 4/2.5 | 1,934 (-15%) | 8mo | $304,999 | $158 | 38 |
Match score weights: distance 35% · size 25% · config 20% · recency 20%. Top-matched comps best support the ARV.
Projected returns pro-forma
-3.0% appreciation · 1.92% rent growth · sell at horizon
- IRR
- -18.2%
- Equity multiple
- 0.37×
- Total profit
- $-54,043
- Equity at exit
- $45,476
- IRR
- -12.5%
- Equity multiple
- 0.29×
- Total profit
- $-60,254
- Equity at exit
- $26,371
Cash invested: $85,400 (down + closing). Projections, not guarantees.
Landlord ↔ Tenant lean methodology
- Overall (STATE)
- 85 Strongly Landlord-Friendly
- State North Carolina
- 85 Strongly Landlord-Friendly · R+3
- County
- — inherits STATE
- City
- — inherits STATE
ZIP-level market 28376
- Home prices YoY
- -24.0%
- Rents YoY
- 1.9%
- Active inventory
- 566
- Price-to-rent
- 10.6×
Monthly cashflow live
- Estimated rent
- $2,400 medium interval (Pro) →
- Mortgage (P&I)
- −$1,599
- Tax from tax record
- −$178 /mo · $2,142/yr
- Insurance
- −$127
- HOA
- −$22
- Vacancy / Maint / Mgmt
- −$504
- Net cashflow
- $-31
Break-even live
UW: 25.0% down · 7.5% · 30yr · 1.5% tax · 5.0% vac · 8.0% maint · 8.0% mgmt
Financing live
Cash to close
- Down payment
- $76,250
- Closing costs
- $9,150
- Reserves months
- —
- Total cash needed
- —
Loan-product check · same deal, 3 products live
Conventional
25% down · 7.5% · 30yr
- Down + closing
- —
- Monthly P&I
- —
- Monthly cashflow
- —
- DSCR
- —
- Eligible?
- —
Personal DTI + credit; lowest rate.
DSCR
20% down · 8.5% · 30yr
- Down + closing
- —
- Monthly P&I
- —
- Monthly cashflow
- —
- DSCR
- —
- Eligible?
- —
No personal income docs; deal must DSCR.
Hard money
10% down · 12.0% · 12mo
- Down + closing
- —
- Monthly P&I
- —
- Monthly cashflow
- —
- DSCR
- —
- Eligible?
- —
Short-term bridge; refi at stabilization.
Rent comps 4 comps
| Address | Beds | Baths | Sqft | Rent | $/sqft | DOM | Units | Dist |
|---|---|---|---|---|---|---|---|---|
| 1463 Townsend Rd Raeford, NC | 4.0 | 2.5 | 2500 | $2,300 | $0.92 | 21d | 1 | 0.66mi |
| 136 Bourbon St , NC | 3.0 | 2.5 | 2147 | $2,200 | $1.02 | 23d | 1 | 0.71mi |
| 163 Bourbon St Raeford, NC | 4.0 | 2.5 | 1967 | $2,400 | $1.22 | 23d | 1 | 0.72mi |
| 131 Bourbon (lot 13) ST Raeford, NC | 4.0 | 2.5 | 1967 | $2,400 | $1.22 | 23d | 1 | 0.74mi |
HOA detail
- Monthly dues
- $22 · $264/yr
Listing history 2 events
-
2026-06-13remarks 687-char remark
-
2026-06-13$305,000 Pending 1 DOM
ⓘ Source: listings_history table (triggers on properties + properties_extension) + one-shot
backfill from property_details.listing_events for pre-trigger history.
Tax reassessment forecast NC · Resets to sale price
- Current annual tax
- $2,142 · $178/mo
- Projected year-2 tax
- $2,501 · $208/mo
- Expected delta
- +$359/yr (+$30/mo · 16.8%)
ⓘ Screening estimate from a state-policy table — verify with the county assessor before closing.
Climate risk First Street
- Flood 1/10 Low FEMA zone X (unshaded) · 0% chance over 30 yrs
- Wildfire 7/10 Severe
- Heat 7/10 Severe 7 d/yr ≥107°F today · 16 d/yr by 30 yrs out
- Wind 6/10 Major 73% chance of damaging wind over 30 yrs
- Air quality 1/10 Low 0 unhealthy d/yr today · 0 by 30 yrs out
Nearby sold comps map
Loading sold comps map…
Walkable amenities ~0.75 mi
Loading nearby amenities…
Taxation est. · year 1
- Rental income
- $28,803
- − Mortgage interest
- −$17,085
- − Property taxes
- −$2,142
- − Insurance
- −$1,525
- − Repairs & maintenance
- −$2,304
- − Management
- −$2,304
- − HOA
- −$264
- − Depreciation
- −$8,873
- Taxable loss
- −$5,694
- Est. tax savings @ 24.0%
- +$1,367
- After-tax cash flow
- $996/yr
For passive investors: Depreciation is non-cash, so a rental often shows a tax loss while cash-flowing — sheltering income. Rental losses are passive: they offset passive income freely, and up to $25,000/yr can offset ordinary (W-2) income if you actively participate and your MAGI is under $100k (phasing out to $0 by $150k); unused losses carry forward. On sale, claimed depreciation is recaptured at up to 25%, and gains may owe capital-gains tax (a 1031 exchange can defer both). Figures are a year-1 estimate at your 24.0% rate — not tax advice; consult a CPA.
Schools (NCES district)
- District
- Hoke County Schools
- NCES district ID
- 3702250
- Math proficiency
- 35% ▼ -1.00%
- Reading proficiency
- 40% ▲ 1.00%
- Median HH income
- $43,896
- Composite
- 31.82/100
- National rank
- #5880
- State rank
- #123 of 178 in NC
Livability — Rockfish
- Score
- 71/100
- State rank
- #108
- US rank
- #6802
Category grades
Schools grade is shown separately in the Schools card above.
Census & demographics
- County
- Hoke County · 44,880 people
- Metro
- Fayetteville, NC
- Population (ZIP)
- 44,880
- Household income
- $66,471
- Rent vs Own
- Severe rent burden
- 897.0
Population outlook (Hoke County) Hauer SSP2
- Today (2025)
- 63,354 people
- By 2030
- 68,361 · +7.9%
- By 2040
- 78,074 · +23.2%
- By 2050
- 86,384 · +36.4%
- By 2075
- 99,517 · +57.1%
- By 2100
- 98,939 · +56.2%
Race, ethnicity, and origin ACS 2023
- Neighborhood character
- Highly diverse neighborhood (Simpson 0.71)
- Race & ethnicity
- White 38% Black 35% Hispanic / Latino 15% Two or more races 9% Native American 3% Asian 1%
- Hispanic origin (detail)
- Mexican 7% Puerto Rican 4%
- Common ancestry
- Slovak 2% Romanian 1% Italian 1%
- Foreign-born
- 6% · Canada, Vietnam
- Languages at home
- 89% English-only · Spanish 8% French/Haitian/Cajun 1%
Political lean MEDSL · Hoke
- 2024 margin
- Lean D (+5.9) · D 52.4% · R 46.4% · Other 1.2%
- 2008→2024 swing
- -12.8pp toward R · 2008: 18.8pp · 2024: 5.9pp
- All cycles
- 2024: D+5.9 2020: D+10.9 2016: D+10.8 2012: D+19.0 2008: D+18.8
Not yet ingested
- Civics
- —
Market trends
- HPI YoY
- ▼ -53.30%
- Current HPI
- 169.1801
- Rent YoY
- ▲ 1.92%
- Metro
- Fayetteville, NC
- State GDP YoY
- ▲ 3.28%
- F500 in state
- 26
Industry mix (Fortune 500 HQ in NC)
| Industry | F500 HQs | Revenue |
|---|---|---|
| Financial Services | 2 | $213B |
|
||
| Retail | 2 | $95B |
|
||
| Industrial Conglomerate | 1 | $38B |
|
||
| Metals / Steel | 1 | $35B |
|
||
| Utilities | 1 | $30B |
|
||
| Industrial Machinery | 1 | $19B |
|
||
Price history
+39.9% since first listed5 events — show timeline
- 2026-06-12 Pending — LPRMLS
- 2026-06-10 Listed $305,000 LPRMLS
- 2016-03-15 Sold (Public Records) $213,000 Public Records
- 2016-03-14 Sold (MLS) $213,000 LPRMLS
- 2015-10-09 Listed $218,000 LPRMLS
Property tax history
+0.6%/yrLatest (2025): $2,142 · +0.0% YoY. Source: county tax records.
Cash-flow waterfall
monthlySold comps — $/sqft
last 12 mo · ≤1 miLoading sold comps…