 Triplex
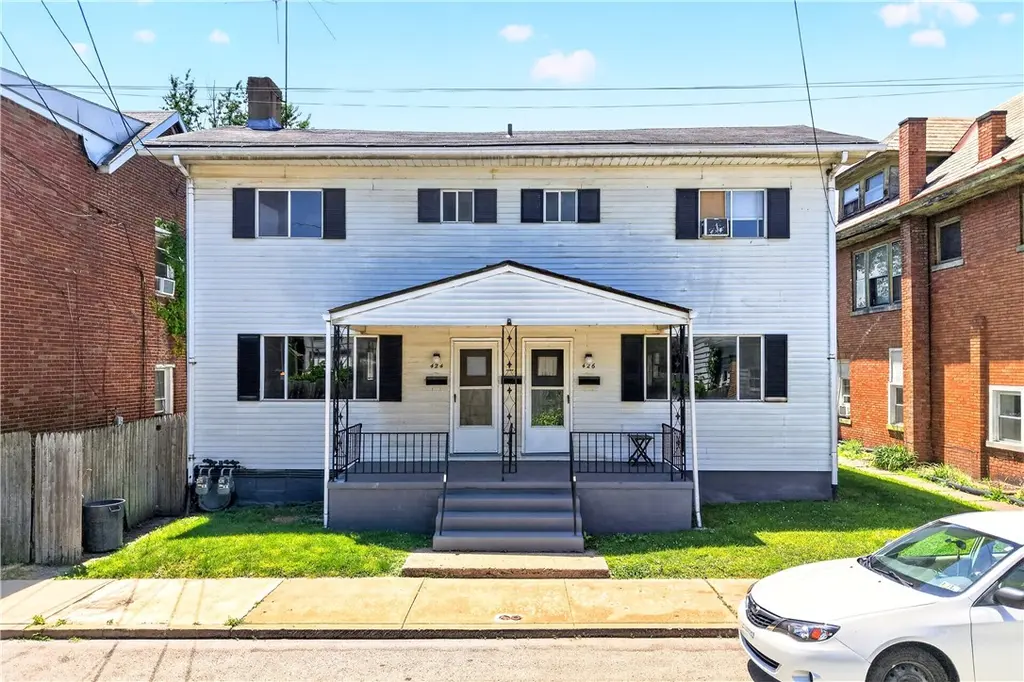
424-426 Connecticut Ave · Rochester, PA
Flood risk 1/10 · Minimal
- FEMA flood zone
- X (unshaded)
- Chance of flooding over 30 yrs
- 0.0%
- Est. flood insurance / yr
- $473 – $860
Fire risk 1/10 · Minimal
- Est. fire insurance / yr
- $511 – $949
Heat risk 4/10 · Minor
- Hot days now (above 97°F)
- 7 days/yr
- Hot days in 30 yrs
- 19 days/yr
Wind risk 2/10 · Minimal
- Chance of severe wind over 30 yrs
- 0.0%
Air-quality risk 3/10 · Minor
- Unhealthy air days now
- 2 days/yr
- Unhealthy air days in 30 yrs
- 4 days/yr
Risk factors via First Street. Map © Google.
Why this score? — see what drove the B- grade
The composite is a weighted blend of 9 inputs, each scored 0–100. Each bar is that input's sub-score; the figure is the points it added to the 100-point composite (weight × sub-score).
- Cash flow +30.0/30.0
- DSCR +10.0/10.0
- 1% rule +9.0/10.0
- ARV discount +7.5/15.0
- Livability +4.0/5.0
- Schools +3.3/10.0
- Rent growth +2.5/5.0
- Condition / age +2.5/5.0
- Appreciation +0.0/10.0
$225,000
🖨 Deal sheet 📄 Offer letter ✓ Due diligence
Multi-family units
County records classify this as Multi-Family (2-4 Unit). Listing-text estimate: 3 units. confirmed
Listing remarks
Exceptional investment opportunity in the heart of Rochester! This well-maintained triplex offers character, functionality, and strong income potential in a highly desirable location. Featuring separate utilities for each unit, this property includes (1) two one-bedroom with one full & two half baths, and (2) one bedroom, 1 bath apartments, along with a (2) car detached garage for storage or additional rental income providing flexibility for a variety of rental strategies. Tenants and owners alike will appreciate the timeless charm found throughout, including high ceilings, spacious rooms, and equipped kitchens with stove & refrigerator. The property has been well cared for and
Key facts
- Equipped kitchens
- Separate utilities
- Spacious rooms
Tags
Property features AI
Finance
- Financial info: Reported rents: one unit at $1,100; one unit at $750; one unit at $650; one unit at $200
Exterior
- Parking: Detached garage; On-street parking available; Off-street parking available; Total of 4 parking spaces
- Utilities: Electricity available; Natural gas available; Public water available; Public sewer available
- Home design: Multi-unit property with 4 total units (3 units in the community)
- Construction: Asphalt roof
- Exterior features: Aluminum siding; R-3 zoning
Interior
- Bedrooms: One unit with 2 bedrooms; Two units with 1 bedroom each
- Bathrooms: One unit with 3 bathrooms (1 full, 2 half); Two units with 1 full bathroom each
- Interior features: Full basement
Neighborhood map
What this means for you Summary
Snapshot
- This is a 3 × 4-bed/4.5-bath units multifamily listed at $225k.
Deal economics
- At list price, monthly cash flow is $913 ($11k/yr) — positive. Per door: $304/mo.
- The deal already cash-flows at list — no discount required.
- Meets the 1% rule at list price ($3k rent vs $225k).
Location & tenants
- Location reads 80/100 on livability (#220 in PA, #1,937 nationally) — a professional / high-income tenant draw. Strengths: commute A+, cost of living A+, health & safety A+; Watch: schools C-, amenities D, crime F.
- Rochester Area SD (rural): math 28% / reading 50% proficiency, ranked #375 of 539 in PA (top 70%) — families likely to look elsewhere, expect single-tenant / working-renter base with shorter leases.
- Market conditions: 36 active listings in the ZIP; 272 units permitted in Beaver County in 2024 (80 in 5+ unit buildings).
Forward outlook
- Local home prices are declining (-3.0%/yr); year-one equity from $2k of loan paydown is wiped out by about $7k of value loss. Plan a longer hold.
- Beaver County population projected at -14% by 2050 — secular population decline; favor cash flow + early exit over multi-decade hold.
- At projected returns (-3.0% appreciation + 3.0% rent growth), your $63k cash investment doubles in ~7 years — after that, you're playing with house money.
Negotiation context
- Only 8 days on market — expect competitive offers; lowballing is unlikely to land.
Risks & watch-outs
- Watch-outs: built in 1900 — expect roof / HVAC / electrical / plumbing capex.
Questions for the listing agent
- Can we see the unit-by-unit rent roll, current vacancy, and any below-market leases? What's the average tenancy length?
- What capital expenditures (roof, boiler, parking lot, exteriors) have been made in the last 5 years, and what's planned in the next 2?
- Built in 1900 — when were the roof, HVAC, electrical panel, plumbing, and water heater last replaced?
- Is there a deadline driving the sale (1031 exchange, divorce, estate, relocation)? That informs how much negotiation room exists.
- Crime grade is F in this area — have there been break-ins, vandalism, or insurance claims at this property in the last 3 years? What carrier currently insures it and at what premium?
- What's the average days-on-market for RENTAL listings here right now (not sales)? A rising rental-DOM trend means longer vacancies and softer asking-rent achievability than the comps imply.
- What's the recent tenant-quality profile in this submarket — average credit score on applications, eviction rate, late-payment / NSF rate, and stable-employment percentage? A property-management company in the area should have these aggregated.
- How much new apartment / multifamily construction is in the pipeline within 1–3 miles? Heavy new supply (>2% of stock underway) typically softens rents 12–24 months out; light construction supports rent growth.
Investment metrics
- 1% rule
- 1.40% ✓
- Cap rate
- 11.16%
- Cash-on-cash
- 17.38%
- DSCR
- 1.77
- GRM
- 5.9
CMA / ARV
No comps found within radius.
Projected returns pro-forma
-3.0% appreciation · 3.0% rent growth · sell at horizon
- IRR
- 8.8%
- Equity multiple
- 1.34×
- Total profit
- $21,729
- Equity at exit
- $33,548
- IRR
- 18.0%
- Equity multiple
- 2.49×
- Total profit
- $94,028
- Equity at exit
- $19,454
Cash invested: $63,000 (down + closing). Projections, not guarantees.
Landlord ↔ Tenant lean methodology
- Overall (STATE)
- 62 Landlord-Friendly
- State Pennsylvania
- 62 Landlord-Friendly · EVEN
- County
- — inherits STATE
- City
- — inherits STATE
ZIP-level market 15074
- Active inventory
- 36
- Price-to-rent
- 17.8×
Monthly cashflow live
- Estimated rent
- $3,159 medium interval (Pro) →
- Mortgage (P&I)
- −$1,180
- Tax from tax record
- −$309 /mo · $3,712/yr
- Insurance
- −$94
- HOA
- −$0
- Vacancy / Maint / Mgmt
- −$663
- Net cashflow
- $913
Break-even live
3-unit breakdown (identical units grouped — click to expand)
| Units | Beds | Baths | Est. rent |
|---|---|---|---|
| 3× units | 4 | 4.5 | $3,159 |
| #1 | 4 | 4.5 | $1,053 |
| #2 | 4 | 4.5 | $1,053 |
| #3 | 4 | 4.5 | $1,053 |
| Total (3 units) | $3,159 | ||
UW: 25.0% down · 7.5% · 30yr · 1.5% tax · 5.0% vac · 8.0% maint · 8.0% mgmt
Financing live
Cash to close
- Down payment
- $56,250
- Closing costs
- $6,750
- Reserves months
- —
- Total cash needed
- —
Loan-product check · same deal, 3 products live
Conventional
25% down · 7.5% · 30yr
- Down + closing
- —
- Monthly P&I
- —
- Monthly cashflow
- —
- DSCR
- —
- Eligible?
- —
Personal DTI + credit; lowest rate.
DSCR
20% down · 8.5% · 30yr
- Down + closing
- —
- Monthly P&I
- —
- Monthly cashflow
- —
- DSCR
- —
- Eligible?
- —
No personal income docs; deal must DSCR.
Hard money
10% down · 12.0% · 12mo
- Down + closing
- —
- Monthly P&I
- —
- Monthly cashflow
- —
- DSCR
- —
- Eligible?
- —
Short-term bridge; refi at stabilization.
Listing history 6 events
-
2026-06-18days on market $225,000 Active 8 DOM
-
2026-06-17days on market $225,000 Active 7 DOM
-
2026-06-16days on market $225,000 Active 6 DOM
-
2026-06-15days on market $225,000 Active 5 DOM
-
2026-06-13remarks 691-char remark
-
2026-06-13$225,000 Active 3 DOM
ⓘ Source: listings_history table (triggers on properties + properties_extension) + one-shot
backfill from property_details.listing_events for pre-trigger history.
Tax reassessment forecast PA · Partial reset (capped growth)
- Current annual tax
- $3,712 · $309/mo
- Projected year-2 tax
- $3,712 · $309/mo
- Expected delta
- $0/yr ($0/mo · 0.0%)
ⓘ Screening estimate from a state-policy table — verify with the county assessor before closing.
Climate risk First Street
- Flood 1/10 Low FEMA zone X (unshaded) · 0% chance over 30 yrs
- Wildfire 1/10 Low
- Heat 4/10 Moderate 7 d/yr ≥97°F today · 19 d/yr by 30 yrs out
- Wind 2/10 Low 0% chance of damaging wind over 30 yrs
- Air quality 3/10 Moderate 2 unhealthy d/yr today · 4 by 30 yrs out
Nearby sold comps map
Loading sold comps map…
Walkable amenities ~0.75 mi
Loading nearby amenities…
Taxation est. · year 1
- Rental income
- $37,908
- − Mortgage interest
- −$12,603
- − Property taxes
- −$3,712
- − Insurance
- −$1,125
- − Repairs & maintenance
- −$3,033
- − Management
- −$3,033
- − Depreciation
- −$6,545
- Taxable income
- $7,857
- Est. tax owed @ 24.0%
- −$1,886
- After-tax cash flow
- $9,066/yr
For passive investors: Depreciation is non-cash, so a rental often shows a tax loss while cash-flowing — sheltering income. Rental losses are passive: they offset passive income freely, and up to $25,000/yr can offset ordinary (W-2) income if you actively participate and your MAGI is under $100k (phasing out to $0 by $150k); unused losses carry forward. On sale, claimed depreciation is recaptured at up to 25%, and gains may owe capital-gains tax (a 1031 exchange can defer both). Figures are a year-1 estimate at your 24.0% rate — not tax advice; consult a CPA.
Schools (NCES district)
- District
- Rochester Area SD
- NCES district ID
- 4220460
- Math proficiency
- 28% ▼ -3.00%
- Reading proficiency
- 50% ▼ -9.00%
- Median HH income
- $40,841
- Composite
- 32.7/100
- National rank
- #5644
- State rank
- #375 of 539 in PA
Livability — Rochester
- Score
- 80/100
- State rank
- #220
- US rank
- #1937
Category grades
Schools grade is shown separately in the Schools card above.
Census & demographics
- Census place
- Rochester, PA
- Population (ZIP)
- 8,543
Population outlook (Beaver County) Hauer SSP2
- Today (2025)
- 164,976 people
- By 2030
- 161,449 · -2.1%
- By 2040
- 151,752 · -8.0%
- By 2050
- 141,155 · -14.4%
- By 2075
- 118,142 · -28.4%
- By 2100
- 91,740 · -44.4%
Race, ethnicity, and origin ACS 2023
- Neighborhood character
- Predominantly White (85%)
- Race & ethnicity
- White 85% Black 8% Two or more races 6%
- Common ancestry
- Romanian 4% Slovak 2% Serbian 2%
- Foreign-born
- 2%
- Languages at home
- 96% English-only · German/W. Germanic 3% French/Haitian/Cajun 1%
Political lean MEDSL · Beaver
- 2024 margin
- Strong R (+20.7) · D 39.2% · R 59.9%
- 2008→2024 swing
- -17.9pp toward R · 2008: -2.8pp · 2024: -20.7pp
- All cycles
- 2024: R+20.7 2020: R+17.7 2016: R+20.1 2012: R+6.6 2008: R+2.8
Not yet ingested
- Civics
- —
Market trends
- HPI YoY
- ▼ -92.06%
- Current HPI
- 166.4711
- Rent YoY
- —
- Metro
- —
- State GDP YoY
- ▲ 1.68%
- F500 in state
- 34
Industry mix (Fortune 500 HQ in PA)
| Industry | F500 HQs | Revenue |
|---|---|---|
| Healthcare | 2 | $309B |
|
||
| Insurance | 2 | $27B |
|
||
| Telecommunications / Media | 1 | $124B |
|
||
| Industrial Distribution | 1 | $22B |
|
||
| Financial Services | 1 | $20B |
|
||
| Chemicals / Materials | 1 | $18B |
|
||
Price history
1 event — show timeline
- 2026-06-10 Listed $225,000 West Penn MLS
Property tax history
+3.6%/yrLatest (2026): $3,712 · +2.9% YoY. Source: county tax records.
Cash-flow waterfall
monthlySold comps — $/sqft
last 12 mo · ≤1 miLoading sold comps…