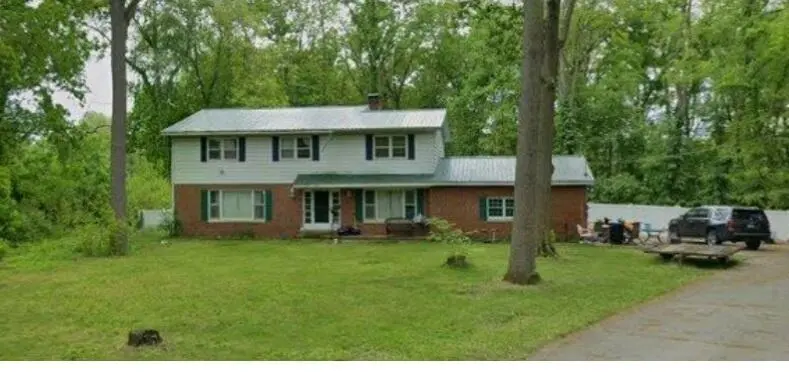
3439 Calumet Ave S · Elkhart, IN
Flood risk 4/10 · Minor
- FEMA flood zone
- X (unshaded)
- Chance of flooding over 30 yrs
- 0.22%
- Est. flood insurance / yr
- $473 – $860
Fire risk 1/10 · Minimal
- Est. fire insurance / yr
- $717 – $1,331
Heat risk 2/10 · Minimal
- Hot days now (above 100°F)
- 7 days/yr
- Hot days in 30 yrs
- 15 days/yr
Wind risk 2/10 · Minimal
- Chance of severe wind over 30 yrs
- —
Air-quality risk 2/10 · Minimal
- Unhealthy air days now
- 1 days/yr
- Unhealthy air days in 30 yrs
- 2 days/yr
Risk factors via First Street. Map © Google.
Why this score? — see what drove the C grade
The composite is a weighted blend of 9 inputs, each scored 0–100. Each bar is that input's sub-score; the figure is the points it added to the 100-point composite (weight × sub-score).
- Cash flow +19.9/30.0
- ARV discount +15.0/15.0
- DSCR +6.3/10.0
- 1% rule +4.7/10.0
- Rent growth +4.3/5.0
- Livability +3.4/5.0
- Condition / age +2.5/5.0
- Schools +1.8/10.0
- Appreciation +0.0/10.0
$225,000
🖨 Deal sheet 📄 Offer letter ✓ Due diligence
Listing remarks
Wonderful Opportunity for a Fixer Upper. . Great space, on a large lot. Waiting for the next owner to make it theirs. Metal Roof approx 5 years old, HVAC 2021. Currently Drive-by Only.
Key facts
- Metal roof
- Hvac
- Large lot
Tags
Property features AI
Exterior
- Parking: Driveway; 2-car garage
- Utilities: Public water; Public sewer
- Home design: Two-story home; Built in 1963; Property listed as fixer
- Construction: Aluminum siding and brick exterior; Metal roof; Has basement
- Exterior features: Neighborhood view; Lot information from public records
Interior
- Kitchen: Kitchen (includes standard appliances)
- Bedrooms: Primary bedroom; Bedroom 2; Bedroom 3; Bedroom 4; Office
- Flooring: Carpet; Tile
- Bathrooms: 2 full bathrooms; 1 half bathroom
- Heating & cooling: Central heat; Central air conditioning
- Interior features: Partially finished basement with crawl space, storage space and sump pump; Other interior features
- Laundry & utility: Washer and Dryer; Laundry located on lower level
Neighborhood map
What this means for you Summary
Snapshot
- This is a 4-bed/2.5-bath single-family listed at $225k.
Deal economics
- At list price, monthly cash flow is $273 ($3k/yr) — positive.
- The deal already cash-flows at list — no discount required.
- To meet the 1% rule (rent ≥ 1% of price), the offer needs to be $219k (2.6% below list).
- Recommended offer: $219k (2.6% below list) — sets the bar for 1% rule.
- Cap rate 7.7% vs local median 4.0% in Elkhart — top-decile yield for the area; either an underpriced asset or a hidden risk that comps aren't pricing in. Stress-test before assuming the spread holds.
Location & tenants
- Location reads 68/100 on livability (#224 in IN) — a middle-class / working-renter tenant base. Strengths: cost of living A+, housing A+, health & safety A+; Watch: amenities C-, schools F, crime F.
- Elkhart Community Schools (urban): math 18% / reading 25% proficiency, ranked #271 of 301 in IN (top 90%) — low school quality limits family demand, transient renter base, plan for 1-2y turnover.
- Market conditions: Rents rising fast (+7.0%/yr); 269 active listings in the ZIP; 2 comparable units currently listed for rent nearby; 484 units permitted in Elkhart County in 2024 (136 in 5+ unit buildings).
- This rent runs 40% of the median local income ($66k/yr) — at the standard rent-burdened threshold; future hikes will face affordability resistance.
Forward outlook
- Local home prices are declining (-3.0%/yr); year-one equity from $2k of loan paydown is wiped out by about $7k of value loss. Plan a longer hold.
- Elkhart County population projected at +7% by 2050 — modest demand growth; plan on rents tracking national, not racing it.
- At projected returns (-3.0% appreciation + 7.0% rent growth), your $63k cash investment doubles in ~10 years — after that, you're playing with house money.
Negotiation context
- It's been on market 15 days — a 2% lower offer ($222k) is reasonable based on typical stale-listing flexibility.
- 2 sale attempts with the ask held roughly flat each time — persistent listings suggest the price (not the market) is what's stuck; bring a comps-based counter.
- Current owner paid $154k; 46% above their basis — modest negotiation headroom, anchor on the comps not their cost.
Questions for the listing agent
- Built in 1963 — when were the roof, HVAC, electrical panel, plumbing, and water heater last replaced?
- Is there a deadline driving the sale (1031 exchange, divorce, estate, relocation)? That informs how much negotiation room exists.
- Schools are F-rated, which usually means shorter tenancies and higher turnover. Who's the typical renter profile here, and what's been the actual vacancy rate?
- Crime grade is F in this area — have there been break-ins, vandalism, or insurance claims at this property in the last 3 years? What carrier currently insures it and at what premium?
- What's the average days-on-market for RENTAL listings here right now (not sales)? A rising rental-DOM trend means longer vacancies and softer asking-rent achievability than the comps imply.
- What's the recent tenant-quality profile in this submarket — average credit score on applications, eviction rate, late-payment / NSF rate, and stable-employment percentage? A property-management company in the area should have these aggregated.
- How much new for-sale + rental construction is in the pipeline within 1–3 miles? Heavy new supply typically softens prices + rents 12–24 months out; constrained supply supports both.
Investment metrics
- 1% rule
- 0.97% ✗
- Cap rate
- 7.75%
- Cash-on-cash
- 5.20%
- DSCR
- 1.23
- GRM
- 8.6
CMA / ARV
- ARV (median comp)
- $306,714
- List price
- $225,000
- Delta
- -26.64%
- Verdict
- UNDERPRICED
- Comps
- 20 within 1.0 mi
Show comp detail 12 sales within ~0.75 mi
| Address | Dist | Beds/Ba | Sqft | Sold | Price | $/sf | Match |
|---|---|---|---|---|---|---|---|
| 1207 Briarwood Dr | 0.04mi | 4/2.5 | 2,894 (-2%) | 1mo | $300,000 | $104 | 94 |
| 1604 East Lake Dr West Dr | 0.63mi | 4/3.0 | 2,951 (+0%) | 1mo | $325,000 | $110 | 68 |
| 3220 E Jackson Blvd | 0.43mi | 4/2.0 | 2,898 (-2%) | 9mo | $260,000 | $90 | 68 |
| 3424 E Bristol St | 0.25mi | 3/2.5 (-1) | 2,577 (-13%) | 3mo | $435,000 | $169 | 60 |
| 3404 E Jackson Blvd | 0.41mi | 4/2.0 | 2,722 (-8%) | 10mo | $290,000 | $107 | 58 |
| 1520 E Lake Dr | 0.49mi | 3/2.0 (-1) | 2,800 (-5%) | 5mo | $259,000 | $93 | 57 |
| 54865 W Shorelane | 0.47mi | 3/2.5 (-1) | 3,188 (+8%) | 4mo | $570,000 | $179 | 56 |
| 1600 Greenbrier Dr | 0.74mi | 4/2.5 | 2,977 (+1%) | 10mo | $285,000 | $96 | 56 |
| 1501 Ash Drive Dr W | 0.49mi | 3/2.0 (-1) | 2,710 (-8%) | 10mo | $255,000 | $94 | 49 |
| 1558 N Bay Dr | 0.62mi | 3/1.5 (-1) | 2,688 (-9%) | 3mo | $292,000 | $109 | 45 |
| 2905 Neff St | 0.46mi | 3/2.0 (-1) | 2,592 (-12%) | 10mo | $278,500 | $107 | 43 |
| 2822 Calumet Ave | 0.49mi | 3/1.0 (-1) | 2,578 (-13%) | 11mo | $233,500 | $91 | 36 |
Match score weights: distance 35% · size 25% · config 20% · recency 20%. Top-matched comps best support the ARV.
Projected returns pro-forma
-3.0% appreciation · 7.03% rent growth · sell at horizon
- IRR
- -4.0%
- Equity multiple
- 0.84×
- Total profit
- $-9,871
- Equity at exit
- $33,548
- IRR
- 9.6%
- Equity multiple
- 1.87×
- Total profit
- $54,888
- Equity at exit
- $19,454
Cash invested: $63,000 (down + closing). Projections, not guarantees.
Landlord ↔ Tenant lean methodology
- Overall (STATE)
- 90 Strongly Landlord-Friendly
- State Indiana
- 90 Strongly Landlord-Friendly · R+11
- County
- — inherits STATE
- City
- — inherits STATE
ZIP-level market 46514
- Rents YoY
- 7.0%
- Active inventory
- 269
- Price-to-rent
- 8.6×
Monthly cashflow live
- Estimated rent
- $2,191 medium interval (Pro) →
- Mortgage (P&I)
- −$1,180
- Tax from tax record
- −$184 /mo · $2,214/yr
- Insurance
- −$94
- HOA
- −$0
- Vacancy / Maint / Mgmt
- −$460
- Net cashflow
- $273
Break-even live
UW: 25.0% down · 7.5% · 30yr · 1.5% tax · 5.0% vac · 8.0% maint · 8.0% mgmt
Financing live
Cash to close
- Down payment
- $56,250
- Closing costs
- $6,750
- Reserves months
- —
- Total cash needed
- —
Loan-product check · same deal, 3 products live
Conventional
25% down · 7.5% · 30yr
- Down + closing
- —
- Monthly P&I
- —
- Monthly cashflow
- —
- DSCR
- —
- Eligible?
- —
Personal DTI + credit; lowest rate.
DSCR
20% down · 8.5% · 30yr
- Down + closing
- —
- Monthly P&I
- —
- Monthly cashflow
- —
- DSCR
- —
- Eligible?
- —
No personal income docs; deal must DSCR.
Hard money
10% down · 12.0% · 12mo
- Down + closing
- —
- Monthly P&I
- —
- Monthly cashflow
- —
- DSCR
- —
- Eligible?
- —
Short-term bridge; refi at stabilization.
Rent comps 2 comps
| Address | Beds | Baths | Sqft | Rent | $/sqft | DOM | Units | Dist |
|---|---|---|---|---|---|---|---|---|
| 1626 Osolo Rd Elkhart, IN | 4.0 | 2.0 | 2190 | $2,595 | $1.18 | 21d | 1 | 1.23mi |
| 54271 Stonebridge Dr Elkhart, IN | 4.0 | 2.5 | 3000 | $2,300 | $0.77 | 21d | 1 | 1.50mi |
Listing history 15 events
-
2026-06-17status $225,000 Pending 15 DOM
-
2026-06-16days on market $225,000 Active 15 DOM
-
2026-06-15days on market $225,000 Active 14 DOM
-
2026-06-14days on market $225,000 Active 12 DOM
-
2026-06-13days on market $225,000 Active 11 DOM
-
2026-06-10days on market $225,000 Active 9 DOM
-
2026-06-09days on market $225,000 Active 8 DOM
-
2026-06-08days on market $225,000 Active 7 DOM
-
2026-06-07days on market $225,000 Active 6 DOM
-
2026-06-05days on market $225,000 Active 3 DOM
-
2026-06-03days on market $225,000 Active 2 DOM
-
2026-06-02days on market $225,000 Active 1 DOM
-
2026-05-08$225,000 Active 185-char remark
-
2002-11-19soldstatus $153,900
-
1999-04-01soldstatus $119,900
ⓘ Source: listings_history table (triggers on properties + properties_extension) + one-shot
backfill from property_details.listing_events for pre-trigger history.
Tax reassessment forecast IN · Partial reset (capped growth)
- Current annual tax
- $2,214 · $184/mo
- Projected year-2 tax
- $2,214 · $184/mo
- Expected delta
- $0/yr ($0/mo · 0.0%)
ⓘ Screening estimate from a state-policy table — verify with the county assessor before closing.
Climate risk First Street
- Flood 4/10 Moderate FEMA zone X (unshaded) · 22% chance over 30 yrs
- Wildfire 1/10 Low
- Heat 2/10 Low 7 d/yr ≥100°F today · 15 d/yr by 30 yrs out
- Wind 2/10 Low
- Air quality 2/10 Low 1 unhealthy d/yr today · 2 by 30 yrs out
Nearby sold comps map
Loading sold comps map…
Walkable amenities ~0.75 mi
Loading nearby amenities…
Taxation est. · year 1
- Rental income
- $26,292
- − Mortgage interest
- −$12,603
- − Property taxes
- −$2,214
- − Insurance
- −$1,125
- − Repairs & maintenance
- −$2,103
- − Management
- −$2,103
- − Depreciation
- −$6,545
- Taxable loss
- −$402
- Est. tax savings @ 24.0%
- +$97
- After-tax cash flow
- $3,369/yr
For passive investors: Depreciation is non-cash, so a rental often shows a tax loss while cash-flowing — sheltering income. Rental losses are passive: they offset passive income freely, and up to $25,000/yr can offset ordinary (W-2) income if you actively participate and your MAGI is under $100k (phasing out to $0 by $150k); unused losses carry forward. On sale, claimed depreciation is recaptured at up to 25%, and gains may owe capital-gains tax (a 1031 exchange can defer both). Figures are a year-1 estimate at your 24.0% rate — not tax advice; consult a CPA.
Schools (NCES district)
- District
- Elkhart Community Schools
- NCES district ID
- 1803270
- Math proficiency
- 18% ▼ -12.00%
- Reading proficiency
- 25% ▼ -9.00%
- Median HH income
- $42,881
- Composite
- 18.45/100
- National rank
- #8928
- State rank
- #271 of 301 in IN
Livability — Elkhart
- Score
- 68/100
- State rank
- #224
- US rank
- #9852
Category grades
Schools grade is shown separately in the Schools card above.
Census & demographics
- County
- Elkhart County · 107,928 people
- City population
- 74,260
- Metro
- Elkhart-Goshen, IN
- Population (ZIP)
- 42,389
- Household income
- $65,833
- Rent vs Own
- Severe rent burden
- 1061.0
Population outlook (Elkhart County) Hauer SSP2
- Today (2025)
- 213,761 people
- By 2030
- 218,103 · +2.0%
- By 2040
- 225,381 · +5.4%
- By 2050
- 229,447 · +7.3%
- By 2075
- 232,856 · +8.9%
- By 2100
- 214,088 · +0.2%
Race, ethnicity, and origin ACS 2023
- Neighborhood character
- Predominantly White (74%)
- Race & ethnicity
- White 74% Hispanic / Latino 14% Two or more races 6% Black 5% Asian 1%
- Hispanic origin (detail)
- Mexican 10%
- Common ancestry
- Lithuanian 2% Romanian 2% Italian 2%
- Foreign-born
- 8% · Canada
- Languages at home
- 89% English-only · Spanish 10%
Political lean MEDSL · Elkhart
- 2024 margin
- Solid R (+32.4) · D 33.1% · R 65.5% · Other 1.4%
- 2008→2024 swing
- -21.2pp toward R · 2008: -11.2pp · 2024: -32.4pp
- All cycles
- 2024: R+32.4 2020: R+28.1 2016: R+32.4 2012: R+26.5 2008: R+11.2
Not yet ingested
- Civics
- —
Market trends
- HPI YoY
- ▼ -246.78%
- Current HPI
- 225.6
- Rent YoY
- ▲ 7.03%
- Metro
- Elkhart-Goshen, IN
- State GDP YoY
- ▲ 2.90%
- F500 in state
- 18
Industry mix (Fortune 500 HQ in IN)
| Industry | F500 HQs | Revenue |
|---|---|---|
| Industrial Machinery | 2 | $37B |
|
||
| Healthcare | 1 | $177B |
|
||
| Pharmaceuticals | 1 | $45B |
|
||
| Metals / Steel | 1 | $18B |
|
||
| Agriculture | 1 | $17B |
|
||
| Packaging | 1 | $12B |
|
||
Price history
+87.7% since first listed6 events — show timeline
- 2026-06-16 Pending — NIRA MLS as Distributed by MLS Grid
- 2026-06-01 Listed $225,000 NIRA MLS as Distributed by MLS Grid
- 2026-05-28 Listing Removed — NIRA MLS as Distributed by MLS Grid
- 2026-05-08 Listed $225,000 NIRA MLS as Distributed by MLS Grid
- 2002-11-19 Sold (Public Records) $153,900 Public Records
- 1999-04-01 Sold (Public Records) $119,900 Public Records
Property tax history
+1.7%/yrLatest (2025): $2,214 · -8.0% YoY. Source: county tax records.
Cash-flow waterfall
monthlySold comps — $/sqft
last 12 mo · ≤1 miLoading sold comps…