425 Ena Rd Unit 302B · Urban Honolulu, HI
Flood risk 7/10 · Major
- FEMA flood zone
- X (unshaded)
- Chance of flooding over 30 yrs
- 0.75%
- Est. flood insurance / yr
- $507 – $1,088
Fire risk No data
- Est. fire insurance / yr
- —
Heat risk No data
- Hot days now (above threshold)
- —
- Hot days in 30 yrs
- —
Wind risk No data
- Chance of severe wind over 30 yrs
- —
Air-quality risk 1/10 · Minimal
- Unhealthy air days now
- —
- Unhealthy air days in 30 yrs
- —
Risk factors via First Street. Map © Google.
Why this score? — see what drove the B- grade
The composite is a weighted blend of 9 inputs, each scored 0–100. Each bar is that input's sub-score; the figure is the points it added to the 100-point composite (weight × sub-score).
- Cash flow +30.0/30.0
- 1% rule +10.0/10.0
- DSCR +10.0/10.0
- Appreciation +6.4/10.0
- Rent growth +4.0/5.0
- Schools +3.7/10.0
- Livability +2.5/5.0
- Condition / age +2.5/5.0
- ARV discount +0.0/15.0
$115,000
🖨 Deal sheet 📄 Offer letter ✓ Due diligence
Listing remarks MLS
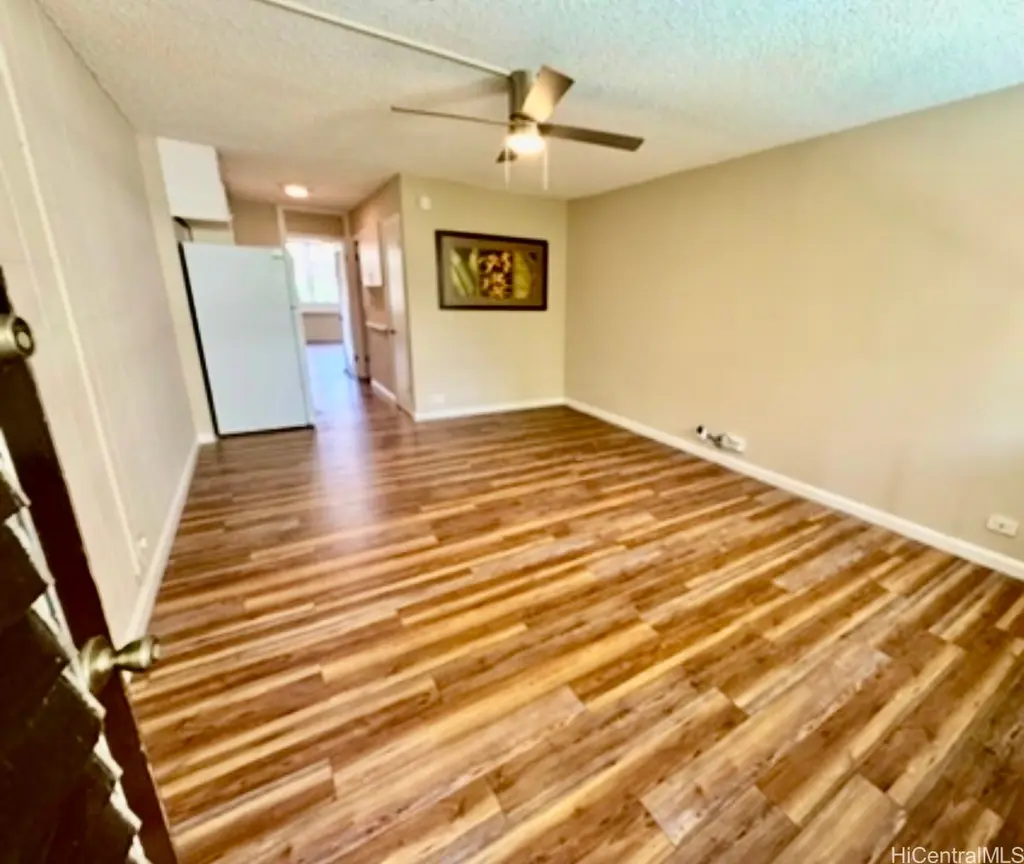
Charming 1-bedroom, 1-bath co-op at The Kalia in Waikiki! Approx. 588 sq ft with enclosed lanai for expanded bedroom space and improved functionality. Features new luxury vinyl flooring, fresh interior, and a well-appointed kitchen and bath—move-in ready. Secure, gated community with pool, BBQ area, security patrol, and cameras. Parking available via waitlist. Conveniently located in proximity to Hilton Hawaiian Village, Ala Moana, beaches, shopping, and dining. Grocery, bakery, food pantry, and post office across the street. Leasehold with fixed increases through 2048. 2026 monthly fee $1,503.94 includes lease rent, utilities, internet, and co-op taxes. Cable $54/month.
Key facts
- Gated community
- Security patrol
- Bbq area
Tags
Neighborhood map
What this means for you Summary
Snapshot
- This is a 1-bed/1.0-bath other listed at $115k.
Deal economics
- At list price, monthly cash flow is $761 ($9k/yr) — positive.
- The deal already cash-flows at list — no discount required.
- Meets the 1% rule at list price ($3k rent vs $115k).
- Recommended offer: $108k (6.0% below list) — sets the bar for market timing.
- Cap rate 14.9% vs local median 1.5% in Urban Honolulu — top-decile yield for the area; either an underpriced asset or a hidden risk that comps aren't pricing in. Stress-test before assuming the spread holds.
Location & tenants
- Location reads: area grade B — affects rentability + tenant quality, not the cash-flow math above.
- Hawaii Department Of Education (suburban): math 32% / reading 50% proficiency, ranked #1 of 1 in HI (top 100%) — families likely to look elsewhere, expect single-tenant / working-renter base with shorter leases.
- Market conditions: Rents rising fast (+6.0%/yr); 814 active listings in the ZIP; 40 comparable units currently listed for rent nearby; rentals at typical pace (median 21d on market — plan ~3-4 weeks tenant-placement turnaround); solid renter incomes; 1,638 units permitted in Honolulu County in 2024 (793 in 5+ unit buildings).
Forward outlook
- In year one you build about $4k of equity ($795 loan paydown + $3k appreciation (2.7% local appreciation)).
- Honolulu County population projected at +17% by 2050 — long-run rental-demand tailwind backs the buy-and-hold thesis.
- At projected returns (2.7% appreciation + 6.0% rent growth), your $32k cash investment doubles in ~3 years — after that, you're playing with house money.
- By year 9, paydown + projected appreciation supports a ~$34k cash-out refi (75% LTV) — recoverable capital for the next deal without selling this one.
Negotiation context
- It's been on market 72 days — a 6% lower offer ($108k) is reasonable based on typical stale-listing flexibility.
- 7 sale attempts since 17y ago; this cycle's ask is 5483% above the opening price — seller raised mid-cycle; expect resistance to lowballs.
- Current owner paid $52k; list at $115k implies a 119% gain — meaningful room to come down on a strong offer.
Risks & watch-outs
- Watch-outs: flood insurance adds $66/mo; HOA is 26% of rent; built in 1958 — expect roof / HVAC / electrical / plumbing capex.
- Climate carrying-cost: major flood risk — expect insurance premiums to compound above CPI over the hold.
Questions for the listing agent
- It's been on market 72 days. Have you received any prior offers? Is the seller open to a 6% concession, seller financing, or rate buy-down credit?
- Built in 1958 — when were the roof, HVAC, electrical panel, plumbing, and water heater last replaced?
- What's the actual annual flood-insurance premium (NFIP or private), and is the property in a SFHA with mandatory coverage?
- What does the HOA fee cover, when was the last increase, and are there any pending special assessments or reserve-fund shortfalls?
- Why hasn't it sold? Are there any deal-killer items the seller is aware of (foundation, flood, title, zoning, code violations)?
- Is there a deadline driving the sale (1031 exchange, divorce, estate, relocation)? That informs how much negotiation room exists.
- What's the average days-on-market for RENTAL listings here right now (not sales)? A rising rental-DOM trend means longer vacancies and softer asking-rent achievability than the comps imply.
- What's the recent tenant-quality profile in this submarket — average credit score on applications, eviction rate, late-payment / NSF rate, and stable-employment percentage? A property-management company in the area should have these aggregated.
- How much new for-sale + rental construction is in the pipeline within 1–3 miles? Heavy new supply typically softens prices + rents 12–24 months out; constrained supply supports both.
Investment metrics
- 1% rule
- 2.65% ✓
- Cap rate
- 14.93%
- Cash-on-cash
- 30.85%
- DSCR
- 2.37
- GRM
- 3.1
CMA / ARV
- ARV (median comp)
- $96,304
- List price
- $115,000
- Delta
- 19.41%
- Verdict
- OVERPRICED
- Comps
- 20 within 1.0 mi
Projected returns pro-forma
2.74% appreciation · 6.0% rent growth · sell at horizon
- IRR
- 37.8%
- Equity multiple
- 3.20×
- Total profit
- $70,820
- Equity at exit
- $50,052
- IRR
- 40.5%
- Equity multiple
- 7.30×
- Total profit
- $202,744
- Equity at exit
- $75,872
Cash invested: $32,200 (down + closing). Projections, not guarantees.
Landlord ↔ Tenant lean methodology
- Overall (STATE)
- 37 Tenant-Leaning
- State Hawaii
- 37 Tenant-Leaning · D+13
- County
- — inherits STATE
- City
- — inherits STATE
ZIP-level market 96815
- Home prices YoY
- 0.9%
- Rents YoY
- 6.0%
- Active inventory
- 814
- Price-to-rent
- 3.1×
Monthly cashflow live
- Estimated rent
- $3,043 high interval (Pro) →
- Mortgage (P&I)
- −$603
- Tax est. 1.5%
- −$144 /mo · $1,725/yr
- Insurance
- −$48
- Flood insurance flood zone
- −$66 /mo · $798/yr
- HOA
- −$781
- Vacancy / Maint / Mgmt
- −$639
- Net cashflow
- $761
Break-even live
UW: 25.0% down · 7.5% · 30yr · 1.5% tax · 5.0% vac · 8.0% maint · 8.0% mgmt
Financing live
Cash to close
- Down payment
- $28,750
- Closing costs
- $3,450
- Reserves months
- —
- Total cash needed
- —
Loan-product check · same deal, 3 products live
Conventional
25% down · 7.5% · 30yr
- Down + closing
- —
- Monthly P&I
- —
- Monthly cashflow
- —
- DSCR
- —
- Eligible?
- —
Personal DTI + credit; lowest rate.
DSCR
20% down · 8.5% · 30yr
- Down + closing
- —
- Monthly P&I
- —
- Monthly cashflow
- —
- DSCR
- —
- Eligible?
- —
No personal income docs; deal must DSCR.
Hard money
10% down · 12.0% · 12mo
- Down + closing
- —
- Monthly P&I
- —
- Monthly cashflow
- —
- DSCR
- —
- Eligible?
- —
Short-term bridge; refi at stabilization.
Rent comps 40 comps
| Address | Beds | Baths | Sqft | Rent | $/sqft | DOM | Units | Dist |
|---|---|---|---|---|---|---|---|---|
| 425 Ena Rd Unit 204C Honolulu, HI | 1.0 | 1.0 | 600 | $2,700 | $4.50 | 23d | 1 | 0.03mi |
| 411 Hobron Ln Honolulu, HI | 1.0 | 1.0 | 575 | $3,322 | $5.78 | 3d | 4 | 0.11mi |
| 411 Hobron Ln Honolulu, HI | 1.0 | 1.0 | 575 | $3,475 | $6.04 | 44d | 3 | 0.11mi |
| 411 Hobron Ln Honolulu, HI | 1.0 | 1.0 | 566 | $3,575 | $6.31 | 43d | 2 | 0.11mi |
| 411 Hobron Ln Unit 1327718P Honolulu, HI | 1.0 | 1.0 | 538 | $3,558 | $6.61 | 11d | 1 | 0.11mi |
| 400 Hobron Ln #2712 Honolulu, HI | 1.0 | 1.0 | 582 | $2,700 | $4.64 | 11d | 1 | 0.11mi |
| 1778 Ala Moana Blvd #1219 Honolulu, HI | 1.0 | 1.0 | 724 | $4,600 | $6.35 | 23d | 1 | 0.21mi |
| 1778 Ala Moana Blvd #3318 Honolulu, HI | 1.0 | 1.0 | 683 | $3,400 | $4.98 | 3d | 1 | 0.21mi |
| 1778 Ala Moana Blvd #2606 Honolulu, HI | 1.0 | 1.0 | 724 | $2,895 | $4.00 | 3d | 1 | 0.21mi |
| 1778 Ala Moana Blvd #801 Honolulu, HI | 1.0 | 1.0 | 724 | $3,400 | $4.70 | 23d | 1 | 0.21mi |
| 1778 Ala Moana Blvd #1307 Honolulu, HI | 1.0 | 1.0 | 683 | $2,900 | $4.25 | 23d | 1 | 0.21mi |
| 1778 Ala Moana Blvd #1317 Honolulu, HI | 1.0 | 1.0 | 683 | $2,775 | $4.06 | 21d | 1 | 0.21mi |
| 1778 Ala Moana Blvd Unit 1541754P Honolulu, HI | 1.0 | 1.0 | 721 | $4,387 | $6.08 | 14d | 1 | 0.22mi |
| 2045 Kalakaua Ave Honolulu, HI | 1.0 | 1.0 | 657 | $4,200 | $6.39 | 43d | 1 | 0.24mi |
| 1777 Ala Moana Blvd Unit 1327715P Honolulu, HI | 1.0 | 1.0 | 495 | $5,590 | $11.29 | 43d | 1 | 0.26mi |
| 1861 Kapiolani Blvd Unit C Honolulu, HI | 1.0 | 1.0 | 525 | $2,700 | $5.14 | 21d | 1 | 0.27mi |
| 1765 Ala Moana Blvd #1183 Honolulu, HI | 1.0 | 1.0 | 440 | $3,100 | $7.05 | 3d | 1 | 0.30mi |
| 419A Atkinson Dr Honolulu, HI | 2.0 | 1.0 | 664 | $2,698 | $4.06 | 17d | 2 | 0.32mi |
| 419A Atkinson Dr #1103 Honolulu, HI | 2.0 | 1.0 | 664 | $2,700 | $4.07 | 16d | 1 | 0.32mi |
| 475 Atkinson Dr Honolulu, HI | 1.0–2.0 | 1.0 | 855 | $2,700 | $3.16 | 23d | 2 | 0.33mi |
| 475 Atkinson Dr Honolulu, HI | 1.0–2.0 | 1.0 | 798 | $2,600 | $3.26 | 21d | 3 | 0.33mi |
| 440 Olohana St Unit 1327703P Honolulu, HI | 1.0 | 1.0 | 355 | $4,055 | $11.42 | 11d | 1 | 0.33mi |
| 440 Olohana St Unit 1327711P Honolulu, HI | 1.0 | 1.0 | 355 | $3,741 | $10.54 | 2d | 1 | 0.33mi |
| 2333 Kapiolani Blvd Unit 1008B Honolulu, HI | 2.0 | 1.0 | 600 | $2,700 | $4.50 | 23d | 1 | 0.43mi |
| 2140 Khi AVE Unit 2006 Honolulu, HI | 1.0 | 1.0 | 553 | $3,400 | $6.15 | 3d | 1 | 0.44mi |
| 2140 Khi AVE Unit 2306 Honolulu, HI | 1.0 | 1.0 | 553 | $2,700 | $4.88 | 17d | 1 | 0.44mi |
| 2140 Khi AVE Unit 803 Honolulu, HI | — | 1.0 | 460 | $4,990 | $10.85 | 43d | 1 | 0.44mi |
| 2140 Khi Ave Honolulu, HI | 1.0 | 1.0 | 577 | $4,500 | $7.80 | 23d | 1 | 0.44mi |
| 2140 Khi Ave. unit Ph 2506 Honolulu, HI | 1.0 | 1.0 | 678 | $3,200 | $4.72 | 14d | 1 | 0.44mi |
| 2121 Ala Wai Blvd Honolulu, HI | 2.0 | 1.0–3.0 | 1006 | $4,400 | $4.37 | 10d | 1 | 0.46mi |
| 2121 Ala Wai Blvd Honolulu, HI | 2.0 | 1.0–3.0 | 1006 | $4,150 | $4.12 | 3d | 2 | 0.46mi |
| 2121 Ala Wai Blvd Honolulu, HI | 2.0 | 1.0–3.0 | 1006 | $4,200 | $4.17 | 21d | 2 | 0.46mi |
| 1655 Makaloa St #1510 Honolulu, HI | 1.0 | 1.0 | 500 | $2,600 | $5.20 | 21d | 1 | 0.47mi |
| 223 Saratoga Rd #1012 Honolulu, HI | — | 1.0 | 559 | $2,700 | $4.83 | 17d | 1 | 0.49mi |
| 445 Kaiolu St Honolulu, HI | 1.0 | 1.0 | 490 | $3,400 | $6.94 | 17d | 1 | 0.50mi |
| 430 Lewers St Unit 14D Honolulu, HI | 1.0 | 1.0 | 732 | $2,900 | $3.96 | 23d | 1 | 0.51mi |
| 430 Lewers St Unit 25E Honolulu, HI | 1.0 | 1.0 | 673 | $2,700 | $4.01 | 23d | 1 | 0.51mi |
| 500 University Ave Honolulu, HI | 1.0–2.0 | 1.0–2.5 | 826 | $2,650 | $3.21 | 11d | 3 | 0.51mi |
| 555 University Ave Honolulu, HI | 1.0 | 1.0 | 684 | $2,850 | $4.17 | 3d | 2 | 0.57mi |
| 2211 Ala Wai Blvd Honolulu, HI | 1.0 | 1.0 | 437 | $3,100 | $7.09 | 23d | 1 | 0.58mi |
HOA detail
- Monthly dues
- $781 · $9,372/yr
- Likely covers
- internetcablepoolsecurity
Listing history 30 events
-
2026-06-18days on market $115,000 Active 72 DOM
-
2026-06-17days on market $115,000 Active 71 DOM
-
2026-06-16days on market $115,000 Active 70 DOM
-
2026-06-15days on market $115,000 Active 69 DOM
-
2026-06-13days on market $115,000 Active 67 DOM
-
2026-06-13days on market $115,000 Active 66 DOM
-
2026-06-10days on market $115,000 Active 64 DOM
-
2026-06-09days on market $115,000 Active 63 DOM
-
2026-06-08days on market $115,000 Active 62 DOM
-
2026-06-07days on market $115,000 Active 61 DOM
-
2026-06-05days on market $115,000 Active 58 DOM
-
2026-06-03days on market $115,000 Active 57 DOM
-
2026-06-02days on market $115,000 Active 56 DOM
-
2026-06-01days on market $115,000 Active 55 DOM
-
2026-05-31days on market $115,000 Active 54 DOM
-
2026-05-13$2,060
-
2026-04-06$115,000 Active 685-char remark
Show marketing remark (685 chars)
Charming 1-bedroom, 1-bath co-op at The Kalia in Waikiki! Approx. 588 sq ft with enclosed lanai for expanded bedroom space and improved functionality. Features new luxury vinyl flooring, fresh interior, and a well-appointed kitchen and bath—move-in ready. Secure, gated community with pool, BBQ area, security patrol, and cameras. Parking available via waitlist. Conveniently located in proximity to Hilton Hawaiian Village, Ala Moana, beaches, shopping, and dining. Grocery, bakery, food pantry, and post office across the street. Leasehold with fixed increases through 2048. 2026 monthly fee $1,503.94 includes lease rent, utilities, internet, and co-op taxes. Cable $54/month.
-
2024-12-31historical $2,000
-
2024-12-23historical
-
2024-12-18price $2,000
-
2024-12-04$2,060
-
2024-12-04historical $2,060
-
2024-11-13$2,060
-
2024-11-02historical $2,100
-
2024-10-23$2,100
-
2024-03-15$118,888 Active
-
2010-01-22soldstatus $52,500
-
2010-01-22soldstatus $52,500
-
2009-01-05$58,000
-
2004-10-12soldstatus $74,000
ⓘ Source: listings_history table (triggers on properties + properties_extension) + one-shot
backfill from property_details.listing_events for pre-trigger history.
Climate risk First Street
- Flood 7/10 Severe FEMA zone X (unshaded) · 75% chance over 30 yrs
- Air quality 1/10 Low
Nearby sold comps map
Loading sold comps map…
Walkable amenities ~0.75 mi
Loading nearby amenities…
Taxation est. · year 1
- Rental income
- $36,511
- − Mortgage interest
- −$6,442
- − Property taxes
- −$1,725
- − Insurance
- −$1,372
- − Repairs & maintenance
- −$2,921
- − Management
- −$2,921
- − HOA
- −$9,372
- − Depreciation
- −$3,345
- Taxable income
- $8,413
- Est. tax owed @ 24.0%
- −$2,019
- After-tax cash flow
- $7,118/yr
For passive investors: Depreciation is non-cash, so a rental often shows a tax loss while cash-flowing — sheltering income. Rental losses are passive: they offset passive income freely, and up to $25,000/yr can offset ordinary (W-2) income if you actively participate and your MAGI is under $100k (phasing out to $0 by $150k); unused losses carry forward. On sale, claimed depreciation is recaptured at up to 25%, and gains may owe capital-gains tax (a 1031 exchange can defer both). Figures are a year-1 estimate at your 24.0% rate — not tax advice; consult a CPA.
Schools (NCES district)
- District
- Hawaii Department Of Education
- NCES district ID
- 1500030
- Math proficiency
- 32% ▼ -10.00%
- Reading proficiency
- 50% ▼ -3.00%
- Median HH income
- $69,005
- Composite
- 37.07/100
- National rank
- #4504
- State rank
- #1 of 1 in HI
Livability — Urban Honolulu
No livability data for this city. (Only ~50 U.S. cities are tracked.)
Census & demographics
- Census place
- Urban Honolulu, HI
- County
- Honolulu County · 963,448 people
- City population
- 309,956
- Metro
- Urban Honolulu, HI
- Population (ZIP)
- 27,530
- Household income
- $77,096
- Rent vs Own
- Severe rent burden
- 2422.0
Population outlook (Honolulu County) Hauer SSP2
- Today (2025)
- 1,072,641 people
- By 2030
- 1,110,460 · +3.5%
- By 2040
- 1,181,593 · +10.2%
- By 2050
- 1,257,584 · +17.2%
- By 2075
- 1,501,120 · +39.9%
- By 2100
- 1,764,430 · +64.5%
Race, ethnicity, and origin ACS 2023
- Neighborhood character
- Highly diverse neighborhood (Simpson 0.71)
- Race & ethnicity
- Asian 41% White 35% Two or more races 16% Hispanic / Latino 6% Pacific Islander 4% Black 2%
- Hispanic origin (detail)
- Mexican 3% Puerto Rican 1%
- Common ancestry
- Romanian 2% Lithuanian 2% Slovak 2%
- Foreign-born
- 30% · China, South Korea, Canada
- Languages at home
- 66% English-only · Other Asian/Pacific 15% Chinese 5% Korean 3%
Political lean MEDSL · Honolulu
- 2024 margin
- Strong D (+21.6) · D 59.9% · R 38.3% · Other 1.8%
- 2008→2024 swing
- -19.4pp toward R · 2008: 41.1pp · 2024: 21.6pp
- All cycles
- 2024: D+21.6 2020: D+26.9 2016: D+29.9 2012: D+39.1 2008: D+41.1
Not yet ingested
- Civics
- —
Market trends
- HPI YoY
- ▲ 2.74%
- Current HPI
- 291.9404
- Rent YoY
- ▲ 6.00%
- Metro
- Urban Honolulu, HI
- State GDP YoY
- —
- F500 in state
- 0
Price history
-97.2% since first listed15 events — show timeline
- 2026-05-13 Listed for Rent $2,060 HICMLS
- 2026-04-06 Listed $115,000 HiCentral MLS
- 2024-12-31 Rental Removed $2,000 HICMLS
- 2024-12-23 Listing Removed — HiCentral MLS
- 2024-12-18 Price Changed $2,000 HICMLS
- 2024-12-04 Listed for Rent $2,060 HICMLS
- 2024-12-04 Rental Removed $2,060 HICMLS
- 2024-11-13 Listed for Rent $2,060 HICMLS
- 2024-11-02 Rental Removed $2,100 HICMLS
- 2024-10-23 Listed for Rent $2,100 HICMLS
- 2024-03-15 Listed $118,888 HiCentral MLS
- 2010-01-22 Sold (Public Records) $52,500 Public Records
- 2010-01-22 Sold (MLS) $52,500 HiCentral MLS
- 2009-01-05 Listed $58,000 HiCentral MLS
- 2004-10-12 Sold (Public Records) $74,000 Public Records
Cash-flow waterfall
monthlySold comps — $/sqft
last 12 mo · ≤1 miLoading sold comps…