8708 Fm 127 · Mount Pleasant, TX
Flood risk 1/10 · Minimal
- FEMA flood zone
- X (unshaded)
- Chance of flooding over 30 yrs
- 0.0%
- Est. flood insurance / yr
- $507 – $1,088
Fire risk 3/10 · Minor
- Est. fire insurance / yr
- $1,222 – $2,270
Heat risk 7/10 · Major
- Hot days now (above 111°F)
- 7 days/yr
- Hot days in 30 yrs
- 24 days/yr
Wind risk 6/10 · Moderate
- Chance of severe wind over 30 yrs
- 27.0%
Air-quality risk 1/10 · Minimal
- Unhealthy air days now
- 0 days/yr
- Unhealthy air days in 30 yrs
- 0 days/yr
Risk factors via First Street. Map © Google.
Why this score? — see what drove the C+ grade
The composite is a weighted blend of 9 inputs, each scored 0–100. Each bar is that input's sub-score; the figure is the points it added to the 100-point composite (weight × sub-score).
- Cash flow +27.3/30.0
- DSCR +9.5/10.0
- ARV discount +7.5/15.0
- 1% rule +7.4/10.0
- Livability +3.9/5.0
- Schools +3.7/10.0
- Rent growth +2.5/5.0
- Condition / age +2.2/5.0
- Appreciation +0.0/10.0
$130,000
🖨 Deal sheet (PDF) 📄 Offer letter ✓ Due diligence
Listing remarks MLS
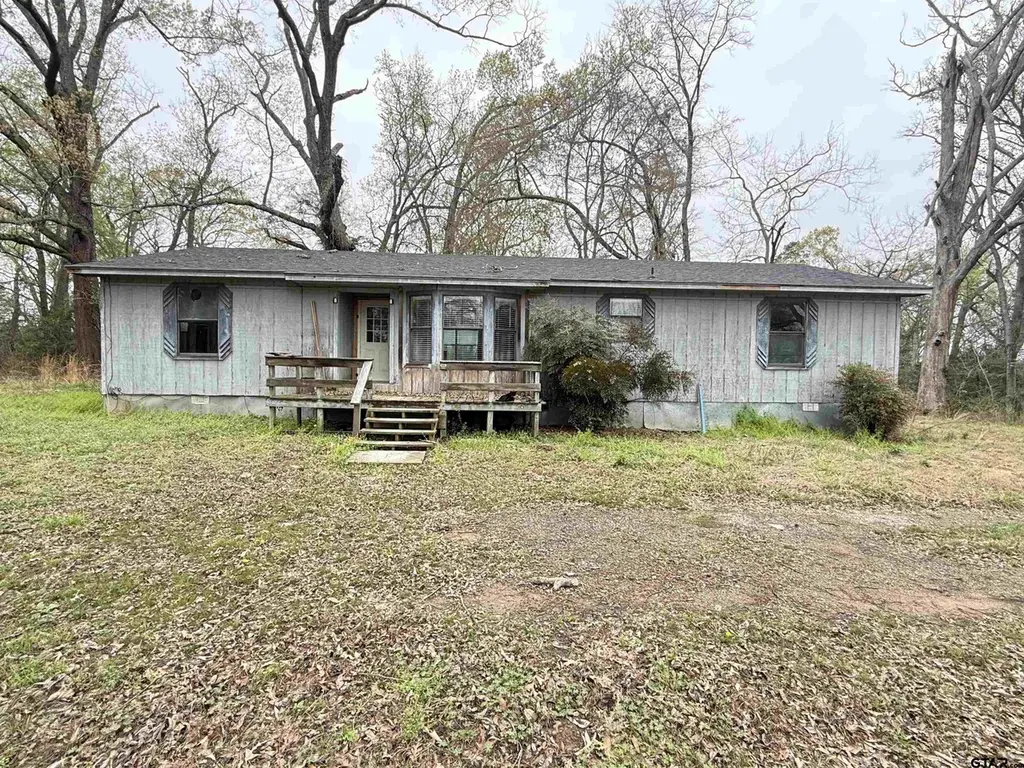
Handy Man Alert! This 3BR-2BA Home has had some renovations done. There's 1664 Sq Ft of living space, and you have 1.09 Acres to make your own. There's enough space here for a small homestead. Located in Mount Pleasant, Texas - Titus County, with plenty of amenities nearby. Lake Bob Sandlin and Cypress Springs Lake are only minutes away. In 2022 a New Roof and New HVAC system was added. The kitchen is spacious, and has a large dining area attached, as well as a breakfast bar. The living room features a vaulted ceiling, and plenty of space for get togethers. The primary bath has double vanities-sinks and there's lots of closet space. BBQ on the back deck, and enjoy the views.
Key facts
- 1.09 acres
- Vaulted ceiling
- Large dining area
Tags
Neighborhood map
What this means for you Summary
Snapshot
- This is a 3-bed/2.0-bath single-family listed at $130k. Condition is rated fair.
Deal economics
- At list price, monthly cash flow is $375 ($4k/yr) — positive.
- The deal already cash-flows at list — no discount required.
- Meets the 1% rule at list price ($2k rent vs $130k).
- Recommended offer: $118k (9.0% below list) — sets the bar for market timing.
- Cap rate 9.8% vs local median 3.1% in Mount Pleasant — top-decile yield for the area; either an underpriced asset or a hidden risk that comps aren't pricing in. Stress-test before assuming the spread holds.
Location & tenants
- Location reads 77/100 on livability (#81 in TX, #2,808 nationally) — a middle-class / working-renter tenant base. Strengths: cost of living A+, housing A+, health & safety A+; Watch: employment C-, amenities D-, commute F.
- Mount Pleasant ISD (town): math 45% / reading 44% proficiency, ranked #291 of 826 in TX (top 35%) — families likely to look elsewhere, expect single-tenant / working-renter base with shorter leases; 74% free/reduced lunch — lower-income household profile, screen leases tightly.
- Zoned schools: Child Development Center (452 students, 91% FRL); Mount Pleasant J H (math 40% / reading 45%, grade D-, #553 of 1,662 statewide, top 34%, 760 students, 81% FRL); Mount Pleasant H S (math 68% / reading 54%, grade C+, #258 of 1,632 statewide, top 16%, 1,521 students, 79% FRL).
- Market conditions: 384 active listings in the ZIP; 47 units permitted in Titus County in 2024 (10 in 5+ unit buildings).
- This rent runs 34% of the median local income ($56k/yr) — at the standard rent-burdened threshold; future hikes will face affordability resistance.
Forward outlook
- Local home prices are declining (-3.0%/yr); year-one equity from $899 of loan paydown is wiped out by about $4k of value loss. Plan a longer hold.
- At projected returns (-3.0% appreciation + 3.0% rent growth), your $36k cash investment doubles in ~10 years — after that, you're playing with house money.
Negotiation context
- It's been on market 104 days — a 9% lower offer ($118k) is reasonable based on typical stale-listing flexibility.
- 2 sale attempts since 3y ago; this cycle's ask has dropped $10k (7%) from the opening price — seller is motivated, your offer sets the floor, not the list.
Risks & watch-outs
- Climate carrying-cost: major wind risk, 27% chance of damaging wind over 30y; extreme-heat days projected 7→24/yr by 2055 (HVAC capex compounding) — expect insurance premiums to compound above CPI over the hold.
Questions for the listing agent
- It's been on market 104 days. Have you received any prior offers? Is the seller open to a 9% concession, seller financing, or rate buy-down credit?
- Have any recent inspections been done? Can we get a copy of the seller's disclosures and any deferred-maintenance estimates?
- Built in 1975 — when were the roof, HVAC, electrical panel, plumbing, and water heater last replaced?
- Why hasn't it sold? Are there any deal-killer items the seller is aware of (foundation, flood, title, zoning, code violations)?
- Is there a deadline driving the sale (1031 exchange, divorce, estate, relocation)? That informs how much negotiation room exists.
- Schools are D-rated, which usually means shorter tenancies and higher turnover. Who's the typical renter profile here, and what's been the actual vacancy rate?
- What's the average days-on-market for RENTAL listings here right now (not sales)? A rising rental-DOM trend means longer vacancies and softer asking-rent achievability than the comps imply.
- What's the recent tenant-quality profile in this submarket — average credit score on applications, eviction rate, late-payment / NSF rate, and stable-employment percentage? A property-management company in the area should have these aggregated.
- How much new for-sale + rental construction is in the pipeline within 1–3 miles? Heavy new supply typically softens prices + rents 12–24 months out; constrained supply supports both.
Investment metrics
- 1% rule
- 1.24% ✓
- Cap rate
- 9.75%
- Cash-on-cash
- 12.36%
- DSCR
- 1.55
- GRM
- 6.7
CMA / ARV
- ARV (median comp)
- $388,318
- List price
- $130,000
- Delta
- -66.52%
- Verdict
- UNDERPRICED
- Comps
- 4 within 1.0 mi
Projected returns pro-forma
-3.0% appreciation · 3.0% rent growth · sell at horizon
- IRR
- 2.0%
- Equity multiple
- 1.08×
- Total profit
- $2,830
- Equity at exit
- $19,383
- IRR
- 11.6%
- Equity multiple
- 1.91×
- Total profit
- $33,301
- Equity at exit
- $11,240
Cash invested: $36,400 (down + closing). Projections, not guarantees.
Landlord ↔ Tenant lean methodology
- Overall (STATE)
- 87 Strongly Landlord-Friendly
- State Texas
- 87 Strongly Landlord-Friendly · R+5
- County
- — inherits STATE
- City
- — inherits STATE
ZIP-level market 75455
- Home prices YoY
- -27.0%
- Active inventory
- 384
- Price-to-rent
- 6.7×
Monthly cashflow live
- Estimated rent
- $1,612 medium interval (Pro) →
- Mortgage (P&I)
- −$682
- Tax est. 1.5%
- −$162 /mo · $1,950/yr
- Insurance
- −$54
- HOA
- −$0
- Lot rent
- −$0
- Vacancy / Maint / Mgmt
- −$338
- Net cashflow
- $375
Break-even live
Sensitivity live
| Price | -10% $465 | -5% $420 | +0% $375 | +5% $330 | +10% $285 |
|---|---|---|---|---|---|
| Rent | -10% $247 | -5% $311 | +0% $375 | +5% $438 | +10% $502 |
| Rate | -1.0pp $440 | -0.5pp $408 | base $375 | +0.5pp $341 | +1.0pp $307 |
UW: 25.0% down · 7.5% · 30yr · 1.5% tax · 5.0% vac · 8.0% maint · 8.0% mgmt
Financing live
Cash to close
- Down payment
- $32,500
- Closing costs
- $3,900
- Reserves months
- —
- Total cash needed
- —
Loan-product check · same deal, 3 products live
Conventional
25% down · 7.5% · 30yr
- Down + closing
- —
- Monthly P&I
- —
- Monthly cashflow
- —
- DSCR
- —
- Eligible?
- —
Personal DTI + credit; lowest rate.
DSCR
20% down · 8.5% · 30yr
- Down + closing
- —
- Monthly P&I
- —
- Monthly cashflow
- —
- DSCR
- —
- Eligible?
- —
No personal income docs; deal must DSCR.
Hard money
10% down · 12.0% · 12mo
- Down + closing
- —
- Monthly P&I
- —
- Monthly cashflow
- —
- DSCR
- —
- Eligible?
- —
Short-term bridge; refi at stabilization.
Listing history 21 events
-
2026-06-22days on market $130,000 Active 104 DOM
-
2026-06-19days on market $130,000 Active 101 DOM
-
2026-06-18days on market $130,000 Active 100 DOM
-
2026-06-17days on market $130,000 Active 99 DOM
-
2026-06-16days on market $130,000 Active 98 DOM
-
2026-06-15days on market $130,000 Active 97 DOM
-
2026-06-14days on market $130,000 Active 95 DOM
-
2026-06-12days on market $130,000 Active 94 DOM
-
2026-06-09days on market $130,000 Active 91 DOM
-
2026-06-08days on market $130,000 Active 90 DOM
-
2026-06-07days on market $130,000 Active 89 DOM
-
2026-06-07days on market $130,000 Active 88 DOM
-
2026-06-03days on market $130,000 Active 85 DOM
-
2026-06-02days on market $130,000 Active 84 DOM
-
2026-06-01days on market $130,000 Active 83 DOM
-
2026-05-31days on market $130,000 Active 82 DOM
-
2026-05-30days on market $130,000 Active 81 DOM
-
2026-04-14price $130,000 684-char remark
Show marketing remark (684 chars)
Handy Man Alert! This 3BR-2BA Home has had some renovations done. There's 1664 Sq Ft of living space, and you have 1.09 Acres to make your own. There's enough space here for a small homestead. Located in Mount Pleasant, Texas - Titus County, with plenty of amenities nearby. Lake Bob Sandlin and Cypress Springs Lake are only minutes away. In 2022 a New Roof and New HVAC system was added. The kitchen is spacious, and has a large dining area attached, as well as a breakfast bar. The living room features a vaulted ceiling, and plenty of space for get togethers. The primary bath has double vanities-sinks and there's lots of closet space. BBQ on the back deck, and enjoy the views.
-
2026-03-10$139,900 Active 684-char remark
Show marketing remark (684 chars)
Handy Man Alert! This 3BR-2BA Home has had some renovations done. There's 1664 Sq Ft of living space, and you have 1.09 Acres to make your own. There's enough space here for a small homestead. Located in Mount Pleasant, Texas - Titus County, with plenty of amenities nearby. Lake Bob Sandlin and Cypress Springs Lake are only minutes away. In 2022 a New Roof and New HVAC system was added. The kitchen is spacious, and has a large dining area attached, as well as a breakfast bar. The living room features a vaulted ceiling, and plenty of space for get togethers. The primary bath has double vanities-sinks and there's lots of closet space. BBQ on the back deck, and enjoy the views.
-
2023-09-13soldstatus 677-char remark
Show marketing remark (677 chars)
Location, location, location! This home is just minutes from Lake Bob Sandlin, Monticello and Lake Cypress Springs. The home features 3 bedroom, 2 baths, large eat-in kitchen with breakfast bar, and large great room with vaulted ceiling, ceiling fans, double vanities in master bath, and lots of closet space. This gorgeous property is on 1.09 acres with stunning views from the back deck. The home boasts a new roof in Sept. 2022, and new central air and heat system in Sept. 2022. The spacious setting you're looking for at the right price. If you're looking to live the lake life or simply just get out of the city to raise your family, this is the home for you! Call today!
-
2023-08-07$139,000 677-char remark
Show marketing remark (677 chars)
Location, location, location! This home is just minutes from Lake Bob Sandlin, Monticello and Lake Cypress Springs. The home features 3 bedroom, 2 baths, large eat-in kitchen with breakfast bar, and large great room with vaulted ceiling, ceiling fans, double vanities in master bath, and lots of closet space. This gorgeous property is on 1.09 acres with stunning views from the back deck. The home boasts a new roof in Sept. 2022, and new central air and heat system in Sept. 2022. The spacious setting you're looking for at the right price. If you're looking to live the lake life or simply just get out of the city to raise your family, this is the home for you! Call today!
ⓘ Source: listings_history table (triggers on properties + properties_extension) + one-shot
backfill from property_details.listing_events for pre-trigger history.
Climate risk First Street
- Flood 1/10 Low FEMA zone X (unshaded) · 0% chance over 30 yrs
- Wildfire 3/10 Moderate
- Heat 7/10 Severe 7 d/yr ≥111°F today · 24 d/yr by 30 yrs out
- Wind 6/10 Major 27% chance of damaging wind over 30 yrs
- Air quality 1/10 Low 0 unhealthy d/yr today · 0 by 30 yrs out
Nearby sold comps map
Loading sold comps map…
Walkable amenities ~0.75 mi
Loading nearby amenities…
Taxation est. · year 1
- Rental income
- $19,340
- − Mortgage interest
- −$7,282
- − Property taxes
- −$1,950
- − Insurance
- −$650
- − Repairs & maintenance
- −$1,547
- − Management
- −$1,547
- − Depreciation
- −$3,782
- Taxable income
- $2,582
- Est. tax owed @ 24.0%
- −$620
- After-tax cash flow
- $3,878/yr
For passive investors: Depreciation is non-cash, so a rental often shows a tax loss while cash-flowing — sheltering income. Rental losses are passive: they offset passive income freely, and up to $25,000/yr can offset ordinary (W-2) income if you actively participate and your MAGI is under $100k (phasing out to $0 by $150k); unused losses carry forward. On sale, claimed depreciation is recaptured at up to 25%, and gains may owe capital-gains tax (a 1031 exchange can defer both). Figures are a year-1 estimate at your 24.0% rate — not tax advice; consult a CPA.
Condition & rehab AI · 12 photos
This home requires moderate renovations, focusing on exterior repairs and landscaping to improve its resale and rental value.
Repairs flagged
- Major exterior siding — severe damage and peeling
- Major landscaping — overgrown vegetation and unkempt yard
Value-add opportunities
- Resale paint exterior siding — enhances curb appeal and property value
- Resale landscaping — improves curb appeal and property value
- Resale replace exterior siding — major repair needed for long-term value
- Both replace HVAC system — outdated system and potential energy savings
Renovation cost estimate screening
| Repair item | Severity | Est. cost |
|---|---|---|
| exterior siding · severe damage and peeling | Major | $15,000–50,000 |
| landscaping · overgrown vegetation and unkempt yard | Major | $15,000–50,000 |
| Total estimated repair cost · 2 items | $30,000–100,000 |
Value-add ROI direction
- Resale paint exterior siding — enhances curb appeal and property value ↑
- Resale landscaping — improves curb appeal and property value ↑
- Resale replace exterior siding — major repair needed for long-term value ↑
- Both replace HVAC system — outdated system and potential energy savings ↑
ⓘ Cost ranges are severity-bucket heuristics (US national rule-of-thumb). Get contractor quotes + a written scope before underwriting a rehab budget.
Schools (NCES district)
- District
- Mount Pleasant ISD
- NCES district ID
- 4831760
- Math proficiency
- 45% ▼ -7.00%
- Reading proficiency
- 44% ▲ 2.00%
- Median HH income
- $40,642
- Composite
- 37.35/100
- National rank
- #4437
- State rank
- #291 of 826 in TX
Livability — Mount Pleasant
- Score
- 77/100
- State rank
- #81
- US rank
- #2808
Category grades
Schools grade is shown separately in the Schools card above.
Census & demographics
- County
- Titus County · 26,903 people
- City population
- 26,903
- Metro
- Mount Pleasant, TX
- Population (ZIP)
- 26,903
- Household income
- $56,163
- Rent vs Own
- Severe rent burden
- 758.0
Population outlook (Titus County) Hauer SSP2
- Today (2025)
- 33,205 people
- By 2030
- 33,187 · -0.1%
- By 2040
- 32,931 · -0.8%
- By 2050
- 32,231 · -2.9%
- By 2075
- 29,507 · -11.1%
- By 2100
- 25,369 · -23.6%
Race, ethnicity, and origin ACS 2023
- Neighborhood character
- Diverse neighborhood (Simpson 0.61)
- Race & ethnicity
- Hispanic / Latino 45% White 42% Two or more races 15% Black 10% Asian 1%
- Hispanic origin (detail)
- Mexican 42%
- Common ancestry
- Lithuanian 1% Slovak 1% Italian 1%
- Foreign-born
- 18% · Canada, Vietnam
- Languages at home
- 61% English-only · Spanish 37% Vietnamese 1%
Political lean MEDSL · Titus
- 2024 margin
- Solid R (+54.7) · D 22.3% · R 77.0%
- 2008→2024 swing
- -23.5pp toward R · 2008: -31.2pp · 2024: -54.7pp
- All cycles
- 2024: R+54.7 2020: R+44.7 2016: R+42.1 2012: R+39.0 2008: R+31.2
Not yet ingested
- Civics
- —
Market trends
- HPI YoY
- ▼ -79.66%
- Current HPI
- 215.4205
- Rent YoY
- —
- Metro
- Mount Pleasant, TX
- State GDP YoY
- ▲ 3.95%
- F500 in state
- 110
Industry mix (Fortune 500 HQ in TX)
| Industry | F500 HQs | Revenue |
|---|---|---|
| Energy | 16 | $1,198B |
|
||
| Technology | 5 | $198B |
|
||
| Engineering / Construction | 4 | $72B |
|
||
| Energy Services | 3 | $60B |
|
||
| Utilities | 3 | $41B |
|
||
| Healthcare | 2 | $330B |
|
||
Price history
-6.5% since first listed4 events — show timeline
- 2026-04-14 Price Changed $130,000 GTAR
- 2026-03-10 Listed $139,900 GTAR
- 2023-09-13 Sold (MLS) — GTAR
- 2023-08-07 Listed $139,000 GTAR
Cash-flow waterfall
monthlySold comps — $/sqft
last 12 mo · ≤1 miLoading sold comps…