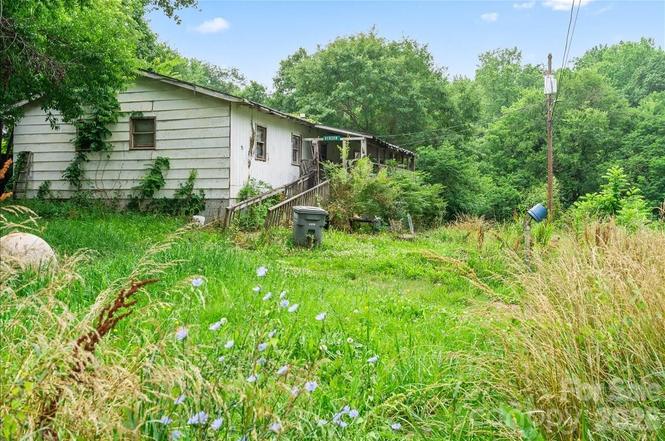
668 Childers St · Belmont, NC
Flood risk 1/10 · Minimal
- FEMA flood zone
- X (unshaded)
- Chance of flooding over 30 yrs
- 0.0%
- Est. flood insurance / yr
- $507 – $1,088
Fire risk 3/10 · Minor
- Est. fire insurance / yr
- $906 – $1,684
Heat risk 6/10 · Moderate
- Hot days now (above 104°F)
- 7 days/yr
- Hot days in 30 yrs
- 17 days/yr
Wind risk 5/10 · Moderate
- Chance of severe wind over 30 yrs
- 22.0%
Air-quality risk 3/10 · Minor
- Unhealthy air days now
- 3 days/yr
- Unhealthy air days in 30 yrs
- 4 days/yr
Risk factors via First Street. Map © Google.
Why this score? — see what drove the B grade
The composite is a weighted blend of 9 inputs, each scored 0–100. Each bar is that input's sub-score; the figure is the points it added to the 100-point composite (weight × sub-score).
- Cash flow +30.0/30.0
- 1% rule +10.0/10.0
- DSCR +10.0/10.0
- ARV discount +7.5/15.0
- Schools +3.6/10.0
- Livability +3.6/5.0
- Rent growth +3.2/5.0
- Condition / age +2.5/5.0
- Appreciation +0.0/10.0
$119,000
🖨 Deal sheet 📄 Offer letter ✓ Due diligence
Listing remarks
Tucked away in an established Belmont neighborhood, this property offers a unique opportunity just minutes from the charm and convenience of downtown Belmont. Enjoy close proximity to local dining, shopping, parks, schools, and recreational facilities while remaining within a desirable in-town location. Situated on a generous lot offering added privacy, the property provides ample outdoor space and potential for a variety of future possibilities. Convenient access to major highways and employment centers adds to the property's appeal. A compelling opportunity for investors, renovators, or buyers looking to add value in a highly desirable Belmont location. Property sold as-is.
Key facts
- 0.67 acre lot
- Built 1971
- Listed 7 days
Property features AI
Finance
- Other: Directions: From Wilkinson Blvd (US-74), turn onto Childers St. Continue to the end of the street near the baseball fields and Belmont Central Elementary School. The property is located on the left side of Childers St.
- HOA & community: No HOA
Exterior
- Parking: No garage; No designated parking features
- Utilities: City water; Public sewer
- Home design: Single-family residential property; Site-built construction; One story; R1 zoning
- Construction: Block and vinyl exterior materials; Crawl space foundation
- Exterior features: Lot is approximately 0.67 acres; Roads are gravel and dirt; Publicly maintained road
Interior
- Kitchen: No appliances listed
- Bedrooms: 3 bedrooms located on the main level
- Bathrooms: 1 full bathroom (main level)
- Heating & cooling: Wood stove heating; No central cooling
- Interior features: Wood stove for heating; Four total rooms
- Laundry & utility: No laundry features listed
Neighborhood map
What this means for you Summary
Snapshot
- This is a 3-bed/1.0-bath single-family listed at $119k.
Deal economics
- At list price, monthly cash flow is $710 ($9k/yr) — positive.
- The deal already cash-flows at list — no discount required.
- Meets the 1% rule at list price ($2k rent vs $119k).
- Cap rate 13.5% vs local median 2.3% in Belmont — top-decile yield for the area; either an underpriced asset or a hidden risk that comps aren't pricing in. Stress-test before assuming the spread holds.
Location & tenants
- Location reads 71/100 on livability (#105 in NC) — a middle-class / working-renter tenant base. Strengths: housing A+, employment A-, cost of living A-; Watch: crime D-, amenities F, commute F.
- Gaston County Schools (suburban): math 44% / reading 42% proficiency, ranked #93 of 178 in NC (top 52%) — families likely to look elsewhere, expect single-tenant / working-renter base with shorter leases.
- Market conditions: Rents rising (+2.7%/yr); 420 active listings in the ZIP; 10 comparable units currently listed for rent nearby; rentals at typical pace (median 21d on market — plan ~3-4 weeks tenant-placement turnaround); solid renter incomes; 2,069 units permitted in Gaston County in 2024 (142 in 5+ unit buildings).
Forward outlook
- Local home prices are declining (-3.0%/yr); year-one equity from $823 of loan paydown is wiped out by about $4k of value loss. Plan a longer hold.
- Gaston County population projected at +12% by 2050 — modest demand growth; plan on rents tracking national, not racing it.
- At projected returns (-3.0% appreciation + 2.7% rent growth), your $33k cash investment doubles in ~5 years — after that, you're playing with house money.
Negotiation context
- Only 7 days on market — expect competitive offers; lowballing is unlikely to land.
Risks & watch-outs
- Climate carrying-cost: moderate wind risk, 22% chance of damaging wind over 30y; extreme-heat days projected 7→17/yr by 2055 (HVAC capex compounding) — expect insurance premiums to compound above CPI over the hold.
Questions for the listing agent
- Built in 1971 — when were the roof, HVAC, electrical panel, plumbing, and water heater last replaced?
- Is there a deadline driving the sale (1031 exchange, divorce, estate, relocation)? That informs how much negotiation room exists.
- Crime grade is D in this area — have there been break-ins, vandalism, or insurance claims at this property in the last 3 years? What carrier currently insures it and at what premium?
- What's the average days-on-market for RENTAL listings here right now (not sales)? A rising rental-DOM trend means longer vacancies and softer asking-rent achievability than the comps imply.
- What's the recent tenant-quality profile in this submarket — average credit score on applications, eviction rate, late-payment / NSF rate, and stable-employment percentage? A property-management company in the area should have these aggregated.
- How much new for-sale + rental construction is in the pipeline within 1–3 miles? Heavy new supply typically softens prices + rents 12–24 months out; constrained supply supports both.
Investment metrics
- 1% rule
- 1.52% ✓
- Cap rate
- 13.46%
- Cash-on-cash
- 25.58%
- DSCR
- 2.14
- GRM
- 5.5
CMA / ARV
- ARV (on-the-fly)
- $255,552
- Comps found
- 12
Show comp detail 12 sales within ~0.75 mi
| Address | Dist | Beds/Ba | Sqft | Sold | Price | $/sf | Match |
|---|---|---|---|---|---|---|---|
| 804 Caldwell St | 0.36mi | 3/2.0 | 1,055 (+9%) | 1mo | $298,000 | $282 | 63 |
| 686 Childers St | 0.02mi | 2/1.0 (-1) | 1,073 (+11%) | 15mo | $223,750 | $209 | 63 |
| 127 Morning Glory Ave | 0.43mi | 3/1.0 | 1,007 (+4%) | 17mo | $220,000 | $218 | 59 |
| 222 6th St | 0.51mi | 2/2.0 (-1) | 1,006 (+4%) | 5mo | $300,000 | $298 | 56 |
| 107 Ervin St | 0.54mi | 2/1.0 (-1) | 930 (-4%) | 9mo | $233,500 | $251 | 55 |
| 4 S First St | 0.36mi | 2/1.0 (-1) | 900 (-7%) | 15mo | $220,000 | $244 | 54 |
| 919 Laye St Unit A | 0.54mi | 3/1.5 | 1,022 (+6%) | 13mo | $263,500 | $258 | 53 |
| 220 6th St | 0.50mi | 2/2.0 (-1) | 1,006 (+4%) | 13mo | $300,000 | $298 | 50 |
| 909 Laye St | 0.48mi | 2/2.0 (-1) | 1,021 (+6%) | 15mo | $299,000 | $293 | 47 |
| 201-A Ewing Dr | 0.33mi | 2/2.0 (-1) | 1,077 (+11%) | 12mo | $279,500 | $260 | 46 |
| 212 Sloan St | 0.55mi | 3/1.0 | 1,098 (+13%) | 12mo | $290,000 | $264 | 41 |
| 917 Laye St | 0.52mi | 2/1.0 (-1) | 842 (-13%) | 10mo | $240,000 | $285 | 40 |
Match score weights: distance 35% · size 25% · config 20% · recency 20%. Top-matched comps best support the ARV.
Projected returns pro-forma
-3.0% appreciation · 2.67% rent growth · sell at horizon
- IRR
- 18.8%
- Equity multiple
- 1.76×
- Total profit
- $25,320
- Equity at exit
- $17,743
- IRR
- 26.9%
- Equity multiple
- 3.33×
- Total profit
- $77,711
- Equity at exit
- $10,289
Cash invested: $33,320 (down + closing). Projections, not guarantees.
Landlord ↔ Tenant lean methodology
- Overall (STATE)
- 85 Strongly Landlord-Friendly
- State North Carolina
- 85 Strongly Landlord-Friendly · R+3
- County
- — inherits STATE
- City
- — inherits STATE
ZIP-level market 28012
- Home prices YoY
- -34.5%
- Rents YoY
- 2.7%
- Active inventory
- 420
- Price-to-rent
- 5.5×
Monthly cashflow live
- Estimated rent
- $1,807 high interval (Pro) →
- Mortgage (P&I)
- −$624
- Tax from tax record
- −$43 /mo · $520/yr
- Insurance
- −$50
- HOA
- −$0
- Vacancy / Maint / Mgmt
- −$379
- Net cashflow
- $710
Break-even live
UW: 25.0% down · 7.5% · 30yr · 1.5% tax · 5.0% vac · 8.0% maint · 8.0% mgmt
Financing live
Cash to close
- Down payment
- $29,750
- Closing costs
- $3,570
- Reserves months
- —
- Total cash needed
- —
Loan-product check · same deal, 3 products live
Conventional
25% down · 7.5% · 30yr
- Down + closing
- —
- Monthly P&I
- —
- Monthly cashflow
- —
- DSCR
- —
- Eligible?
- —
Personal DTI + credit; lowest rate.
DSCR
20% down · 8.5% · 30yr
- Down + closing
- —
- Monthly P&I
- —
- Monthly cashflow
- —
- DSCR
- —
- Eligible?
- —
No personal income docs; deal must DSCR.
Hard money
10% down · 12.0% · 12mo
- Down + closing
- —
- Monthly P&I
- —
- Monthly cashflow
- —
- DSCR
- —
- Eligible?
- —
Short-term bridge; refi at stabilization.
Rent comps 10 comps
| Address | Beds | Baths | Sqft | Rent | $/sqft | DOM | Units | Dist |
|---|---|---|---|---|---|---|---|---|
| 910 Edgemont Ave Belmont, NC | 3.0 | 1.5 | 1071 | $1,700 | $1.59 | 11d | 1 | 0.49mi |
| 3 Linestowe Dr Belmont, NC | 2.0 | 2.0 | 1000 | $1,565 | $1.56 | 24d | 1 | 0.60mi |
| 311 Forest Ln Belmont, NC | 2.0 | 1.0 | 775 | $1,550 | $2.00 | 15d | 1 | 0.63mi |
| 520 McLean Ave Belmont, NC | 1.0–3.0 | 1.0–2.5 | 982 | $2,335 | $2.38 | 1d | 17 | 0.72mi |
| 1200 River Dr Belmont, NC | 1.0–2.0 | 1.0–2.0 | 862 | $1,825 | $2.12 | 20d | 14 | 0.73mi |
| 409 Hawley Ave Unit 3 Belmont, NC | 2.0 | 1.5 | 816 | $1,195 | $1.46 | 4d | 1 | 0.86mi |
| 102 Lincoln St Belmont, NC | 2.0 | 1.0 | 860 | $1,650 | $1.92 | 24d | 1 | 1.13mi |
| 844 Hawley Ave Belmont, NC | 1.0–2.0 | 1.0 | 990 | $1,669 | $1.69 | 4d | 1 | 1.18mi |
| 104 Secrest Ave Belmont, NC | 2.0 | 1.0 | 725 | $1,399 | $1.93 | 20d | 1 | 1.19mi |
| 250 Nixon Rd Belmont, NC | 2.0 | 1.0 | 756 | $1,195 | $1.58 | 24d | 1 | 1.21mi |
Listing history 6 events
-
2026-06-18days on market $119,000 Active 7 DOM
-
2026-06-17days on market $119,000 Active 6 DOM
-
2026-06-16days on market $119,000 Active 5 DOM
-
2026-06-15days on market $119,000 Active 4 DOM
-
2026-06-13remarks 684-char remark
-
2026-06-13$119,000 Active 2 DOM
ⓘ Source: listings_history table (triggers on properties + properties_extension) + one-shot
backfill from property_details.listing_events for pre-trigger history.
Tax reassessment forecast NC · Resets to sale price
- Current annual tax
- $520 · $43/mo
- Projected year-2 tax
- $976 · $81/mo
- Expected delta
- +$456/yr (+$38/mo · 87.7%)
ⓘ Screening estimate from a state-policy table — verify with the county assessor before closing.
Climate risk First Street
- Flood 1/10 Low FEMA zone X (unshaded) · 0% chance over 30 yrs
- Wildfire 3/10 Moderate
- Heat 6/10 Major 7 d/yr ≥104°F today · 17 d/yr by 30 yrs out
- Wind 5/10 Major 22% chance of damaging wind over 30 yrs
- Air quality 3/10 Moderate 3 unhealthy d/yr today · 4 by 30 yrs out
Nearby sold comps map
Loading sold comps map…
Walkable amenities ~0.75 mi
Loading nearby amenities…
Taxation est. · year 1
- Rental income
- $21,680
- − Mortgage interest
- −$6,666
- − Property taxes
- −$520
- − Insurance
- −$595
- − Repairs & maintenance
- −$1,734
- − Management
- −$1,734
- − Depreciation
- −$3,462
- Taxable income
- $6,968
- Est. tax owed @ 24.0%
- −$1,672
- After-tax cash flow
- $6,851/yr
For passive investors: Depreciation is non-cash, so a rental often shows a tax loss while cash-flowing — sheltering income. Rental losses are passive: they offset passive income freely, and up to $25,000/yr can offset ordinary (W-2) income if you actively participate and your MAGI is under $100k (phasing out to $0 by $150k); unused losses carry forward. On sale, claimed depreciation is recaptured at up to 25%, and gains may owe capital-gains tax (a 1031 exchange can defer both). Figures are a year-1 estimate at your 24.0% rate — not tax advice; consult a CPA.
Schools (NCES district)
- District
- Gaston County Schools
- NCES district ID
- 3701620
- Math proficiency
- 44% ▲ 4.00%
- Reading proficiency
- 42% ▲ 1.00%
- Median HH income
- $43,644
- Composite
- 36.39/100
- National rank
- #4680
- State rank
- #93 of 178 in NC
Livability — Belmont
- Score
- 71/100
- State rank
- #105
- US rank
- #6753
Category grades
Schools grade is shown separately in the Schools card above.
Census & demographics
- Census place
- Belmont, NC
- County
- Gaston County · 201,497 people
- City population
- 26,556
- Metro
- Charlotte-Concord-Gastonia, NC-SC
- Population (ZIP)
- 26,556
- Household income
- $83,391
- Rent vs Own
- Severe rent burden
- 778.0
Population outlook (Gaston County) Hauer SSP2
- Today (2025)
- 230,027 people
- By 2030
- 237,300 · +3.2%
- By 2040
- 249,659 · +8.5%
- By 2050
- 257,806 · +12.1%
- By 2075
- 272,163 · +18.3%
- By 2100
- 268,652 · +16.8%
Race, ethnicity, and origin ACS 2023
- Neighborhood character
- Predominantly White (84%)
- Race & ethnicity
- White 84% Black 6% Hispanic / Latino 4% Two or more races 4% Asian 4%
- Common ancestry
- Serbian 3% Romanian 2% Slovak 2%
- Foreign-born
- 4% · Canada, Vietnam, China
- Languages at home
- 93% English-only · Spanish 2% Other Indo-European 2% French/Haitian/Cajun 1%
Political lean MEDSL · Gaston
- 2024 margin
- Strong R (+25.0) · D 37.0% · R 62.1%
- 2008→2024 swing
- 0.0pp no change · 2008: -25.0pp · 2024: -25.0pp
- All cycles
- 2024: R+25.0 2020: R+27.8 2016: R+32.1 2012: R+25.6 2008: R+25.0
Not yet ingested
- Civics
- —
Market trends
- HPI YoY
- ▼ -134.92%
- Current HPI
- 255.562
- Rent YoY
- ▲ 2.67%
- Metro
- Charlotte-Concord-Gastonia, NC-SC
- State GDP YoY
- ▲ 3.28%
- F500 in state
- 26
Industry mix (Fortune 500 HQ in NC)
| Industry | F500 HQs | Revenue |
|---|---|---|
| Financial Services | 2 | $213B |
|
||
| Retail | 2 | $95B |
|
||
| Industrial Conglomerate | 1 | $38B |
|
||
| Metals / Steel | 1 | $35B |
|
||
| Utilities | 1 | $30B |
|
||
| Industrial Machinery | 1 | $19B |
|
||
Price history
1 event — show timeline
- 2026-06-11 Listed $119,000 CANOPYMLS as Distributed by MLS Grid
Property tax history
+0.1%/yrLatest (2025): $520 · +0.0% YoY. Source: county tax records.
Cash-flow waterfall
monthlySold comps — $/sqft
last 12 mo · ≤1 miLoading sold comps…