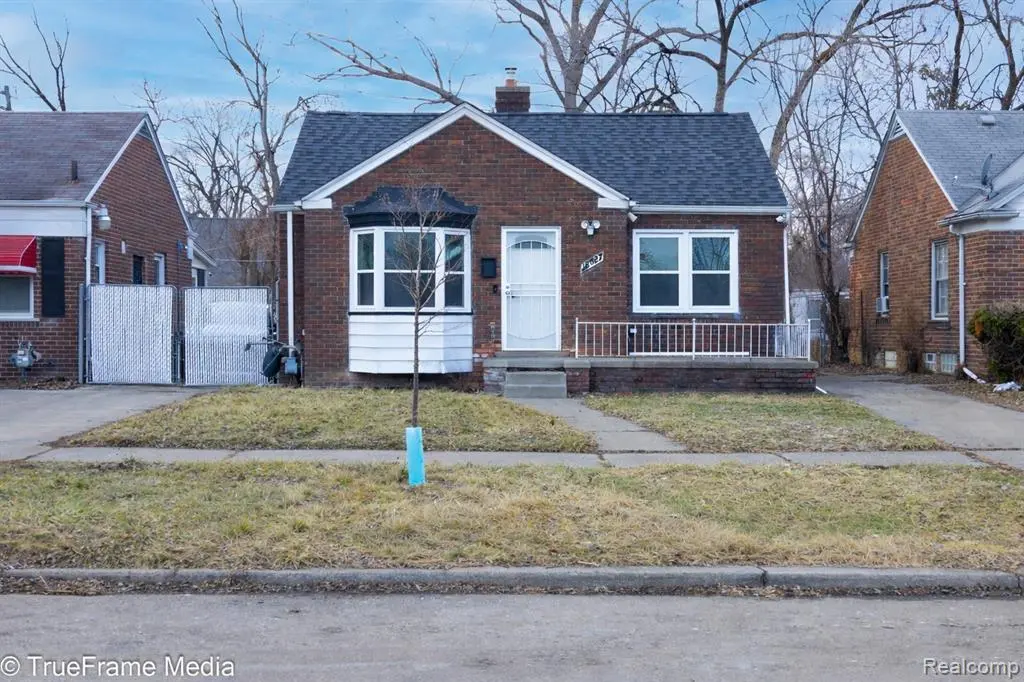
18627 Asbury Park · Detroit, MI
Flood risk 1/10 · Minimal
- FEMA flood zone
- X (unshaded)
- Chance of flooding over 30 yrs
- 0.0%
- Est. flood insurance / yr
- $473 – $860
Fire risk 1/10 · Minimal
- Est. fire insurance / yr
- $784 – $1,456
Heat risk 3/10 · Minor
- Hot days now (above 98°F)
- 7 days/yr
- Hot days in 30 yrs
- 15 days/yr
Wind risk 2/10 · Minimal
- Chance of severe wind over 30 yrs
- —
Air-quality risk 3/10 · Minor
- Unhealthy air days now
- 2 days/yr
- Unhealthy air days in 30 yrs
- 5 days/yr
Risk factors via First Street. Map © Google.
Why this score? — see what drove the D grade
The composite is a weighted blend of 9 inputs, each scored 0–100. Each bar is that input's sub-score; the figure is the points it added to the 100-point composite (weight × sub-score).
- Cash flow +21.0/30.0
- DSCR +6.7/10.0
- 1% rule +5.1/10.0
- Livability +3.7/5.0
- Rent growth +3.3/5.0
- Condition / age +2.5/5.0
- Schools +1.3/10.0
- ARV discount +0.0/15.0
- Appreciation +0.0/10.0
$112,500
🖨 Deal sheet (PDF) 📄 Offer letter ✓ Due diligence
Listing remarks MLS
Welcome to this cozy and fully updated ranch home located in Detroit's desirable College Park neighborhood - a turnkey rental investment currently generating $1,200/month with a reliable, cash-paying tenant already in place! This income-producing property features brand-new laminate flooring, fresh paint throughout, updated bathrooms and kitchen, new windows, and new appliances, requiring zero renovation and offering immediate cash flow from day one. The home offers a functional and comfortable layout with plenty of natural light, a full basement for extra storage or additional living space, and a garage for added convenience. With a 12% ROI at just 20% down, this is a rare opportunity to acquire a stabilized asset in a desirable Detroit neighborhood - don't miss out, inquire today!
Key facts
- Garage
- Full basement
- Updated bathrooms
Tags
Property features AI
Exterior
- Parking: Detached 1-car garage
- Utilities: Public water; Public sewer
- Home design: Single-family residence; One story; Ground-level entry with steps
- Construction: Brick exterior; Block foundation; Built area above grade: 723 square feet
- Exterior features: Paved road access; Breed-restricted pets allowed
Interior
- Bedrooms: 2 total rooms
- Bathrooms: 1 full bathroom
- Heating & cooling: Forced air heating (natural gas); No central cooling
- Interior features: Full, unfinished basement
Neighborhood map
What this means for you Summary
Snapshot
- This is a 2-bed/1.0-bath single-family listed at $112k.
Deal economics
- At list price, monthly cash flow is $158 ($2k/yr) — positive.
- The deal already cash-flows at list — no discount required.
- Meets the 1% rule at list price ($1k rent vs $112k).
- Recommended offer: $109k (3.0% below list) — sets the bar for market timing.
- Cap rate 8.0% vs local median 10.0% in Detroit — below-typical yield; the buyer is paying a premium for something (appreciation thesis, condition, location) that the cap rate doesn't capture.
Location & tenants
- Location reads 73/100 on livability (#218 in MI) — a middle-class / working-renter tenant base. Strengths: amenities A+, commute A+, cost of living A+; Watch: crime F, employment F.
- Detroit Public Schools Community District (urban): math 10% / reading 24% proficiency, ranked #499 of 540 in MI (top 92%) — low school quality limits family demand, transient renter base, plan for 1-2y turnover; 90% free/reduced lunch — lower-income household profile, screen leases tightly.
- Zoned schools: John R King Academic And Performing Arts Academy (math 2% / reading 8%, grade F, #1,325 of 1,397 statewide, top 99%, 814 students, 92% FRL); Henry Ford High School (math 24% / reading 24%, grade F, #481 of 713 statewide, top 81%, 712 students, 86% FRL) — zoned schools at 89% FRL track the district average.
- Market conditions: Rents rising (+3.2%/yr); 291 active listings in the ZIP; 8 comparable units currently listed for rent nearby; rentals at typical pace (median 17d on market — plan ~3-4 weeks tenant-placement turnaround); lower-income renter base — watch delinquency; 2,639 units permitted in Wayne County in 2024 (1,216 in 5+ unit buildings).
- This rent runs 35% of the median local income ($39k/yr) — at the standard rent-burdened threshold; future hikes will face affordability resistance.
Forward outlook
- Local home prices are declining (-3.0%/yr); year-one equity from $778 of loan paydown is wiped out by about $3k of value loss. Plan a longer hold.
- Wayne County population projected at -17% by 2050 — secular population decline; favor cash flow + early exit over multi-decade hold.
Negotiation context
- It's been on market 46 days — a 3% lower offer ($109k) is reasonable based on typical stale-listing flexibility.
- 6 sale attempts since 20y ago with the ask held roughly flat each time — persistent listings suggest the price (not the market) is what's stuck; bring a comps-based counter.
- Current owner paid $45k; list at $112k implies a 150% gain — meaningful room to come down on a strong offer.
Risks & watch-outs
- Watch-outs: built in 1939 — expect roof / HVAC / electrical / plumbing capex.
Questions for the listing agent
- It's been on market 46 days. Have you received any prior offers? Is the seller open to a 3% concession, seller financing, or rate buy-down credit?
- Built in 1939 — when were the roof, HVAC, electrical panel, plumbing, and water heater last replaced?
- Is there a deadline driving the sale (1031 exchange, divorce, estate, relocation)? That informs how much negotiation room exists.
- Schools are F-rated, which usually means shorter tenancies and higher turnover. Who's the typical renter profile here, and what's been the actual vacancy rate?
- Crime grade is F in this area — have there been break-ins, vandalism, or insurance claims at this property in the last 3 years? What carrier currently insures it and at what premium?
- The area grade is low — what's the realistic commute time and amenity access for the typical tenant pool here? Any planned neighborhood developments (good or bad) we should know about?
- What's the average days-on-market for RENTAL listings here right now (not sales)? A rising rental-DOM trend means longer vacancies and softer asking-rent achievability than the comps imply.
- What's the recent tenant-quality profile in this submarket — average credit score on applications, eviction rate, late-payment / NSF rate, and stable-employment percentage? A property-management company in the area should have these aggregated.
- How much new for-sale + rental construction is in the pipeline within 1–3 miles? Heavy new supply typically softens prices + rents 12–24 months out; constrained supply supports both.
Investment metrics
- 1% rule
- 1.01% ✓
- Cap rate
- 7.98%
- Cash-on-cash
- 6.04%
- DSCR
- 1.27
- GRM
- 8.3
CMA / ARV
- ARV (median comp)
- $87,672
- List price
- $112,500
- Delta
- 28.32%
- Verdict
- OVERPRICED
- Comps
- 20 within 1.0 mi
Show comp detail 12 sales within ~0.75 mi
| Address | Dist | Beds/Ba | Sqft | Sold | Price | $/sf | Match |
|---|---|---|---|---|---|---|---|
| 18950 Biltmore St | 0.17mi | 2/1.0 | 781 (+8%) | 1mo | $46,000 | $59 | 78 |
| 17227 Curtis St | 0.34mi | 3/1.0 (+1) | 717 (-1%) | 2mo | $77,000 | $107 | 76 |
| 19307 Fenmore St | 0.57mi | 2/1.0 | 725 (+0%) | 3mo | $72,500 | $100 | 71 |
| 19510 Ferguson St | 0.58mi | 2/1.0 | 717 (-1%) | 3mo | $21,000 | $29 | 69 |
| 19195 Fenmore St | 0.54mi | 2/1.0 | 720 (-0%) | 8mo | $79,500 | $110 | 68 |
| 18410 Forrer St | 0.41mi | 3/1.0 (+1) | 689 (-5%) | 2mo | $60,000 | $87 | 66 |
| 19751 Oakfield St | 0.71mi | 2/1.0 | 735 (+2%) | 1mo | $17,500 | $24 | 63 |
| 19425 Fenmore St | 0.67mi | 2/1.0 | 720 (-0%) | 8mo | $79,000 | $110 | 62 |
| 19470 Forrer St | 0.65mi | 2/1.0 | 771 (+7%) | 6mo | $27,000 | $35 | 54 |
| 19781 Oakfield St | 0.73mi | 2/1.0 | 752 (+4%) | 8mo | $65,000 | $86 | 53 |
| 19786 Oakfield St | 0.72mi | 3/1.0 (+1) | 780 (+8%) | 7mo | $80,000 | $103 | 42 |
| 18416 Curtis St | 0.74mi | 3/1.0 (+1) | 820 (+13%) | 5mo | $72,500 | $88 | 34 |
Match score weights: distance 35% · size 25% · config 20% · recency 20%. Top-matched comps best support the ARV.
Projected returns pro-forma
-3.0% appreciation · 3.25% rent growth · sell at horizon
- IRR
- -6.7%
- Equity multiple
- 0.75×
- Total profit
- $-7,858
- Equity at exit
- $16,774
- IRR
- 3.2%
- Equity multiple
- 1.23×
- Total profit
- $7,308
- Equity at exit
- $9,727
Cash invested: $31,500 (down + closing). Projections, not guarantees.
Landlord ↔ Tenant lean methodology
- Overall (STATE)
- 62 Landlord-Friendly
- State Michigan
- 62 Landlord-Friendly · EVEN
- County
- — inherits STATE
- City
- — inherits STATE
ZIP-level market 48235
- Rents YoY
- 3.2%
- Active inventory
- 291
- Price-to-rent
- 8.3×
Monthly cashflow live
- Estimated rent
- $1,136 high interval (Pro) →
- Mortgage (P&I)
- −$590
- Tax from tax record
- −$102 /mo · $1,229/yr
- Insurance
- −$47
- HOA
- −$0
- Vacancy / Maint / Mgmt
- −$239
- Net cashflow
- $158
Break-even live
Sensitivity live
| Price | -10% $222 | -5% $190 | +0% $158 | +5% $127 | +10% $95 |
|---|---|---|---|---|---|
| Rent | -10% $69 | -5% $114 | +0% $158 | +5% $203 | +10% $248 |
| Rate | -1.0pp $215 | -0.5pp $187 | base $158 | +0.5pp $129 | +1.0pp $100 |
UW: 25.0% down · 7.5% · 30yr · 1.5% tax · 5.0% vac · 8.0% maint · 8.0% mgmt
Financing live
Cash to close
- Down payment
- $28,125
- Closing costs
- $3,375
- Reserves months
- —
- Total cash needed
- —
Loan-product check · same deal, 3 products live
Conventional
25% down · 7.5% · 30yr
- Down + closing
- —
- Monthly P&I
- —
- Monthly cashflow
- —
- DSCR
- —
- Eligible?
- —
Personal DTI + credit; lowest rate.
DSCR
20% down · 8.5% · 30yr
- Down + closing
- —
- Monthly P&I
- —
- Monthly cashflow
- —
- DSCR
- —
- Eligible?
- —
No personal income docs; deal must DSCR.
Hard money
10% down · 12.0% · 12mo
- Down + closing
- —
- Monthly P&I
- —
- Monthly cashflow
- —
- DSCR
- —
- Eligible?
- —
Short-term bridge; refi at stabilization.
Rent comps 8 comps
| Address | Beds | Baths | Sqft | Rent | $/sqft | DOM | Units | Dist |
|---|---|---|---|---|---|---|---|---|
| 18276 Oakfield St Detroit, MI | 2.0 | 1.0 | 726 | $1,175 | $1.62 | 45d | 1 | 0.31mi |
| 19736 Gilchrist St Detroit, MI | 2.0 | 1.0 | 696 | $995 | $1.43 | 14d | 1 | 0.65mi |
| 20068 Faust Ave Detroit, MI | 2.0 | 1.0 | 750 | $1,100 | $1.47 | 26d | 1 | 1.16mi |
| 19372 Grandville Ave Detroit, MI | 2.0 | 1.5 | 733 | $1,025 | $1.40 | 0d | 1 | 1.20mi |
| 20555 Motor Dr Detroit, MI | 1.0–2.0 | 1.0 | 750 | $1,222 | $1.63 | 16d | 5 | 1.21mi |
| 20539 Southfield Rd Detroit, MI | 1.0 | 1.0 | 700 | $800 | $1.14 | 12d | 4 | 1.25mi |
| 18637 James Couzens Fwy Apt 103A Detroit, MI | 1.0 | 1.0 | 630 | $835 | $1.33 | 3d | 1 | 1.33mi |
| 18637 James Couzens Fwy Unit C103 Detroit, MI | 1.0 | 1.0 | 630 | $835 | $1.33 | 45d | 1 | 1.33mi |
Listing history 27 events
-
2026-06-21days on market $112,500 Active 46 DOM
-
2026-06-18days on market $112,500 Active 43 DOM
-
2026-06-17days on market $112,500 Active 42 DOM
-
2026-06-15days on market $112,500 Active 40 DOM
-
2026-06-13days on market $112,500 Active 38 DOM
-
2026-06-13days on market $112,500 Active 37 DOM
-
2026-06-09days on market $112,500 Active 34 DOM
-
2026-06-08days on market $112,500 Active 33 DOM
-
2026-06-07days on market $112,500 Active 32 DOM
-
2026-06-04days on market $112,500 Active 29 DOM
-
2026-06-03days on market $112,500 Active 28 DOM
-
2026-06-02days on market $112,500 Active 27 DOM
-
2026-06-01days on market $112,500 Active 26 DOM
-
2026-05-31days on market $112,500 Active 25 DOM
-
2026-05-06$112,500 Active 805-char remark
Show marketing remark (797 chars)
Welcome to this cozy and fully updated ranch home located in Detroit's desirable College Park neighborhood - a turnkey rental investment currently generating $1,200/month with a reliable, cash-paying tenant already in place! This income-producing property features brand-new laminate flooring, fresh paint throughout, updated bathrooms and kitchen, new windows, and new appliances, requiring zero renovation and offering immediate cash flow from day one. The home offers a functional and comfortable layout with plenty of natural light, a full basement for extra storage or additional living space, and a garage for added convenience. With a 12% ROI at just 20% down, this is a rare opportunity to acquire a stabilized asset in a desirable Detroit neighborhood - don't miss out, inquire today!
-
2026-05-06$112,500 Active 797-char remark
Show marketing remark (797 chars)
Welcome to this cozy and fully updated ranch home located in Detroit's desirable College Park neighborhood - a turnkey rental investment currently generating $1,200/month with a reliable, cash-paying tenant already in place! This income-producing property features brand-new laminate flooring, fresh paint throughout, updated bathrooms and kitchen, new windows, and new appliances, requiring zero renovation and offering immediate cash flow from day one. The home offers a functional and comfortable layout with plenty of natural light, a full basement for extra storage or additional living space, and a garage for added convenience. With a 12% ROI at just 20% down, this is a rare opportunity to acquire a stabilized asset in a desirable Detroit neighborhood - don't miss out, inquire today!
-
2026-03-12historical $1,200
-
2026-03-11price $1,200
-
2026-02-25$1,300
-
2025-09-10soldstatus $45,000
-
2009-05-08soldstatus $5,000
Show marketing remark (252 chars)
CORP OWNED. SOLD AS IS. NO SELLER'S DIS STMT. BUYER AGENT TO VEIRFY ALL INFO. INFO BELIEVED TO BE ACCURATE, BUT NOT GUARANTEED. CORP ADDEN TO BE SIGNED BY BUYER. BUYER TO SIGN ACR WITH CITY OF DET. LB TO HOLD DEP CK. COMM TO BE PAID ON NET SALES PRICE.
-
2008-12-31$5,000
Show marketing remark (252 chars)
CORP OWNED. SOLD AS IS. NO SELLER'S DIS STMT. BUYER AGENT TO VEIRFY ALL INFO. INFO BELIEVED TO BE ACCURATE, BUT NOT GUARANTEED. CORP ADDEN TO BE SIGNED BY BUYER. BUYER TO SIGN ACR WITH CITY OF DET. LB TO HOLD DEP CK. COMM TO BE PAID ON NET SALES PRICE.
-
2007-02-14soldstatus $30,000
-
2007-02-14soldstatus $30,000
-
2007-01-09historical
-
2006-11-29$32,500
-
2006-11-29$32,500
ⓘ Source: listings_history table (triggers on properties + properties_extension) + one-shot
backfill from property_details.listing_events for pre-trigger history.
Tax reassessment forecast MI · Partial reset (capped growth)
- Current annual tax
- $1,229 · $102/mo
- Projected year-2 tax
- $1,481 · $123/mo
- Expected delta
- +$252/yr (+$21/mo · 20.5%)
ⓘ Screening estimate from a state-policy table — verify with the county assessor before closing.
Climate risk First Street
- Flood 1/10 Low FEMA zone X (unshaded) · 0% chance over 30 yrs
- Wildfire 1/10 Low
- Heat 3/10 Moderate 7 d/yr ≥98°F today · 15 d/yr by 30 yrs out
- Wind 2/10 Low
- Air quality 3/10 Moderate 2 unhealthy d/yr today · 5 by 30 yrs out
Nearby sold comps map
Loading sold comps map…
Walkable amenities ~0.75 mi
Loading nearby amenities…
Taxation est. · year 1
- Rental income
- $13,636
- − Mortgage interest
- −$6,302
- − Property taxes
- −$1,229
- − Insurance
- −$562
- − Repairs & maintenance
- −$1,091
- − Management
- −$1,091
- − Depreciation
- −$3,273
- Taxable income
- $88
- Est. tax owed @ 24.0%
- −$21
- After-tax cash flow
- $1,880/yr
For passive investors: Depreciation is non-cash, so a rental often shows a tax loss while cash-flowing — sheltering income. Rental losses are passive: they offset passive income freely, and up to $25,000/yr can offset ordinary (W-2) income if you actively participate and your MAGI is under $100k (phasing out to $0 by $150k); unused losses carry forward. On sale, claimed depreciation is recaptured at up to 25%, and gains may owe capital-gains tax (a 1031 exchange can defer both). Figures are a year-1 estimate at your 24.0% rate — not tax advice; consult a CPA.
Schools (NCES district)
- District
- Detroit Public Schools Community District
- NCES district ID
- 2601103
- Math proficiency
- 10% ▼ -2.00%
- Reading proficiency
- 24% ▲ 6.00%
- Median HH income
- $25,815
- Composite
- 13.06/100
- National rank
- #9564
- State rank
- #499 of 540 in MI
Livability — Detroit
- Score
- 73/100
- State rank
- #218
- US rank
- #5427
Category grades
Schools grade is shown separately in the Schools card above.
Census & demographics
- Census place
- Detroit, MI
- County
- Wayne County · 1,562,939 people
- City population
- 572,865
- Metro
- Detroit-Warren-Dearborn, MI
- Population (ZIP)
- 45,600
- Household income
- $39,265
- Rent vs Own
- Severe rent burden
- 3064.0
Population outlook (Wayne County) Hauer SSP2
- Today (2025)
- 1,675,273 people
- By 2030
- 1,620,300 · -3.3%
- By 2040
- 1,502,341 · -10.3%
- By 2050
- 1,384,039 · -17.4%
- By 2075
- 1,124,592 · -32.9%
- By 2100
- 881,193 · -47.4%
Race, ethnicity, and origin ACS 2023
- Neighborhood character
- Predominantly Black (94%)
- Race & ethnicity
- Black 94% White 3% Two or more races 2% Hispanic / Latino 1%
- Foreign-born
- 1% · Canada
- Languages at home
- 98% English-only · Spanish 1%
Political lean MEDSL · Wayne
- 2024 margin
- Strong D (+29.0) · D 62.7% · R 33.7% · Other 3.6%
- 2008→2024 swing
- -20.5pp toward R · 2008: 49.5pp · 2024: 29.0pp
- All cycles
- 2024: D+29.0 2020: D+38.1 2016: D+37.3 2012: D+46.9 2008: D+49.5
Not yet ingested
- Civics
- —
Market trends
- HPI YoY
- ▼ -153.02%
- Current HPI
- 263.6326
- Rent YoY
- ▲ 3.25%
- Metro
- Detroit-Warren-Dearborn, MI
- State GDP YoY
- ▲ 1.37%
- F500 in state
- 28
Industry mix (Fortune 500 HQ in MI)
| Industry | F500 HQs | Revenue |
|---|---|---|
| Automotive Parts | 3 | $48B |
|
||
| Automotive | 2 | $372B |
|
||
| Chemicals | 1 | $45B |
|
||
| Automotive Retail | 1 | $29B |
|
||
| Healthcare / Medical Devices | 1 | $23B |
|
||
| Automotive Technology | 1 | $20B |
|
||
Price history
+246.2% since first listed13 events — show timeline
- 2026-05-06 Listed $112,500 REALCOMP
- 2026-05-06 Listed $112,500 MiRealSource-MiMLS
- 2026-03-12 Rental Removed $1,200 REALSOURCE
- 2026-03-11 Price Changed $1,200 REALSOURCE
- 2026-02-25 Listed for Rent $1,300 REALSOURCE
- 2025-09-10 Sold (Public Records) $45,000 Public Records
- 2009-05-08 Sold (MLS) $5,000 REALCOMP
- 2008-12-31 Listed $5,000 REALCOMP
- 2007-02-14 Sold (MLS) $30,000 MiRealSource-MiMLS
- 2007-02-14 Sold (MLS) $30,000 REALCOMP
- 2007-01-09 Listing Removed — MiRealSource-MiMLS
- 2006-11-29 Listed $32,500 MiRealSource-MiMLS
- 2006-11-29 Listed $32,500 REALCOMP
Property tax history
-1.5%/yrLatest (2025): $1,229 · -49.4% YoY. Source: county tax records.
Cash-flow waterfall
monthlySold comps — $/sqft
last 12 mo · ≤1 miLoading sold comps…