 🏗️ New Construction
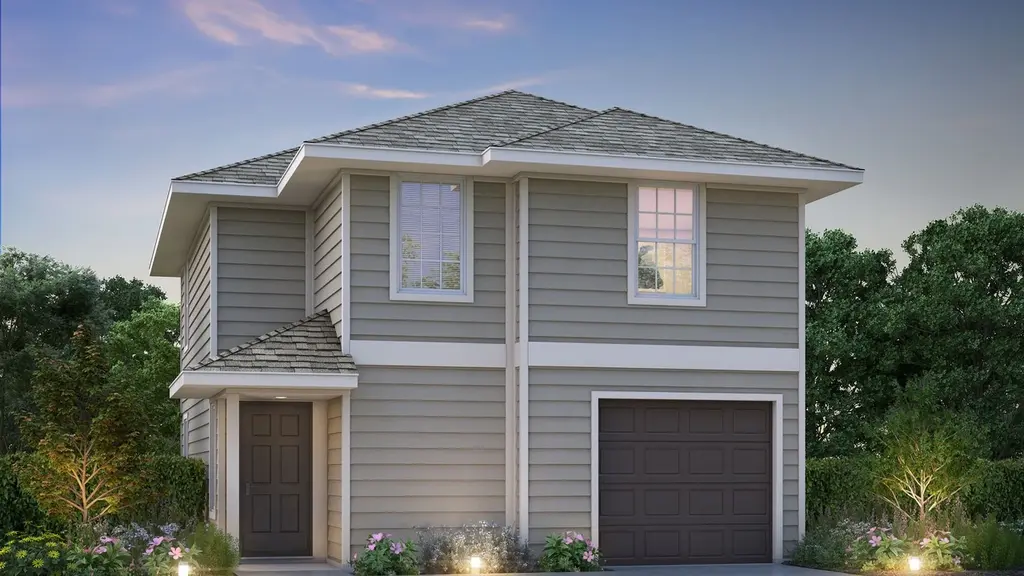
The Nantucket Plan · Splendora, TX
Flood risk No data
- FEMA flood zone
- —
- Chance of flooding over 30 yrs
- —
- Est. flood insurance / yr
- —
Fire risk No data
- Est. fire insurance / yr
- —
Heat risk No data
- Hot days now (above threshold)
- —
- Hot days in 30 yrs
- —
Wind risk No data
- Chance of severe wind over 30 yrs
- —
Air-quality risk No data
- Unhealthy air days now
- —
- Unhealthy air days in 30 yrs
- —
Risk factors via First Street. Map © Google.
Why this score? — see what drove the D- grade
The composite is a weighted blend of 9 inputs, each scored 0–100. Each bar is that input's sub-score; the figure is the points it added to the 100-point composite (weight × sub-score).
- Cash flow +11.0/30.0
- ARV discount +7.5/15.0
- Condition / age +4.0/5.0
- 1% rule +3.2/10.0
- DSCR +3.2/10.0
- Livability +3.1/5.0
- Rent growth +2.5/5.0
- Schools +2.5/10.0
- Appreciation +1.8/10.0
$191,990
🖨 Deal sheet 📄 Offer letter ✓ Due diligence
Listing remarks MLS
The Nantucket is a 2-story home from the Cottage Series Line. It offers 3 bedrooms - all upstairs - with sizeable walk-in closets in the primary suite and one of the spare bedrooms as well as 2.5 bathrooms. Downstairs, homebuyers love the open-concept family room, kitchen, and dining room combination ideal for welcoming guests and relaxing at home.
Key facts
- Garage
- Listed 62 days
Tags
Neighborhood map
What this means for you Summary
Snapshot
- This is a 3-bed/2.5-bath single-family listed at $192k. Condition is rated good.
Deal economics
- At list price, monthly cash flow is $-94 ($-1k/yr) — negative.
- The deal already cash-flows at list — no discount required.
- To meet the 1% rule (rent ≥ 1% of price), the offer needs to be $184k (4.3% below list).
- Recommended offer: $180k (6.0% below list) — sets the bar for market timing.
Location & tenants
- Location reads 62/100 on livability (#911 in TX) — a middle-class / working-renter tenant base. Strengths: cost of living A+, housing A+; Watch: schools F, amenities F, commute F.
- Splendora ISD (rural): math 25% / reading 31% proficiency, ranked #648 of 826 in TX (top 78%) — low school quality limits family demand, transient renter base, plan for 1-2y turnover.
- Market conditions: 542 active listings in the ZIP; solid renter incomes; 13,259 units permitted in Montgomery County in 2024 (1,402 in 5+ unit buildings).
Forward outlook
- Local home prices are declining (-3.0%/yr); year-one equity from $2k of loan paydown is wiped out by about $7k of value loss. Plan a longer hold.
- Montgomery County population projected at +65% by 2050 — long-run rental-demand tailwind backs the buy-and-hold thesis.
Negotiation context
- It's been on market 62 days — a 6% lower offer ($180k) is reasonable based on typical stale-listing flexibility.
Questions for the listing agent
- What do current leases actually rent for vs. the listed asking? Can we see a recent rent roll and the last 12 months of T-12 income?
- It's been on market 62 days. Have you received any prior offers? Is the seller open to a 6% concession, seller financing, or rate buy-down credit?
- Why hasn't it sold? Are there any deal-killer items the seller is aware of (foundation, flood, title, zoning, code violations)?
- Is there a deadline driving the sale (1031 exchange, divorce, estate, relocation)? That informs how much negotiation room exists.
- Schools are F-rated, which usually means shorter tenancies and higher turnover. Who's the typical renter profile here, and what's been the actual vacancy rate?
- The area grade is low — what's the realistic commute time and amenity access for the typical tenant pool here? Any planned neighborhood developments (good or bad) we should know about?
- What's the average days-on-market for RENTAL listings here right now (not sales)? A rising rental-DOM trend means longer vacancies and softer asking-rent achievability than the comps imply.
- What's the recent tenant-quality profile in this submarket — average credit score on applications, eviction rate, late-payment / NSF rate, and stable-employment percentage? A property-management company in the area should have these aggregated.
- How much new for-sale + rental construction is in the pipeline within 1–3 miles? Heavy new supply typically softens prices + rents 12–24 months out; constrained supply supports both.
Investment metrics
- 1% rule
- 0.82% ✗
- Cap rate
- 5.79%
- Cash-on-cash
- -1.81%
- DSCR
- 0.92
- GRM
- 10.1
CMA / ARV
- ARV (median comp)
- $223,599
- List price
- $191,990
- Delta
- -14.14%
- Verdict
- UNDERPRICED
- Comps
- 20 within 1.0 mi
Show comp detail 12 sales within ~0.75 mi
| Address | Dist | Beds/Ba | Sqft | Sold | Price | $/sf | Match |
|---|---|---|---|---|---|---|---|
| 22565 Cormorant Ct | 0.04mi | 3/2.0 | 1,361 (+0%) | 1mo | $205,000 | $151 | 96 |
| 22740 American Kestrel Ct | 0.22mi | 3/2.5 | 1,360 (0%) | 1mo | $190,990 | $140 | 89 |
| 22736 American Kestrel Ct | 0.21mi | 3/2.5 | 1,360 (0%) | 3mo | $194,990 | $143 | 88 |
| 22820 American Kestrel Ct | 0.34mi | 3/2.5 | 1,360 (0%) | 1mo | $193,990 | $143 | 83 |
| 22824 American Kestrel Ct | 0.35mi | 3/2.5 | 1,360 (0%) | 1mo | $194,990 | $143 | 83 |
| 22816 American Kestrel Ct | 0.34mi | 3/2.5 | 1,360 (0%) | 2mo | $194,990 | $143 | 83 |
| 13674 Kit Run | 0.43mi | 3/2.0 | 1,331 (-2%) | 2mo | $204,990 | $154 | 73 |
| 13678 Kit Run | 0.43mi | 3/2.0 | 1,412 (+4%) | 3mo | $219,990 | $156 | 69 |
| 13991 Manatee St | 0.61mi | 3/2.0 | 1,266 (-7%) | 3mo | $189,900 | $150 | 56 |
| 13667 Kit Run | 0.44mi | 3/2.0 | 1,556 (+14%) | 2mo | $234,990 | $151 | 52 |
| 23165 Teakwood Hills Dr | 0.68mi | 3/2.0 | 1,489 (+10%) | 3mo | $229,990 | $154 | 48 |
| 23157 Teakwood Hills Dr | 0.66mi | 3/2.0 | 1,539 (+13%) | 1mo | $234,990 | $153 | 44 |
Match score weights: distance 35% · size 25% · config 20% · recency 20%. Top-matched comps best support the ARV.
Projected returns pro-forma
-3.0% appreciation · 3.0% rent growth · sell at horizon
- IRR
- -19.3%
- Equity multiple
- 0.33×
- Total profit
- $-42,213
- Equity at exit
- $33,339
- IRR
- -11.9%
- Equity multiple
- 0.29×
- Total profit
- $-44,383
- Equity at exit
- $19,333
Cash invested: $62,608 (down + closing). Projections, not guarantees.
Landlord ↔ Tenant lean methodology
- Overall (STATE)
- 87 Strongly Landlord-Friendly
- State Texas
- 87 Strongly Landlord-Friendly · R+5
- County
- — inherits STATE
- City
- — inherits STATE
ZIP-level market 77372
- Home prices YoY
- -2.1%
- Active inventory
- 542
- Price-to-rent
- 8.7×
Monthly cashflow live
- Estimated rent
- $1,837 medium interval (Pro) →
- Mortgage (P&I)
- −$1,173
- Tax est. 1.5%
- −$279 /mo · $3,354/yr
- Insurance
- −$93
- HOA
- −$0
- Vacancy / Maint / Mgmt
- −$386
- Net cashflow
- $-94
Break-even live
UW: 25.0% down · 7.5% · 30yr · 1.5% tax · 5.0% vac · 8.0% maint · 8.0% mgmt
Financing live
Cash to close
- Down payment
- $55,900
- Closing costs
- $6,708
- Reserves months
- —
- Total cash needed
- —
Loan-product check · same deal, 3 products live
Conventional
25% down · 7.5% · 30yr
- Down + closing
- —
- Monthly P&I
- —
- Monthly cashflow
- —
- DSCR
- —
- Eligible?
- —
Personal DTI + credit; lowest rate.
DSCR
20% down · 8.5% · 30yr
- Down + closing
- —
- Monthly P&I
- —
- Monthly cashflow
- —
- DSCR
- —
- Eligible?
- —
No personal income docs; deal must DSCR.
Hard money
10% down · 12.0% · 12mo
- Down + closing
- —
- Monthly P&I
- —
- Monthly cashflow
- —
- DSCR
- —
- Eligible?
- —
Short-term bridge; refi at stabilization.
Listing history 15 events
-
2026-06-18days on market $191,990 Active 62 DOM
-
2026-06-17days on market $191,990 Active 61 DOM
-
2026-06-16days on market $191,990 Active 60 DOM
-
2026-06-15days on market $191,990 Active 59 DOM
-
2026-06-13days on market $191,990 Active 57 DOM
-
2026-06-13days on market $191,990 Active 56 DOM
-
2026-06-09days on market $191,990 Active 53 DOM
-
2026-06-08days on market $191,990 Active 52 DOM
-
2026-06-07days on market $191,990 Active 51 DOM
-
2026-06-04days on market $191,990 Active 48 DOM
-
2026-06-03days on market $191,990 Active 47 DOM
-
2026-06-02days on market $191,990 Active 46 DOM
-
2026-06-01days on market $191,990 Active 45 DOM
-
2026-05-31days on market $191,990 Active 44 DOM
-
2026-04-17$191,990 Active 350-char remark
Show marketing remark (350 chars)
The Nantucket is a 2-story home from the Cottage Series Line. It offers 3 bedrooms - all upstairs - with sizeable walk-in closets in the primary suite and one of the spare bedrooms as well as 2.5 bathrooms. Downstairs, homebuyers love the open-concept family room, kitchen, and dining room combination ideal for welcoming guests and relaxing at home.
ⓘ Source: listings_history table (triggers on properties + properties_extension) + one-shot
backfill from property_details.listing_events for pre-trigger history.
Nearby sold comps map
Loading sold comps map…
Walkable amenities ~0.75 mi
Loading nearby amenities…
Taxation est. · year 1
- Rental income
- $22,039
- − Mortgage interest
- −$12,525
- − Property taxes
- −$3,354
- − Insurance
- −$1,118
- − Repairs & maintenance
- −$1,763
- − Management
- −$1,763
- − Depreciation
- −$6,505
- Taxable loss
- −$4,989
- Est. tax savings @ 24.0%
- +$1,197
- After-tax cash flow
- $65/yr
For passive investors: Depreciation is non-cash, so a rental often shows a tax loss while cash-flowing — sheltering income. Rental losses are passive: they offset passive income freely, and up to $25,000/yr can offset ordinary (W-2) income if you actively participate and your MAGI is under $100k (phasing out to $0 by $150k); unused losses carry forward. On sale, claimed depreciation is recaptured at up to 25%, and gains may owe capital-gains tax (a 1031 exchange can defer both). Figures are a year-1 estimate at your 24.0% rate — not tax advice; consult a CPA.
Condition & rehab AI · 1 photo
The Nantucket Plan is a well-maintained, 2-story home with good curb appeal and interior condition. It offers a good starting point for cosmetic updates to enhance its resale and rental value.
Value-add opportunities
- Both Painting the exterior and interior walls — Fresh paint can enhance the curb appeal and interior aesthetics, making the home more attractive to potential buyers and renters.
- Both Landscaping improvements — Enhancing the landscaping can improve the home's curb appeal and add value to the property.
- Both Interior updates (e.g., new flooring, paint, and fixtures) — Updating the interior can make the home more appealing and functional, increasing its value for both resale and rental purposes.
Renovation cost estimate screening
Value-add ROI direction
- Both Painting the exterior and interior walls — Fresh paint can enhance the curb appeal and interior aesthetics, making the home more attractive to potential buyers and renters. ↑
- Both Landscaping improvements — Enhancing the landscaping can improve the home's curb appeal and add value to the property. ↑
- Both Interior updates (e.g., new flooring, paint, and fixtures) — Updating the interior can make the home more appealing and functional, increasing its value for both resale and rental purposes. ↑
ⓘ Cost ranges are severity-bucket heuristics (US national rule-of-thumb). Get contractor quotes + a written scope before underwriting a rehab budget.
Schools (NCES district)
- District
- Splendora ISD
- NCES district ID
- 4841070
- Math proficiency
- 25% ▼ -8.00%
- Reading proficiency
- 31% ▼ -1.00%
- Median HH income
- $54,166
- Composite
- 24.92/100
- National rank
- #7572
- State rank
- #648 of 826 in TX
Livability — Splendora
- Score
- 62/100
- State rank
- #911
- US rank
- #16335
Category grades
Schools grade is shown separately in the Schools card above.
Census & demographics
- County
- Montgomery County · 663,713 people
- City population
- 14,367
- Metro
- Houston-The Woodlands-Sugar Land, TX
- Population (ZIP)
- 14,367
- Household income
- $79,085
- Rent vs Own
- Severe rent burden
- 135.0
Population outlook (Montgomery County) Hauer SSP2
- Today (2025)
- 713,896 people
- By 2030
- 805,263 · +12.8%
- By 2040
- 992,708 · +39.1%
- By 2050
- 1,179,590 · +65.2%
- By 2075
- 1,628,084 · +128.1%
- By 2100
- 1,937,880 · +171.5%
Race, ethnicity, and origin ACS 2023
- Neighborhood character
- Majority White (61%)
- Race & ethnicity
- White 61% Hispanic / Latino 36% Two or more races 9% Native American 1%
- Hispanic origin (detail)
- Mexican 32%
- Common ancestry
- Lithuanian 4% Italian 2% Slovak 1%
- Foreign-born
- 9% · Canada
- Languages at home
- 71% English-only · Spanish 28%
Political lean MEDSL · Montgomery
- 2024 margin
- Solid R (+45.5) · D 26.8% · R 72.3%
- 2008→2024 swing
- +7.2pp toward D · 2008: -52.7pp · 2024: -45.5pp
- All cycles
- 2024: R+45.5 2020: R+43.8 2016: R+51.4 2012: R+60.7 2008: R+52.7
Not yet ingested
- Civics
- —
Market trends
- HPI YoY
- ▼ -6.47%
- Current HPI
- 306.9962
- Rent YoY
- —
- Metro
- Houston-The Woodlands-Sugar Land, TX
- State GDP YoY
- ▲ 3.95%
- F500 in state
- 110
Industry mix (Fortune 500 HQ in TX)
| Industry | F500 HQs | Revenue |
|---|---|---|
| Energy | 16 | $1,198B |
|
||
| Technology | 5 | $198B |
|
||
| Engineering / Construction | 4 | $72B |
|
||
| Energy Services | 3 | $60B |
|
||
| Utilities | 3 | $41B |
|
||
| Healthcare | 2 | $330B |
|
||
Price history
1 event — show timeline
- 2026-04-17 Listed $191,990 Zillow
Cash-flow waterfall
monthlySold comps — $/sqft
last 12 mo · ≤1 miLoading sold comps…