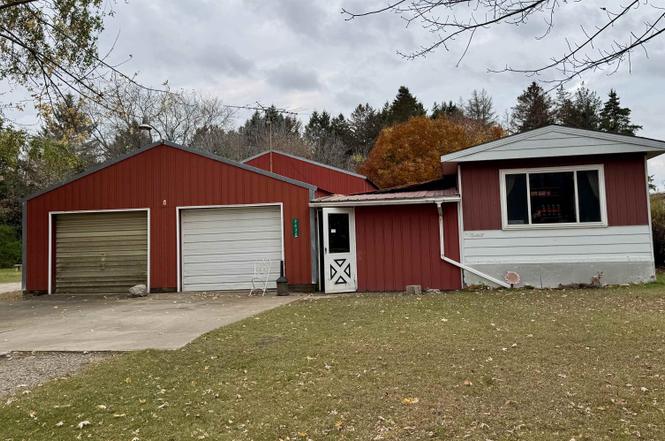
2430 Ruby St · Mount Pleasant, MI
Flood risk 4/10 · Minor
- FEMA flood zone
- X (unshaded)
- Chance of flooding over 30 yrs
- 0.22%
- Est. flood insurance / yr
- $473 – $860
Fire risk 1/10 · Minimal
- Est. fire insurance / yr
- $784 – $1,456
Heat risk 2/10 · Minimal
- Hot days now (above 97°F)
- 7 days/yr
- Hot days in 30 yrs
- 13 days/yr
Wind risk 1/10 · Minimal
- Chance of severe wind over 30 yrs
- —
Air-quality risk 2/10 · Minimal
- Unhealthy air days now
- 1 days/yr
- Unhealthy air days in 30 yrs
- 1 days/yr
Risk factors via First Street. Map © Google.
Why this score? — see what drove the B+ grade
The composite is a weighted blend of 9 inputs, each scored 0–100. Each bar is that input's sub-score; the figure is the points it added to the 100-point composite (weight × sub-score).
- Cash flow +28.8/30.0
- ARV discount +15.0/15.0
- DSCR +10.0/10.0
- 1% rule +7.7/10.0
- Rent growth +5.0/5.0
- Livability +4.1/5.0
- Schools +3.3/10.0
- Condition / age +2.5/5.0
- Appreciation +0.0/10.0
$80,000
🖨 Deal sheet (PDF) 📄 Offer letter ✓ Due diligence
Listing remarks MLS
Just outside the city limits, this single-wide home offers country-style living with city convenience! Long-term tenants have taken great care of the property, featuring a spacious yard, perfect for outdoor enjoyment. Located in a quiet, friendly neighborhood near schools, parks, and shopping. This property also includes a large pole barn connected to a two-car garage, ideal for storage, hobbies or if you wanted to make some extra income, it is currently being rented. This whole package is a great investment or an affordable place to call home! 24 hour notice for all showings.
Key facts
- Spacious yard
- Large pole barn
- Quiet neighborhood
Tags
Property features AI
Exterior
- Parking: Attached 2-car garage
- Utilities: Public water; Shared septic
- Home design: Single-family residence; Residential property
- Construction: Aluminum siding; Pillar/post/pier foundation; 938 above-grade finished square feet
- Exterior features: Porch; Barn(s)
Interior
- Kitchen: Microwave; Oven; Refrigerator; Range
- Bathrooms: One full bathroom
- Heating & cooling: Forced air heating (natural gas); No central cooling
- Interior features: Microwave; Oven; Refrigerator; Range; Four total rooms
Neighborhood map
What this means for you Summary
Snapshot
- This is a 2-bed/1.0-bath single-family listed at $80k.
Deal economics
- At list price, monthly cash flow is $269 ($3k/yr) — positive.
- The deal already cash-flows at list — no discount required.
- Meets the 1% rule at list price ($1k rent vs $80k).
- Recommended offer: $70k (12.0% below list) — sets the bar for market timing.
- Cap rate 10.3% vs local median 3.4% in Mount Pleasant — top-decile yield for the area; either an underpriced asset or a hidden risk that comps aren't pricing in. Stress-test before assuming the spread holds.
Location & tenants
- Location reads 82/100 on livability (#55 in MI, #1,063 nationally) — a professional / high-income tenant draw. Strengths: amenities A+, cost of living A+, health & safety A+; Watch: crime C-, employment F.
- Mt. Pleasant City School District (town): math 33% / reading 48% proficiency, ranked #229 of 540 in MI (top 42%) — families likely to look elsewhere, expect single-tenant / working-renter base with shorter leases.
- Market conditions: Rents rising fast (+16.9%/yr); 249 active listings in the ZIP; 72 units permitted in Isabella County in 2024 (0 in 5+ unit buildings).
Forward outlook
- Local home prices are declining (-3.0%/yr); year-one equity from $553 of loan paydown is wiped out by about $2k of value loss. Plan a longer hold.
- Isabella County population projected at +9% by 2050 — modest demand growth; plan on rents tracking national, not racing it.
- At projected returns (-3.0% appreciation + 8.0% rent growth), your $22k cash investment doubles in ~7 years — after that, you're playing with house money.
Negotiation context
- It's been on market 224 days — a 12% lower offer ($70k) is reasonable based on typical stale-listing flexibility.
- 2 sale attempts; this cycle's ask has dropped $5k (6%) from the opening price — seller is motivated, your offer sets the floor, not the list.
Questions for the listing agent
- It's been on market 224 days. Have you received any prior offers? Is the seller open to a 12% concession, seller financing, or rate buy-down credit?
- Built in 1978 — when were the roof, HVAC, electrical panel, plumbing, and water heater last replaced?
- Why hasn't it sold? Are there any deal-killer items the seller is aware of (foundation, flood, title, zoning, code violations)?
- Is there a deadline driving the sale (1031 exchange, divorce, estate, relocation)? That informs how much negotiation room exists.
- Schools are B-rated — typically a magnet for longer-tenancy family renters. What's the average tenant stay here, and is there a school-zone premium baked into asking?
- What's the average days-on-market for RENTAL listings here right now (not sales)? A rising rental-DOM trend means longer vacancies and softer asking-rent achievability than the comps imply.
- What's the recent tenant-quality profile in this submarket — average credit score on applications, eviction rate, late-payment / NSF rate, and stable-employment percentage? A property-management company in the area should have these aggregated.
- How much new for-sale + rental construction is in the pipeline within 1–3 miles? Heavy new supply typically softens prices + rents 12–24 months out; constrained supply supports both.
Investment metrics
- 1% rule
- 1.27% ✓
- Cap rate
- 10.32%
- Cash-on-cash
- 14.39%
- DSCR
- 1.64
- GRM
- 6.6
CMA / ARV
- ARV (on-the-fly)
- $122,878
- Comps found
- 12
Show comp detail 12 sales within ~0.75 mi
| Address | Dist | Beds/Ba | Sqft | Sold | Price | $/sf | Match |
|---|---|---|---|---|---|---|---|
| 5232 E Broadway Lot 303 Lot: 303 | 0.20mi | 2/2.0 | 980 (+4%) | 1mo | $22,000 | $22 | 78 |
| 5232 E Broadway Lot 301 Lot: 301 | 0.20mi | 2/1.5 | 980 (+4%) | 7mo | $23,000 | $23 | 76 |
| 5215 Bertshire Dr | 0.11mi | 2/1.5 | 1,066 (+14%) | 2mo | $134,000 | $126 | 69 |
| 5232 E Broadway Lot 118 Lot: 118 | 0.24mi | 3/1.0 (+1) | 980 (+4%) | 10mo | $32,000 | $33 | 68 |
| 2046 Florence St | 0.40mi | 3/1.0 (+1) | 921 (-2%) | 10mo | $99,000 | $107 | 64 |
| 2162 3rd St | 0.28mi | 3/1.0 (+1) | 826 (-12%) | 4mo | $105,000 | $127 | 59 |
| 1837 Belmont Dr | 0.75mi | 2/1.0 | 942 (+0%) | 13mo | $148,000 | $157 | 53 |
| 1758 Airway Dr | 0.67mi | 2/1.0 | 972 (+4%) | 11mo | $127,000 | $131 | 53 |
| 1877 Belmont | 0.71mi | 2/1.0 | 1,008 (+8%) | 9mo | $160,500 | $159 | 47 |
| 1435 E Broadway St | 0.69mi | 2/1.0 | 1,052 (+12%) | 2mo | $155,000 | $147 | 46 |
| 609 Garwood St | 0.73mi | 3/1.0 (+1) | 1,005 (+7%) | 12mo | $175,000 | $174 | 39 |
| 609 Garwood St Lot : 231 | 0.73mi | 3/1.0 (+1) | 1,005 (+7%) | 12mo | $175,000 | $174 | 39 |
Match score weights: distance 35% · size 25% · config 20% · recency 20%. Top-matched comps best support the ARV.
Projected returns pro-forma
-3.0% appreciation · 8.0% rent growth · sell at horizon
- IRR
- 10.2%
- Equity multiple
- 1.43×
- Total profit
- $9,526
- Equity at exit
- $11,928
- IRR
- 23.0%
- Equity multiple
- 3.45×
- Total profit
- $54,821
- Equity at exit
- $6,917
Cash invested: $22,400 (down + closing). Projections, not guarantees.
Landlord ↔ Tenant lean methodology
- Overall (STATE)
- 62 Landlord-Friendly
- State Michigan
- 62 Landlord-Friendly · EVEN
- County
- — inherits STATE
- City
- — inherits STATE
ZIP-level market 48858
- Home prices YoY
- -31.9%
- Rents YoY
- 16.9%
- Active inventory
- 249
- Price-to-rent
- 6.6×
Monthly cashflow live
- Estimated rent
- $1,018 medium interval (Pro) →
- Mortgage (P&I)
- −$420
- Tax from tax record
- −$83 /mo · $992/yr
- Insurance
- −$33
- HOA
- −$0
- Vacancy / Maint / Mgmt
- −$214
- Net cashflow
- $269
Break-even live
Sensitivity live
| Price | -10% $314 | -5% $291 | +0% $269 | +5% $246 | +10% $223 |
|---|---|---|---|---|---|
| Rent | -10% $188 | -5% $228 | +0% $269 | +5% $309 | +10% $349 |
| Rate | -1.0pp $309 | -0.5pp $289 | base $269 | +0.5pp $248 | +1.0pp $227 |
UW: 25.0% down · 7.5% · 30yr · 1.5% tax · 5.0% vac · 8.0% maint · 8.0% mgmt
Financing live
Cash to close
- Down payment
- $20,000
- Closing costs
- $2,400
- Reserves months
- —
- Total cash needed
- —
Loan-product check · same deal, 3 products live
Conventional
25% down · 7.5% · 30yr
- Down + closing
- —
- Monthly P&I
- —
- Monthly cashflow
- —
- DSCR
- —
- Eligible?
- —
Personal DTI + credit; lowest rate.
DSCR
20% down · 8.5% · 30yr
- Down + closing
- —
- Monthly P&I
- —
- Monthly cashflow
- —
- DSCR
- —
- Eligible?
- —
No personal income docs; deal must DSCR.
Hard money
10% down · 12.0% · 12mo
- Down + closing
- —
- Monthly P&I
- —
- Monthly cashflow
- —
- DSCR
- —
- Eligible?
- —
Short-term bridge; refi at stabilization.
Listing history 22 events
-
2026-06-19days on market $80,000 Active 224 DOM
-
2026-06-18days on market $80,000 Active 223 DOM
-
2026-06-17days on market $80,000 Active 222 DOM
-
2026-06-16days on market $80,000 Active 221 DOM
-
2026-06-15days on market $80,000 Active 220 DOM
-
2026-06-14days on market $80,000 Active 218 DOM
-
2026-06-12days on market $80,000 Active 217 DOM
-
2026-06-09days on market $80,000 Active 214 DOM
-
2026-06-08days on market $80,000 Active 213 DOM
-
2026-06-07days on market $80,000 Active 212 DOM
-
2026-06-05days on market $80,000 Active 209 DOM
-
2026-06-03days on market $80,000 Active 208 DOM
-
2026-06-02days on market $80,000 Active 207 DOM
-
2026-06-01days on market $80,000 Active 206 DOM
-
2026-05-31days on market $80,000 Active 205 DOM
-
2026-05-30days on market $80,000 Active 204 DOM
-
2026-02-03price $80,000 583-char remark
Show marketing remark (583 chars)
Just outside the city limits, this single-wide home offers country-style living with city convenience! Long-term tenants have taken great care of the property, featuring a spacious yard, perfect for outdoor enjoyment. Located in a quiet, friendly neighborhood near schools, parks, and shopping. This property also includes a large pole barn connected to a two-car garage, ideal for storage, hobbies or if you wanted to make some extra income, it is currently being rented. This whole package is a great investment or an affordable place to call home! 24 hour notice for all showings.
-
2026-02-02price $80,000
-
2025-11-06$85,000 Active 583-char remark
Show marketing remark (583 chars)
Just outside the city limits, this single-wide home offers country-style living with city convenience! Long-term tenants have taken great care of the property, featuring a spacious yard, perfect for outdoor enjoyment. Located in a quiet, friendly neighborhood near schools, parks, and shopping. This property also includes a large pole barn connected to a two-car garage, ideal for storage, hobbies or if you wanted to make some extra income, it is currently being rented. This whole package is a great investment or an affordable place to call home! 24 hour notice for all showings.
-
2025-11-06$85,000 Active
Show marketing remark (583 chars)
Just outside the city limits, this single-wide home offers country-style living with city convenience! Long-term tenants have taken great care of the property, featuring a spacious yard, perfect for outdoor enjoyment. Located in a quiet, friendly neighborhood near schools, parks, and shopping. This property also includes a large pole barn connected to a two-car garage, ideal for storage, hobbies or if you wanted to make some extra income, it is currently being rented. This whole package is a great investment or an affordable place to call home! 24 hour notice for all showings.
-
2015-10-28soldstatus $775,000
-
2007-10-17soldstatus $50,000
ⓘ Source: listings_history table (triggers on properties + properties_extension) + one-shot
backfill from property_details.listing_events for pre-trigger history.
Tax reassessment forecast MI · Partial reset (capped growth)
- Current annual tax
- $992 · $83/mo
- Projected year-2 tax
- $1,112 · $93/mo
- Expected delta
- +$120/yr (+$10/mo · 12.1%)
ⓘ Screening estimate from a state-policy table — verify with the county assessor before closing.
Climate risk First Street
- Flood 4/10 Moderate FEMA zone X (unshaded) · 22% chance over 30 yrs
- Wildfire 1/10 Low
- Heat 2/10 Low 7 d/yr ≥97°F today · 13 d/yr by 30 yrs out
- Wind 1/10 Low
- Air quality 2/10 Low 1 unhealthy d/yr today · 1 by 30 yrs out
Nearby sold comps map
Loading sold comps map…
Walkable amenities ~0.75 mi
Loading nearby amenities…
Taxation est. · year 1
- Rental income
- $12,214
- − Mortgage interest
- −$4,481
- − Property taxes
- −$992
- − Insurance
- −$400
- − Repairs & maintenance
- −$977
- − Management
- −$977
- − Depreciation
- −$2,327
- Taxable income
- $2,059
- Est. tax owed @ 24.0%
- −$494
- After-tax cash flow
- $2,729/yr
For passive investors: Depreciation is non-cash, so a rental often shows a tax loss while cash-flowing — sheltering income. Rental losses are passive: they offset passive income freely, and up to $25,000/yr can offset ordinary (W-2) income if you actively participate and your MAGI is under $100k (phasing out to $0 by $150k); unused losses carry forward. On sale, claimed depreciation is recaptured at up to 25%, and gains may owe capital-gains tax (a 1031 exchange can defer both). Figures are a year-1 estimate at your 24.0% rate — not tax advice; consult a CPA.
Schools (NCES district)
- District
- Mt. Pleasant City School District
- NCES district ID
- 2624750
- Math proficiency
- 33% ▼ -5.00%
- Reading proficiency
- 48% ▼ -3.00%
- Median HH income
- $32,344
- Composite
- 33.16/100
- National rank
- #5548
- State rank
- #229 of 540 in MI
Livability — Mount Pleasant
- Score
- 82/100
- State rank
- #55
- US rank
- #1063
Category grades
Schools grade is shown separately in the Schools card above.
Census & demographics
- County
- Isabella County · 42,226 people
- City population
- 42,226
- Metro
- Mount Pleasant, MI
- Population (ZIP)
- 42,226
- Household income
- $51,267
- Rent vs Own
- Severe rent burden
- 2381.0
Population outlook (Isabella County) Hauer SSP2
- Today (2025)
- 75,111 people
- By 2030
- 77,600 · +3.3%
- By 2040
- 79,890 · +6.4%
- By 2050
- 81,568 · +8.6%
- By 2075
- 86,602 · +15.3%
- By 2100
- 92,201 · +22.8%
Race, ethnicity, and origin ACS 2023
- Neighborhood character
- Predominantly White (81%)
- Race & ethnicity
- White 81% Two or more races 6% Hispanic / Latino 5% Native American 4% Black 3% Asian 2%
- Hispanic origin (detail)
- Mexican 3%
- Common ancestry
- Romanian 6% Slovak 3% Iranian 3%
- Foreign-born
- 4% · Canada
- Languages at home
- 94% English-only · Spanish 2% Other Indo-European 1% German/W. Germanic 0%
Political lean MEDSL · Isabella
- 2024 margin
- Lean R (+7.5) · D 45.5% · R 53.0% · Other 1.6%
- 2008→2024 swing
- -26.7pp toward R · 2008: 19.2pp · 2024: -7.5pp
- All cycles
- 2024: R+7.5 2020: R+2.5 2016: R+3.7 2012: D+9.3 2008: D+19.2
Not yet ingested
- Civics
- —
Market trends
- HPI YoY
- ▼ -96.75%
- Current HPI
- 206.1153
- Rent YoY
- ▲ 16.89%
- Metro
- Mount Pleasant, MI
- State GDP YoY
- ▲ 1.37%
- F500 in state
- 28
Industry mix (Fortune 500 HQ in MI)
| Industry | F500 HQs | Revenue |
|---|---|---|
| Automotive Parts | 3 | $48B |
|
||
| Automotive | 2 | $372B |
|
||
| Chemicals | 1 | $45B |
|
||
| Automotive Retail | 1 | $29B |
|
||
| Healthcare / Medical Devices | 1 | $23B |
|
||
| Automotive Technology | 1 | $20B |
|
||
Price history
+60.0% since first listed6 events — show timeline
- 2026-02-03 Price Changed $80,000 MiRealSource-MiMLS
- 2026-02-02 Price Changed $80,000 REALCOMP
- 2025-11-06 Listed $85,000 REALCOMP
- 2025-11-06 Listed $85,000 MiRealSource-MiMLS
- 2015-10-28 Sold (Public Records) $775,000 Public Records
- 2007-10-17 Sold (Public Records) $50,000 Public Records
Property tax history
-0.3%/yrLatest (2023): $992 · +41.7% YoY. Source: county tax records.
Cash-flow waterfall
monthlySold comps — $/sqft
last 12 mo · ≤1 miLoading sold comps…