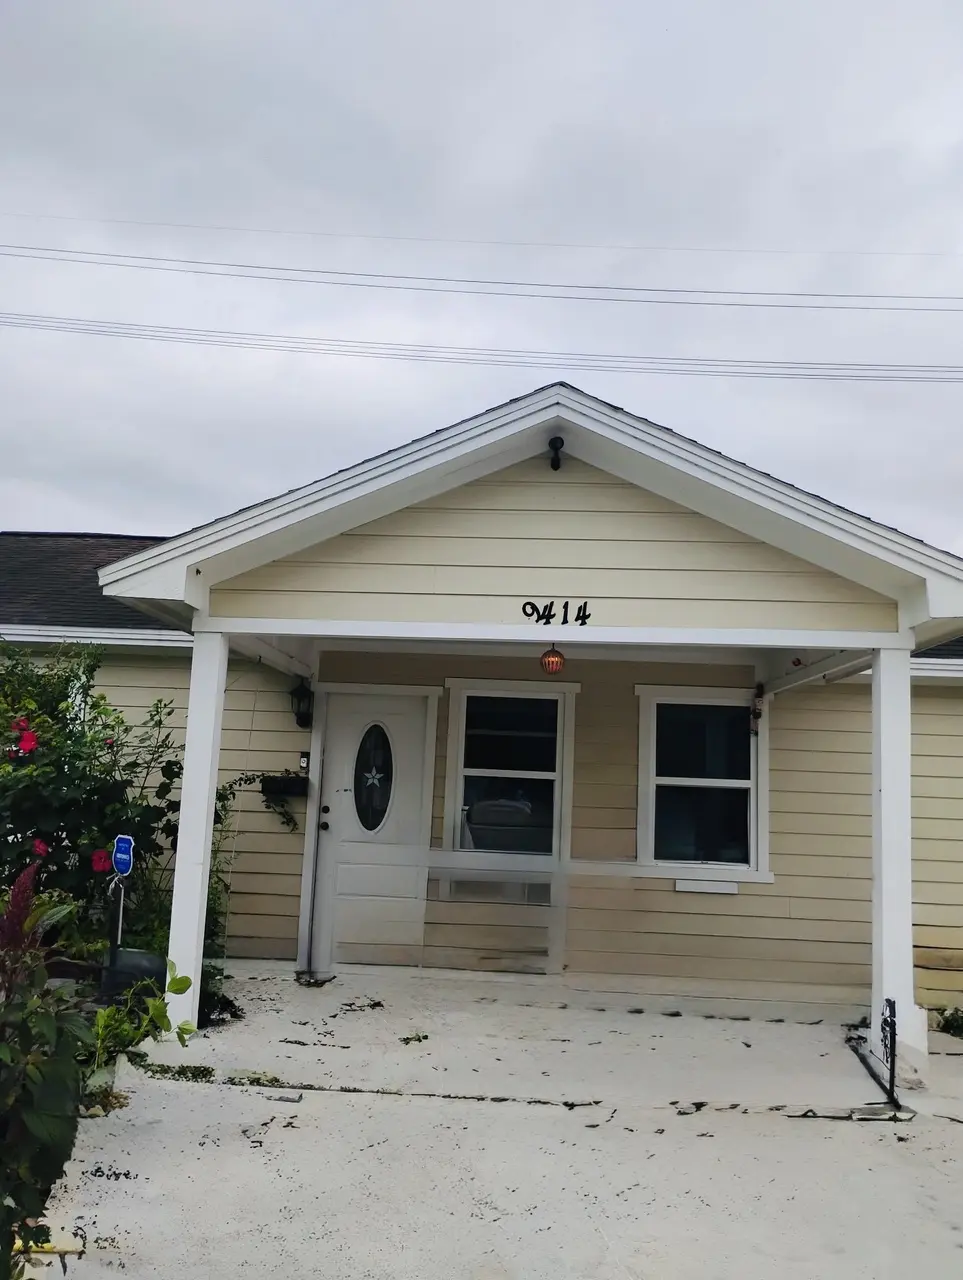
9414 Ashville Dr · Houston, TX
Flood risk 1/10 · Minimal
- FEMA flood zone
- X (unshaded)
- Chance of flooding over 30 yrs
- 0.0%
- Est. flood insurance / yr
- $507 – $1,088
Fire risk 1/10 · Minimal
- Est. fire insurance / yr
- $1,222 – $2,270
Heat risk 9/10 · Severe
- Hot days now (above 109°F)
- 7 days/yr
- Hot days in 30 yrs
- 24 days/yr
Wind risk 9/10 · Severe
- Chance of severe wind over 30 yrs
- 99.0%
Air-quality risk 2/10 · Minimal
- Unhealthy air days now
- 2 days/yr
- Unhealthy air days in 30 yrs
- 2 days/yr
Risk factors via First Street. Map © Google.
Why this score? — see what drove the C grade
The composite is a weighted blend of 9 inputs, each scored 0–100. Each bar is that input's sub-score; the figure is the points it added to the 100-point composite (weight × sub-score).
- Cash flow +17.5/30.0
- Appreciation +10.0/10.0
- 1% rule +5.6/10.0
- DSCR +5.5/10.0
- ARV discount +5.1/15.0
- Rent growth +3.7/5.0
- Livability +3.7/5.0
- Schools +2.7/10.0
- Condition / age +2.5/5.0
$185,000
🖨 Deal sheet (PDF) 📄 Offer letter ✓ Due diligence
Listing remarks MLS
Beautiful freshly renovated home, come and take a look at this charming structure, you will find all new electric wiring, new AC system and unit, new roof, new plumbing, new driveway, new back and front porch, New fence, literally everything in this property has been renovated. You are more than welcome to schedule your showing today to come see this cozy house in a calm neighborhood.
Key facts
- 8,036 sq ft lot
- Parking
- Built 1960
Property features AI
Finance
- Financial info: Lease not considered
Exterior
- Parking: Driveway
- Security: Smoke detectors
- Utilities: Public water; Public sewer
- Home design: Residential property; Faces north; Built in 1960; Single-story (entry level: first floor)
- Construction: Cement siding and wood siding; Composition roof; Slab foundation
- Exterior features: Deck; Fence (back yard); Porch; Patio; Private yard; Cleared lot; Subdivision setting; Side yard
Interior
- Kitchen: Electric cooktop; Electric oven; Microwave; Refrigerator
- Bedrooms: Primary bedroom on the first floor (approx. 10 x 23); Bedroom on the first floor (approx. 14 x 18); Bedroom on the first floor (approx. 12 x 11); Bedroom on the first floor (approx. 9 x 16)
- Flooring: Plank flooring; Tile flooring; Vinyl flooring
- Bathrooms: One full bathroom (approx. 8 x 5); One half bathroom (approx. 5 x 5)
- Heating & cooling: Has heating (window unit); Has cooling (window units)
- Interior features: Tub with shower; Vanity; Ceiling fans; Programmable thermostat; Total of 8 rooms
- Laundry & utility: Washer hookup; Electric dryer hookup
Neighborhood map
What this means for you Summary
Snapshot
- This is a 3-bed/1.0-bath single-family listed at $185k.
Deal economics
- At list price, monthly cash flow is $142 ($2k/yr) — positive.
- The deal already cash-flows at list — no discount required.
- Meets the 1% rule at list price ($2k rent vs $185k).
- Cap rate 7.2% vs local median 3.2% in Houston — top-decile yield for the area; either an underpriced asset or a hidden risk that comps aren't pricing in. Stress-test before assuming the spread holds.
Location & tenants
- Location reads 74/100 on livability (#184 in TX, #4,771 nationally) — a middle-class / working-renter tenant base. Strengths: amenities A+, cost of living A+, housing A+; Watch: crime F.
- Houston ISD (urban): math 27% / reading 35% proficiency, ranked #593 of 826 in TX (top 72%) — families likely to look elsewhere, expect single-tenant / working-renter base with shorter leases; 71% free/reduced lunch — lower-income household profile, screen leases tightly.
- Zoned schools: Reynolds El (math 8% / reading 8%, grade F, #4,301 of 4,322 statewide, top 100%, 334 students, 98% FRL); Attucks Middle (math 15% / reading 22%, grade F, #1,478 of 1,662 statewide, top 90%, 439 students, 98% FRL); Worthing H S (math 22% / reading 21%, grade F, #1,377 of 1,632 statewide, top 85%, 827 students, 96% FRL) — zoned schools average 97% FRL vs 71% district-wide (26 pts higher); higher-poverty schools than district average — tighter screening recommended.
- Zoned-school proficiency averages 16% at this address vs 31% district-wide (-15 pts) — the specific schools serving this property underperform the Houston ISD average; the district grade overstates school quality for this exact location.
- Market conditions: Rents rising fast (+4.8%/yr); 321 active listings in the ZIP; 27 comparable units currently listed for rent nearby; rentals at typical pace (median 23d on market — plan ~3-4 weeks tenant-placement turnaround); lower-income renter base — watch delinquency; 29,883 units permitted in Harris County in 2024 (8,621 in 5+ unit buildings).
- At $1,964/mo this rent would consume 63% of the median local household income ($37k/yr) (locally 1446% of renters already pay >50% of income on rent) — very limited rent-growth headroom before tenants either downsize or default.
Forward outlook
- In year one you build about $20k of equity ($1k loan paydown + $18k appreciation (10.0% local appreciation)).
- Harris County population projected at +47% by 2050 — long-run rental-demand tailwind backs the buy-and-hold thesis.
- At projected returns (10.0% appreciation + 4.8% rent growth), your $52k cash investment doubles in ~3 years — after that, you're playing with house money.
- By year 2, paydown + projected appreciation supports a ~$32k cash-out refi (75% LTV) — recoverable capital for the next deal without selling this one.
Negotiation context
- Only 11 days on market — expect competitive offers; lowballing is unlikely to land.
- 4 sale attempts since 7y ago; this cycle's ask has dropped $24k (11%) from the opening price — seller is motivated, your offer sets the floor, not the list.
Risks & watch-outs
- Climate carrying-cost: severe wind risk, 99% chance of damaging wind over 30y; extreme-heat days projected 7→24/yr by 2055 (HVAC capex compounding) — expect insurance premiums to compound above CPI over the hold.
Questions for the listing agent
- Built in 1960 — when were the roof, HVAC, electrical panel, plumbing, and water heater last replaced?
- Is there a deadline driving the sale (1031 exchange, divorce, estate, relocation)? That informs how much negotiation room exists.
- Schools are D-rated, which usually means shorter tenancies and higher turnover. Who's the typical renter profile here, and what's been the actual vacancy rate?
- Crime grade is F in this area — have there been break-ins, vandalism, or insurance claims at this property in the last 3 years? What carrier currently insures it and at what premium?
- What's the average days-on-market for RENTAL listings here right now (not sales)? A rising rental-DOM trend means longer vacancies and softer asking-rent achievability than the comps imply.
- What's the recent tenant-quality profile in this submarket — average credit score on applications, eviction rate, late-payment / NSF rate, and stable-employment percentage? A property-management company in the area should have these aggregated.
- How much new for-sale + rental construction is in the pipeline within 1–3 miles? Heavy new supply typically softens prices + rents 12–24 months out; constrained supply supports both.
Investment metrics
- 1% rule
- 1.06% ✓
- Cap rate
- 7.21%
- Cash-on-cash
- 3.28%
- DSCR
- 1.15
- GRM
- 7.8
CMA / ARV
- ARV (median comp)
- $175,623
- List price
- $185,000
- Delta
- 35.52%
- Verdict
- OVERPRICED
- Comps
- 20 within 1.0 mi
Show comp detail 12 sales within ~0.75 mi
| Address | Dist | Beds/Ba | Sqft | Sold | Price | $/sf | Match |
|---|---|---|---|---|---|---|---|
| 9506 Sierra Dr | 0.19mi | 4/2.0 (+1) | 1,316 (+2%) | 3mo | $160,000 | $122 | 77 |
| 9321 Cathedral Dr | 0.20mi | 3/1.0 | 1,204 (-7%) | 4mo | $159,000 | $132 | 76 |
| 10209 Cathedral Dr | 0.51mi | 3/1.5 | 1,244 (-4%) | 3mo | $180,000 | $145 | 65 |
| 10014 Sierra Dr | 0.41mi | 4/2.0 (+1) | 1,243 (-4%) | 2mo | $185,000 | $149 | 64 |
| 10006 Chesterfield Dr | 0.38mi | 3/1.0 | 1,170 (-10%) | 3mo | $125,000 | $107 | 64 |
| 4210 Larkspur St | 0.59mi | 3/2.0 | 1,281 (-1%) | 5mo | $199,000 | $155 | 63 |
| 3034 Corksie St | 0.60mi | 3/2.0 | 1,225 (-5%) | 0mo | $219,900 | $180 | 59 |
| 10205 Sierra Dr | 0.49mi | 3/1.0 | 1,151 (-11%) | 3mo | $120,000 | $104 | 56 |
| 2818 Milton Lodge Ln | 0.74mi | 3/2.5 | 1,384 (+7%) | 2mo | $279,990 | $202 | 46 |
| 2823 Milton Lodge Ln | 0.71mi | 3/2.5 | 1,384 (+7%) | 4mo | $279,990 | $202 | 46 |
| 3334 Dulcrest St | 0.74mi | 3/1.0 | 1,122 (-13%) | 3mo | $90,000 | $80 | 41 |
| 10102 Penryn Forest Trl | 0.75mi | 3/2.5 | 1,486 (+15%) | 5mo | $286,090 | $193 | 30 |
Match score weights: distance 35% · size 25% · config 20% · recency 20%. Top-matched comps best support the ARV.
Projected returns pro-forma
10.0% appreciation · 4.77% rent growth · sell at horizon
- IRR
- 27.4%
- Equity multiple
- 3.19×
- Total profit
- $113,442
- Equity at exit
- $166,663
- IRR
- 24.5%
- Equity multiple
- 7.47×
- Total profit
- $334,960
- Equity at exit
- $359,414
Cash invested: $51,800 (down + closing). Projections, not guarantees.
Landlord ↔ Tenant lean methodology
- Overall (STATE)
- 87 Strongly Landlord-Friendly
- State Texas
- 87 Strongly Landlord-Friendly · R+5
- County
- — inherits STATE
- City
- — inherits STATE
ZIP-level market 77051
- Home prices YoY
- 9.7%
- Rents YoY
- 4.8%
- Active inventory
- 321
- Price-to-rent
- 7.8×
Monthly cashflow live
- Estimated rent
- $1,964 high interval (Pro) →
- Mortgage (P&I)
- −$970
- Tax from tax record
- −$363 /mo · $4,354/yr
- Insurance
- −$77
- HOA
- −$0
- Vacancy / Maint / Mgmt
- −$412
- Net cashflow
- $142
Break-even live
Sensitivity live
| Price | -10% $246 | -5% $194 | +0% $142 | +5% $89 | +10% $37 |
|---|---|---|---|---|---|
| Rent | -10% $-14 | -5% $64 | +0% $142 | +5% $219 | +10% $297 |
| Rate | -1.0pp $235 | -0.5pp $189 | base $142 | +0.5pp $94 | +1.0pp $45 |
UW: 25.0% down · 7.5% · 30yr · 1.5% tax · 5.0% vac · 8.0% maint · 8.0% mgmt
Financing live
Cash to close
- Down payment
- $46,250
- Closing costs
- $5,550
- Reserves months
- —
- Total cash needed
- —
Loan-product check · same deal, 3 products live
Conventional
25% down · 7.5% · 30yr
- Down + closing
- —
- Monthly P&I
- —
- Monthly cashflow
- —
- DSCR
- —
- Eligible?
- —
Personal DTI + credit; lowest rate.
DSCR
20% down · 8.5% · 30yr
- Down + closing
- —
- Monthly P&I
- —
- Monthly cashflow
- —
- DSCR
- —
- Eligible?
- —
No personal income docs; deal must DSCR.
Hard money
10% down · 12.0% · 12mo
- Down + closing
- —
- Monthly P&I
- —
- Monthly cashflow
- —
- DSCR
- —
- Eligible?
- —
Short-term bridge; refi at stabilization.
Rent comps 27 comps
| Address | Beds | Baths | Sqft | Rent | $/sqft | DOM | Units | Dist |
|---|---|---|---|---|---|---|---|---|
| 9606 Ashville Dr Unit B Houston, TX | 3.0 | 2.0 | 1610 | $1,570 | $0.98 | 45d | 1 | 0.21mi |
| 9610 Buffum St Houston, TX | 3.0 | 3.0 | 1605 | $1,799 | $1.12 | 45d | 1 | 0.52mi |
| 2910 Reed Rd Houston, TX | 3.0 | 2.0 | 1221 | $1,228 | $1.01 | 1d | 3 | 0.63mi |
| 10510 Cathedral Dr Houston, TX | 3.0 | 1.0 | 887 | $1,300 | $1.47 | 45d | 1 | 0.68mi |
| 2889 Reed Rd Houston, TX | 1.0–2.0 | 1.0–2.0 | 997 | $1,648 | $1.65 | 4d | 2 | 0.71mi |
| 2725 Reed Rd Houston, TX | 1.0–3.0 | 1.0–2.5 | 911 | $975 | $1.07 | 45d | 1 | 0.85mi |
| 4538 Clover St Houston, TX | 4.0 | 2.0 | 1768 | $1,595 | $0.90 | 45d | 1 | 0.87mi |
| 2937 Amherst Meadow Ln Unit NA Houston, TX | 3.0 | 2.5 | 1820 | $2,400 | $1.32 | 6d | 1 | 0.93mi |
| 2937 Amherst Meadow Ln Houston, TX | 3.0 | 2.5 | 1820 | $2,450 | $1.35 | 24d | 1 | 0.93mi |
| 10514 Wellesley Terrace Trl Houston, TX | 3.0 | 3.0 | 1843 | $2,300 | $1.25 | 20d | 1 | 0.95mi |
| 10415 Lancaster Ln Houston, TX | 3.0–4.0 | 2.5 | 1937 | $2,525 | $1.30 | 22d | 1 | 1.04mi |
| 4526 Knoxville St Unit A Houston, TX | 3.0 | 2.5 | 1474 | $1,775 | $1.20 | 16d | 1 | 1.05mi |
| 4514 Galesburg St Unit B Houston, TX | 3.0 | 2.5 | 1680 | $3,500 | $2.08 | 26d | 1 | 1.05mi |
| 3137 W Bellfort Ave Houston, TX | 2.0 | 2.0 | 1164 | $1,802 | $1.55 | 45d | 1 | 1.05mi |
| 8328 Corinth St Unit B Houston, TX | 3.0 | 2.5 | 1500 | $2,800 | $1.87 | 22d | 1 | 1.10mi |
| 4117 Shelby Cir Unit 1230900P Houston, TX | 4.0 | 2.0 | 1367 | $5,253 | $3.84 | 1d | 1 | 1.12mi |
| 4406 Sterling St Houston, TX | 3.0 | 2.5 | 1840 | $1,999 | $1.09 | 18d | 1 | 1.12mi |
| 4723 Mallow St Houston, TX | 3.0 | 2.5 | 1472 | $1,850 | $1.26 | 7d | 1 | 1.14mi |
| 3620 Du Bois St Unit 1302349P Houston, TX | 3.0 | 2.5 | 1797 | $2,945 | $1.64 | 5d | 1 | 1.20mi |
| 4810 Wilmington St Unit A Houston, TX | 3.0 | 2.0 | 1165 | $1,650 | $1.42 | 45d | 1 | 1.20mi |
| 8606 Lee Otis St Houston, TX | 4.0 | 2.5 | 1869 | $1,975 | $1.06 | 0d | 1 | 1.23mi |
| 8521 Dosia St Houston, TX | 3.0 | 2.0 | 1028 | $1,665 | $1.62 | 14d | 1 | 1.26mi |
| 4918 Wilmington St Unit A Houston, TX | 3.0 | 3.0 | 1300 | $2,100 | $1.62 | 45d | 1 | 1.33mi |
| 4921a Pederson St Unit A Houston, TX | 3.0 | 2.0 | 1765 | $2,150 | $1.22 | 14d | 1 | 1.35mi |
| 8010 Livingston St Houston, TX | 3.0 | 2.0 | 1400 | $1,800 | $1.29 | 45d | 1 | 1.39mi |
| 4601 White Rock St Unit A Houston, TX | 3.0 | 2.5 | 1700 | $2,500 | $1.47 | 45d | 1 | 1.44mi |
| 5012 Higgins St Unit B Houston, TX | 3.0 | 2.5 | 1611 | $1,650 | $1.02 | 26d | 1 | 1.44mi |
Listing history 23 events
-
2026-06-21days on market $185,000 Active 11 DOM
-
2026-06-18days on market $185,000 Active 8 DOM
-
2026-06-17days on market $185,000 Active 7 DOM
-
2026-06-16days on market $185,000 Active 6 DOM
-
2026-06-15days on market $185,000 Active 5 DOM
-
2026-06-13pricedays on market $185,000 Active 3 DOM
-
2026-06-01days on market $238,000 Active 17 DOM
-
2026-05-31days on market $238,000 Active 16 DOM
-
2026-05-15$238,000 Active 939-char remark
-
2020-08-18soldstatus
-
2020-08-17soldstatus Sold 402-char remark
Show marketing remark (402 chars)
Beautiful freshly renovated home, come and take a look at this charming structure, you will find all new electric wiring, new AC system and unit, new roof, new plumbing, new driveway, new back and front porch, New fence, literally everything in this property has been renovated. You are more than welcome to schedule your showing today to come see this cozy house in a calm neighborhood.
-
2020-07-15status Pending 402-char remark
Show marketing remark (402 chars)
Beautiful freshly renovated home, come and take a look at this charming structure, you will find all new electric wiring, new AC system and unit, new roof, new plumbing, new driveway, new back and front porch, New fence, literally everything in this property has been renovated. You are more than welcome to schedule your showing today to come see this cozy house in a calm neighborhood.
-
2020-06-18$160,000 Active 402-char remark
Show marketing remark (402 chars)
Beautiful freshly renovated home, come and take a look at this charming structure, you will find all new electric wiring, new AC system and unit, new roof, new plumbing, new driveway, new back and front porch, New fence, literally everything in this property has been renovated. You are more than welcome to schedule your showing today to come see this cozy house in a calm neighborhood.
-
2019-12-15historical
-
2019-11-15price $145,000
-
2019-10-20price $153,000
-
2019-10-20price $152,000
-
2019-10-10$160,000 Active
-
2019-05-07soldstatus
-
2019-04-30soldstatus
-
2019-04-26soldstatus
-
2019-04-09soldstatus
-
1976-05-28soldstatus
ⓘ Source: listings_history table (triggers on properties + properties_extension) + one-shot
backfill from property_details.listing_events for pre-trigger history.
Tax reassessment forecast TX · Resets to sale price
- Current annual tax
- $4,354 · $363/mo
- Projected year-2 tax
- $4,354 · $363/mo
- Expected delta
- $0/yr ($0/mo · 0.0%)
ⓘ Screening estimate from a state-policy table — verify with the county assessor before closing.
Climate risk First Street
- Flood 1/10 Low FEMA zone X (unshaded) · 0% chance over 30 yrs
- Wildfire 1/10 Low
- Heat 9/10 Extreme 7 d/yr ≥109°F today · 24 d/yr by 30 yrs out
- Wind 9/10 Extreme 99% chance of damaging wind over 30 yrs
- Air quality 2/10 Low 2 unhealthy d/yr today · 2 by 30 yrs out
Nearby sold comps map
Loading sold comps map…
Walkable amenities ~0.75 mi
Loading nearby amenities…
Taxation est. · year 1
- Rental income
- $23,570
- − Mortgage interest
- −$10,363
- − Property taxes
- −$4,354
- − Insurance
- −$925
- − Repairs & maintenance
- −$1,886
- − Management
- −$1,886
- − Depreciation
- −$5,382
- Taxable loss
- −$1,226
- Est. tax savings @ 24.0%
- +$294
- After-tax cash flow
- $1,993/yr
For passive investors: Depreciation is non-cash, so a rental often shows a tax loss while cash-flowing — sheltering income. Rental losses are passive: they offset passive income freely, and up to $25,000/yr can offset ordinary (W-2) income if you actively participate and your MAGI is under $100k (phasing out to $0 by $150k); unused losses carry forward. On sale, claimed depreciation is recaptured at up to 25%, and gains may owe capital-gains tax (a 1031 exchange can defer both). Figures are a year-1 estimate at your 24.0% rate — not tax advice; consult a CPA.
Schools (NCES district)
- District
- Houston ISD
- NCES district ID
- 4823640
- Math proficiency
- 27% ▼ -18.00%
- Reading proficiency
- 35% ▼ -6.00%
- Median HH income
- $46,054
- Composite
- 26.63/100
- National rank
- #7173
- State rank
- #593 of 826 in TX
Livability — Houston
- Score
- 74/100
- State rank
- #184
- US rank
- #4771
Category grades
Schools grade is shown separately in the Schools card above.
Census & demographics
- Census place
- Houston, TX
- County
- Harris County · 4,702,590 people
- City population
- 3,226,434
- Metro
- Houston-The Woodlands-Sugar Land, TX
- Population (ZIP)
- 19,795
- Household income
- $37,415
- Rent vs Own
- Severe rent burden
- 1446.0
Population outlook (Harris County) Hauer SSP2
- Today (2025)
- 5,571,493 people
- By 2030
- 6,089,821 · +9.3%
- By 2040
- 7,142,806 · +28.2%
- By 2050
- 8,185,864 · +46.9%
- By 2075
- 10,574,329 · +89.8%
- By 2100
- 12,109,958 · +117.4%
Race, ethnicity, and origin ACS 2023
- Neighborhood character
- Predominantly Black (77%)
- Race & ethnicity
- Black 77% Hispanic / Latino 16% Two or more races 11% White 3%
- Hispanic origin (detail)
- Mexican 6% Puerto Rican 1%
- Foreign-born
- 8% · Canada, China
- Languages at home
- 88% English-only · Spanish 10%
Political lean MEDSL · Harris
- 2024 margin
- Lean D (+5.5) · D 52.0% · R 46.4% · Other 1.6%
- 2008→2024 swing
- +3.9pp toward D · 2008: 1.6pp · 2024: 5.5pp
- All cycles
- 2024: D+5.5 2020: D+13.3 2016: D+12.4 2012: D+0.1 2008: D+1.6
Not yet ingested
- Civics
- —
Market trends
- HPI YoY
- ▲ 16.02%
- Current HPI
- 180.4283
- Rent YoY
- ▲ 4.77%
- Metro
- Houston-The Woodlands-Sugar Land, TX
- State GDP YoY
- ▲ 3.95%
- F500 in state
- 110
Industry mix (Fortune 500 HQ in TX)
| Industry | F500 HQs | Revenue |
|---|---|---|
| Energy | 16 | $1,198B |
|
||
| Technology | 5 | $198B |
|
||
| Engineering / Construction | 4 | $72B |
|
||
| Energy Services | 3 | $60B |
|
||
| Utilities | 3 | $41B |
|
||
| Healthcare | 2 | $330B |
|
||
Price history
+15.6% since first listed18 events — show timeline
- 2026-06-11 Price Changed $185,000 HARMLS
- 2026-06-10 Listed $209,000 HARMLS
- 2026-06-02 Listing Removed — HARMLS
- 2026-05-15 Listed $238,000 HARMLS
- 2020-08-18 Sold (Public Records) — Public Records
- 2020-08-17 Sold (MLS) — HARMLS
- 2020-07-15 Pending — HARMLS
- 2020-06-18 Listed $160,000 HARMLS
- 2019-12-15 Listing Removed — HARMLS
- 2019-11-15 Price Changed $145,000 HARMLS
- 2019-10-20 Price Changed $153,000 HARMLS
- 2019-10-20 Price Changed $152,000 HARMLS
- 2019-10-10 Listed $160,000 HARMLS
- 2019-05-07 Sold (Public Records) — Public Records
- 2019-04-30 Sold (Public Records) — Public Records
- 2019-04-26 Sold (Public Records) — Public Records
- 2019-04-09 Sold (Public Records) — Public Records
- 1976-05-28 Sold (Public Records) — Public Records
Property tax history
+14.1%/yrLatest (2025): $4,354 · -10.6% YoY. Source: county tax records.
Cash-flow waterfall
monthlySold comps — $/sqft
last 12 mo · ≤1 miLoading sold comps…