 Multi-family
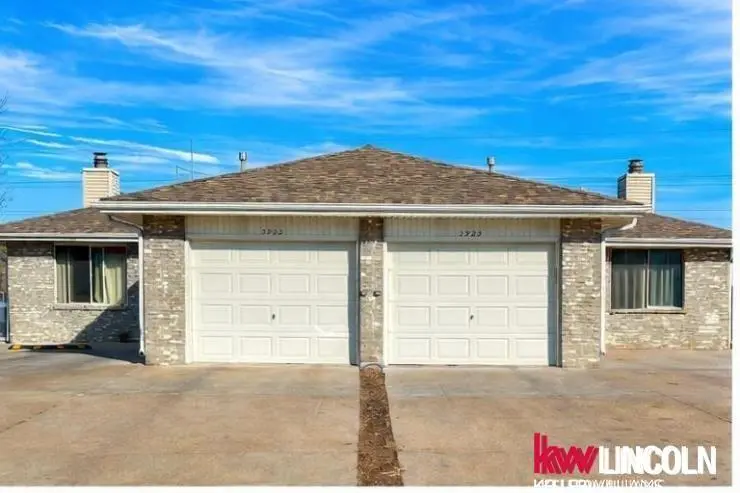
3900 & 3920 Sweetbriar Ln · Lincoln, NE
Flood risk 1/10 · Minimal
- FEMA flood zone
- X (unshaded)
- Chance of flooding over 30 yrs
- 0.0%
- Est. flood insurance / yr
- $473 – $860
Fire risk 1/10 · Minimal
- Est. fire insurance / yr
- $1,161 – $2,155
Heat risk 3/10 · Minor
- Hot days now (above 104°F)
- 7 days/yr
- Hot days in 30 yrs
- 16 days/yr
Wind risk 2/10 · Minimal
- Chance of severe wind over 30 yrs
- —
Air-quality risk 1/10 · Minimal
- Unhealthy air days now
- 0 days/yr
- Unhealthy air days in 30 yrs
- 0 days/yr
Risk factors via First Street. Map © Google.
Why this score? — see what drove the D+ grade
The composite is a weighted blend of 9 inputs, each scored 0–100. Each bar is that input's sub-score; the figure is the points it added to the 100-point composite (weight × sub-score).
- Cash flow +15.5/30.0
- ARV discount +7.5/15.0
- DSCR +4.8/10.0
- Schools +4.4/10.0
- Livability +4.2/5.0
- 1% rule +3.3/10.0
- Rent growth +3.3/5.0
- Condition / age +2.5/5.0
- Appreciation +0.0/10.0
$599,000
🖨 Deal sheet (PDF) 📄 Offer letter ✓ Due diligence
Multi-family units
County records classify this as Multi-Family (2-4 Unit). Listing-text estimate: 1 unit. estimate disagrees with records
Listing remarks
This well-maintained property includes 2 duplexes (4 apartments), offering a mix of 2 three-bedroom units and 2 two-bedroom units—all fully rented and generating consistent income. Each upper units comes with single-car garages and extra off-street parking for added convenience. Recent updates include a new roof and siding, ensuring peace of mind for years to come. Enjoy the added privacy with no direct neighbors behind the property. Perfectly situated just minutes from shopping, dining, and entertainment, this property offers both a prime location and long-term investment potential. Don’t miss out on this fully-rented, income-generating opportunity!
Key facts
- Single-car garages
- Added privacy
- New siding
Tags
Property features AI
Exterior
- Parking: Attached 2-car garage; Two covered parking spaces; Additional open parking slab; total parking for 2 vehicles
- Utilities: Public water; Public sewer
- Home design: Single-family residence (residential); Not new (built in 1977); Above-grade finished area and below-grade finished area
- Construction: Built in 1977; Below-grade finished area (finished basement); Foundation: Other
- Exterior features: Patio; Partial wood fencing; Lot approximately 0.39 acre (over 1/4 up to 1/2 acre)
Interior
- Kitchen: Range; Oven; Refrigerator; Dishwasher
- Bedrooms: Primary bedroom on the main floor; Two additional main-floor bedrooms; Two basement bedrooms
- Bathrooms: Six bathrooms total (four full, two three-quarter); Four bathrooms on the main level; Basement bathrooms included
- Heating & cooling: Natural gas and electric forced-air heating; Central air conditioning
- Interior features: Four fireplaces; Finished daylight walk-out basement with egress
Neighborhood map
What this means for you Summary
Snapshot
- This is a 3-bed/3.0-bath multifamily listed at $599k.
Deal economics
- At list price, monthly cash flow is $238 ($3k/yr) — positive.
- The deal already cash-flows at list — no discount required.
- To meet the 1% rule (rent ≥ 1% of price), the offer needs to be $499k (16.7% below list).
- Recommended offer: $499k (16.7% below list) — sets the bar for 1% rule.
- Cap rate 6.8% vs local median 3.0% in Lincoln — top-decile yield for the area; either an underpriced asset or a hidden risk that comps aren't pricing in. Stress-test before assuming the spread holds.
Location & tenants
- Location reads 85/100 on livability (#5 in NE, #545 nationally) — a professional / high-income tenant draw. Strengths: amenities A+, cost of living A+, housing A+; Watch: crime D+.
- Lincoln Public Schools (urban): math 50% / reading 53% proficiency, ranked #59 of 111 in NE (top 53%) — acceptable for families but not a draw, mixed tenant base, ~2y average lease.
- Zoned schools: Rousseau Elementary School (math 63% / reading 68%, grade B+, #76 of 502 statewide, top 15%, 566 students, 40% FRL); Irving Middle School (math 50% / reading 55%, grade C+, #42 of 128 statewide, top 32%, 890 students, 46% FRL); Southwest High School (math 60% / reading 64%, grade B-, #39 of 261 statewide, top 18%, 2,171 students, 26% FRL) — zoned schools at 37% FRL track the district average.
- Market conditions: Rents rising (+3.3%/yr); 483 active listings in the ZIP; 2 comparable units currently listed for rent nearby; solid renter incomes; 1,940 units permitted in Lancaster County in 2024 (895 in 5+ unit buildings).
- At $4,992/mo this rent would consume 59% of the median local household income ($101k/yr) (locally 1192% of renters already pay >50% of income on rent) — very limited rent-growth headroom before tenants either downsize or default.
Forward outlook
- Local home prices are declining (-3.0%/yr); year-one equity from $4k of loan paydown is wiped out by about $18k of value loss. Plan a longer hold.
- Lancaster County population projected at +37% by 2050 — long-run rental-demand tailwind backs the buy-and-hold thesis.
Negotiation context
- It's been on market 43 days — a 3% lower offer ($581k) is reasonable based on typical stale-listing flexibility.
- 4 sale attempts since 15y ago with the ask held roughly flat each time — persistent listings suggest the price (not the market) is what's stuck; bring a comps-based counter.
- Current owner paid $66k; list at $599k implies a 801% gain — meaningful room to come down on a strong offer.
Questions for the listing agent
- It's been on market 43 days. Have you received any prior offers? Is the seller open to a 17% concession, seller financing, or rate buy-down credit?
- Built in 1977 — when were the roof, HVAC, electrical panel, plumbing, and water heater last replaced?
- Is there a deadline driving the sale (1031 exchange, divorce, estate, relocation)? That informs how much negotiation room exists.
- Schools are A-rated — typically a magnet for longer-tenancy family renters. What's the average tenant stay here, and is there a school-zone premium baked into asking?
- Crime grade is D in this area — have there been break-ins, vandalism, or insurance claims at this property in the last 3 years? What carrier currently insures it and at what premium?
- The area grade is low — what's the realistic commute time and amenity access for the typical tenant pool here? Any planned neighborhood developments (good or bad) we should know about?
- What's the average days-on-market for RENTAL listings here right now (not sales)? A rising rental-DOM trend means longer vacancies and softer asking-rent achievability than the comps imply.
- What's the recent tenant-quality profile in this submarket — average credit score on applications, eviction rate, late-payment / NSF rate, and stable-employment percentage? A property-management company in the area should have these aggregated.
- How much new apartment / multifamily construction is in the pipeline within 1–3 miles? Heavy new supply (>2% of stock underway) typically softens rents 12–24 months out; light construction supports rent growth.
Investment metrics
- 1% rule
- 0.83% ✗
- Cap rate
- 6.77%
- Cash-on-cash
- 1.70%
- DSCR
- 1.08
- GRM
- 10.0
CMA / ARV
- ARV (median comp)
- $373,990
- List price
- $599,000
- Delta
- 60.16%
- Verdict
- OVERPRICED
- Comps
- 5 within 1.0 mi
Show comp detail 3 sales within ~0.75 mi
| Address | Dist | Beds/Ba | Sqft | Sold | Price | $/sf | Match |
|---|---|---|---|---|---|---|---|
| 5648 S 38th St | 0.46mi | 3/2.0 | 2,070 (-7%) | 12mo | $325,000 | $157 | 53 |
| 3400 Allendale Dr | 0.64mi | 4/3.0 (+1) | 2,192 (-1%) | 12mo | $351,000 | $160 | 53 |
| 3419 Allendale Dr | 0.60mi | 4/3.0 (+1) | 2,474 (+11%) | 20mo | $295,000 | $119 | 32 |
Match score weights: distance 35% · size 25% · config 20% · recency 20%. Top-matched comps best support the ARV.
Projected returns pro-forma
-3.0% appreciation · 3.33% rent growth · sell at horizon
- IRR
- -13.3%
- Equity multiple
- 0.52×
- Total profit
- $-80,450
- Equity at exit
- $89,313
- IRR
- -4.0%
- Equity multiple
- 0.73×
- Total profit
- $-44,463
- Equity at exit
- $51,791
Cash invested: $167,720 (down + closing). Projections, not guarantees.
Landlord ↔ Tenant lean methodology
- Overall (STATE)
- 83 Strongly Landlord-Friendly
- State Nebraska
- 83 Strongly Landlord-Friendly · R+13
- County
- — inherits STATE
- City
- — inherits STATE
ZIP-level market 68516
- Rents YoY
- 3.3%
- Active inventory
- 483
- Price-to-rent
- 35.5×
Monthly cashflow live
- Estimated rent
- $4,992 medium interval (Pro) →
- Mortgage (P&I)
- −$3,141
- Tax from tax record
- −$315 /mo · $3,782/yr
- Insurance
- −$250
- HOA
- −$0
- Vacancy / Maint / Mgmt
- −$1,048
- Net cashflow
- $238
Break-even live
Sensitivity live
| Price | -10% $577 | -5% $407 | +0% $238 | +5% $68 | +10% $-101 |
|---|---|---|---|---|---|
| Rent | -10% $-157 | -5% $41 | +0% $238 | +5% $435 | +10% $632 |
| Rate | -1.0pp $539 | -0.5pp $390 | base $238 | +0.5pp $83 | +1.0pp $-75 |
4-unit breakdown (identical units grouped — click to expand)
| Units | Beds | Baths | Est. rent |
|---|---|---|---|
| 2× units | 3 | 1 | $2,812 |
| #1 | 3 | 1 | $1,406 |
| #2 | 3 | 1 | $1,406 |
| 2× units | 2 | 1 | $2,180 |
| #3 | 2 | 1 | $1,090 |
| #4 | 2 | 1 | $1,090 |
| Total (4 units) | $4,992 | ||
UW: 25.0% down · 7.5% · 30yr · 1.5% tax · 5.0% vac · 8.0% maint · 8.0% mgmt
Financing live
Cash to close
- Down payment
- $149,750
- Closing costs
- $17,970
- Reserves months
- —
- Total cash needed
- —
Loan-product check · same deal, 3 products live
Conventional
25% down · 7.5% · 30yr
- Down + closing
- —
- Monthly P&I
- —
- Monthly cashflow
- —
- DSCR
- —
- Eligible?
- —
Personal DTI + credit; lowest rate.
DSCR
20% down · 8.5% · 30yr
- Down + closing
- —
- Monthly P&I
- —
- Monthly cashflow
- —
- DSCR
- —
- Eligible?
- —
No personal income docs; deal must DSCR.
Hard money
10% down · 12.0% · 12mo
- Down + closing
- —
- Monthly P&I
- —
- Monthly cashflow
- —
- DSCR
- —
- Eligible?
- —
Short-term bridge; refi at stabilization.
Rent comps 2 comps
| Address | Beds | Baths | Sqft | Rent | $/sqft | DOM | Units | Dist |
|---|---|---|---|---|---|---|---|---|
| 3751 Faulkner Dr Lincoln, NE | 1.0–3.0 | 1.0–2.0 | 1244 | $2,205 | $1.77 | 15d | 22 | 0.86mi |
| 4125 High St Lincoln, NE | 3.0 | 1.5 | 1600 | $1,950 | $1.22 | 23d | 1 | 1.29mi |
Listing history 24 events
-
2026-06-09days on market $599,000 Active 43 DOM
-
2026-06-08days on market $599,000 Active 42 DOM
-
2026-06-07days on market $599,000 Active 41 DOM
-
2026-06-05days on market $599,000 Active 38 DOM
-
2026-06-03days on market $599,000 Active 37 DOM
-
2026-06-02days on market $599,000 Active 36 DOM
-
2026-06-01days on market $599,000 Active 35 DOM
-
2026-05-31price $599,000 Active 34 DOM
-
2026-05-31days on market $609,900 Active 34 DOM
-
2026-05-30days on market $609,900 Active 33 DOM
-
2026-04-27$609,900 New 671-char remark
-
2026-04-27historical
-
2026-04-27historical
-
2026-04-09price $309,900
-
2026-04-09price $309,900
-
2026-03-10price $314,900
-
2026-03-10price $314,900
-
2026-03-09price $315,000
-
2026-03-09price $315,000
-
2026-01-27$325,000 New
-
2026-01-27$325,000 New
-
2011-10-28soldstatus $66,500
-
2011-10-03historical
-
2011-07-19$95,000
ⓘ Source: listings_history table (triggers on properties + properties_extension) + one-shot
backfill from property_details.listing_events for pre-trigger history.
Tax reassessment forecast NE · Resets to sale price
- Current annual tax
- $3,782 · $315/mo
- Projected year-2 tax
- $10,363 · $864/mo
- Expected delta
- +$6,581/yr (+$548/mo · 174.0%)
ⓘ Screening estimate from a state-policy table — verify with the county assessor before closing.
Climate risk First Street
- Flood 1/10 Low FEMA zone X (unshaded) · 0% chance over 30 yrs
- Wildfire 1/10 Low
- Heat 3/10 Moderate 7 d/yr ≥104°F today · 16 d/yr by 30 yrs out
- Wind 2/10 Low
- Air quality 1/10 Low 0 unhealthy d/yr today · 0 by 30 yrs out
Nearby sold comps map
Loading sold comps map…
Walkable amenities ~0.75 mi
Loading nearby amenities…
Taxation est. · year 1
- Rental income
- $59,904
- − Mortgage interest
- −$33,553
- − Property taxes
- −$3,782
- − Insurance
- −$2,995
- − Repairs & maintenance
- −$4,792
- − Management
- −$4,792
- − Depreciation
- −$17,425
- Taxable loss
- −$7,436
- Est. tax savings @ 24.0%
- +$1,785
- After-tax cash flow
- $4,638/yr
For passive investors: Depreciation is non-cash, so a rental often shows a tax loss while cash-flowing — sheltering income. Rental losses are passive: they offset passive income freely, and up to $25,000/yr can offset ordinary (W-2) income if you actively participate and your MAGI is under $100k (phasing out to $0 by $150k); unused losses carry forward. On sale, claimed depreciation is recaptured at up to 25%, and gains may owe capital-gains tax (a 1031 exchange can defer both). Figures are a year-1 estimate at your 24.0% rate — not tax advice; consult a CPA.
Schools (NCES district)
- District
- Lincoln Public Schools
- NCES district ID
- 3172840
- Math proficiency
- 50% ▼ -6.00%
- Reading proficiency
- 53% ▼ -3.00%
- Median HH income
- $50,273
- Composite
- 44.05/100
- National rank
- #2880
- State rank
- #59 of 111 in NE
Livability — Lincoln
- Score
- 85/100
- State rank
- #5
- US rank
- #545
Category grades
Schools grade is shown separately in the Schools card above.
Census & demographics
- Census place
- Lincoln, NE
- County
- Lancaster County · 291,509 people
- City population
- 291,509
- Metro
- Lincoln, NE
- Population (ZIP)
- 48,903
- Household income
- $100,821
- Rent vs Own
- Severe rent burden
- 1192.0
Population outlook (Lancaster County) Hauer SSP2
- Today (2025)
- 352,806 people
- By 2030
- 377,899 · +7.1%
- By 2040
- 428,582 · +21.5%
- By 2050
- 483,103 · +36.9%
- By 2075
- 632,390 · +79.2%
- By 2100
- 759,513 · +115.3%
Race, ethnicity, and origin ACS 2023
- Neighborhood character
- Predominantly White (87%)
- Race & ethnicity
- White 87% Two or more races 6% Hispanic / Latino 4% Asian 3% Black 2%
- Common ancestry
- Italian 3% Iranian 2% Romanian 2%
- Foreign-born
- 5% · Vietnam, Canada
- Languages at home
- 94% English-only · Spanish 1% Russian/Polish/Slavic 1% Vietnamese 1%
Political lean MEDSL · Lancaster
- 2024 margin
- Toss-up / Even · D 51.4% · R 47.1% · Other 1.5%
- 2008→2024 swing
- -0.7pp no change · 2008: 5.0pp · 2024: 4.3pp
- All cycles
- 2024: D+4.3 2020: D+7.8 2016: D+0.1 2012: R+1.0 2008: D+5.0
Not yet ingested
- Civics
- —
Market trends
- HPI YoY
- ▼ -243.57%
- Current HPI
- 226.0324
- Rent YoY
- ▲ 3.33%
- Metro
- Lincoln, NE
- State GDP YoY
- ▲ 0.68%
- F500 in state
- 2
Industry mix (Fortune 500 HQ in NE)
| Industry | F500 HQs | Revenue |
|---|---|---|
| Conglomerate | 1 | $371B |
|
||
Price history
+530.5% since first listed16 events — show timeline
- 2026-06-09 Listing Removed — GPRMLS
- 2026-05-31 Price Changed $599,000 GPRMLS
- 2026-04-27 Listing Removed — GPRMLS
- 2026-04-27 Listing Removed — GPRMLS
- 2026-04-27 Listed $609,900 GPRMLS
- 2026-04-09 Price Changed $309,900 GPRMLS
- 2026-04-09 Price Changed $309,900 GPRMLS
- 2026-03-10 Price Changed $314,900 GPRMLS
- 2026-03-10 Price Changed $314,900 GPRMLS
- 2026-03-09 Price Changed $315,000 GPRMLS
- 2026-03-09 Price Changed $315,000 GPRMLS
- 2026-01-27 Listed $325,000 GPRMLS
- 2026-01-27 Listed $325,000 GPRMLS
- 2011-10-28 Sold (MLS) $66,500 GPRMLS
- 2011-10-03 Listing Removed — GPRMLS
- 2011-07-19 Listed $95,000 GPRMLS
Property tax history
+3.2%/yrLatest (2025): $3,782 · +20.8% YoY. Source: county tax records.
Cash-flow waterfall
monthlySold comps — $/sqft
last 12 mo · ≤1 miLoading sold comps…