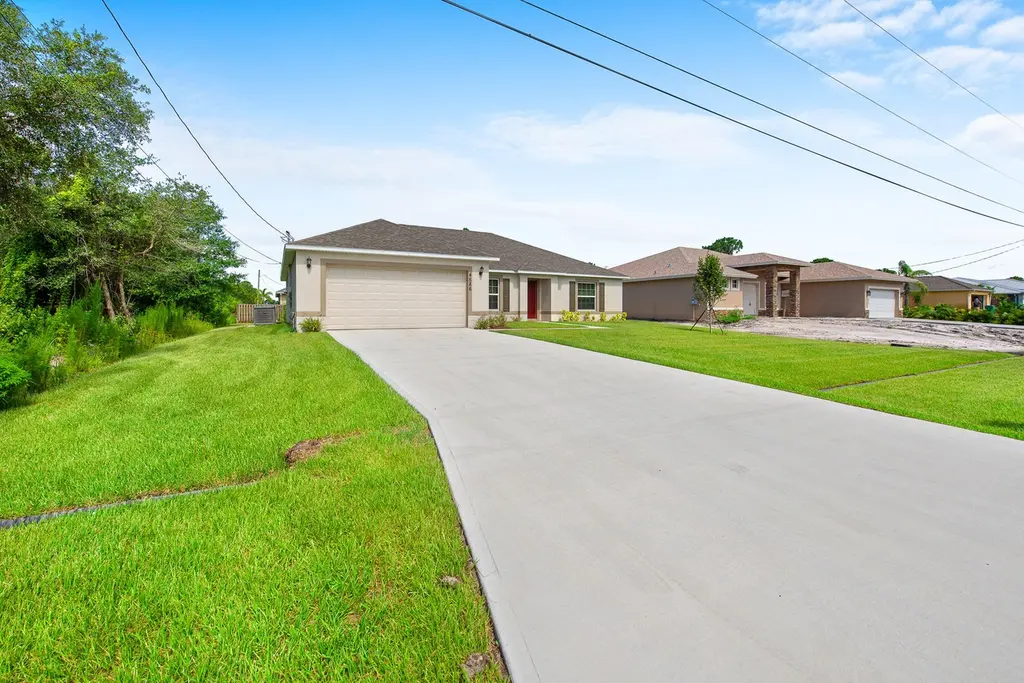
4586 SW Image Dr · Port St. Lucie, FL
Flood risk 1/10 · Minimal
- FEMA flood zone
- X (unshaded)
- Chance of flooding over 30 yrs
- 0.0%
- Est. flood insurance / yr
- $507 – $1,088
Fire risk 3/10 · Minor
- Est. fire insurance / yr
- $947 – $1,759
Heat risk 10/10 · Severe
- Hot days now (above 106°F)
- 7 days/yr
- Hot days in 30 yrs
- 26 days/yr
Wind risk 10/10 · Severe
- Chance of severe wind over 30 yrs
- 99.0%
Air-quality risk 1/10 · Minimal
- Unhealthy air days now
- 0 days/yr
- Unhealthy air days in 30 yrs
- 0 days/yr
Risk factors via First Street. Map © Google.
Why this score? — see what drove the C grade
The composite is a weighted blend of 9 inputs, each scored 0–100. Each bar is that input's sub-score; the figure is the points it added to the 100-point composite (weight × sub-score).
- Cash flow +19.6/30.0
- ARV discount +15.0/15.0
- 1% rule +7.0/10.0
- DSCR +6.2/10.0
- Schools +3.7/10.0
- Rent growth +2.6/5.0
- Livability +2.5/5.0
- Condition / age +2.5/5.0
- Appreciation +0.0/10.0
$255,000
🖨 Deal sheet (PDF) 📄 Offer letter ✓ Due diligence
Listing remarks MLS
AREA OF NEW HOME CLOSE TO I-95 PRICE TO SELL
Key facts
- 0.23 acre lot
- 2 garage spots
- Built 2019
Neighborhood map
What this means for you Summary
Snapshot
- This is a 3-bed/2.0-bath single-family listed at $255k.
Deal economics
- At list price, monthly cash flow is $296 ($4k/yr) — positive.
- The deal already cash-flows at list — no discount required.
- Meets the 1% rule at list price ($3k rent vs $255k).
- Recommended offer: $247k (3.0% below list) — sets the bar for market timing.
- Cap rate 7.7% vs local median 3.9% in Port St. Lucie — top-decile yield for the area; either an underpriced asset or a hidden risk that comps aren't pricing in. Stress-test before assuming the spread holds.
Location & tenants
- Location reads: area grade C — affects rentability + tenant quality, not the cash-flow math above.
- St. Lucie (urban): math 40% / reading 48% proficiency, ranked #51 of 73 in FL (top 70%) — families likely to look elsewhere, expect single-tenant / working-renter base with shorter leases.
- Zoned schools: Manatee Academy K-8 (math 53% / reading 51%, grade C-, #990 of 2,144 statewide, top 48%, 1,664 students, 65% FRL); Southern Oaks Middle School (math 39% / reading 43%, grade F, #353 of 571 statewide, top 63%, 894 students, 76% FRL); Fort Pierce Central High School (math 15% / reading 45%, grade F, #441 of 667 statewide, top 67%, 3,091 students, 62% FRL).
- Market conditions: Rents flat; 768 active listings in the ZIP; 17 comparable units currently listed for rent nearby; rentals at typical pace (median 23d on market — plan ~3-4 weeks tenant-placement turnaround); solid renter incomes; 4,868 units permitted in St. Lucie County in 2024 (268 in 5+ unit buildings).
- This rent runs 43% of the median local income ($86k/yr) — at the standard rent-burdened threshold; future hikes will face affordability resistance.
Forward outlook
- Local home prices are declining (-3.0%/yr); year-one equity from $2k of loan paydown is wiped out by about $8k of value loss. Plan a longer hold.
- St. Lucie County population projected at +20% by 2050 — long-run rental-demand tailwind backs the buy-and-hold thesis.
Negotiation context
- It's been on market 31 days — a 3% lower offer ($247k) is reasonable based on typical stale-listing flexibility.
- 6 sale attempts since 21y ago with the ask held roughly flat each time — persistent listings suggest the price (not the market) is what's stuck; bring a comps-based counter.
Risks & watch-outs
- Watch-outs: property tax is 3.2% of price.
- Climate carrying-cost: severe wind risk, 99% chance of damaging wind over 30y; extreme-heat days projected 7→26/yr by 2055 (HVAC capex compounding) — expect insurance premiums to compound above CPI over the hold.
Questions for the listing agent
- It's been on market 31 days. Have you received any prior offers? Is the seller open to a 3% concession, seller financing, or rate buy-down credit?
- Property tax is high relative to price — has the assessment been appealed recently, and will the sale trigger a re-assessment?
- Is there a deadline driving the sale (1031 exchange, divorce, estate, relocation)? That informs how much negotiation room exists.
- What's the average days-on-market for RENTAL listings here right now (not sales)? A rising rental-DOM trend means longer vacancies and softer asking-rent achievability than the comps imply.
- What's the recent tenant-quality profile in this submarket — average credit score on applications, eviction rate, late-payment / NSF rate, and stable-employment percentage? A property-management company in the area should have these aggregated.
- How much new for-sale + rental construction is in the pipeline within 1–3 miles? Heavy new supply typically softens prices + rents 12–24 months out; constrained supply supports both.
Investment metrics
- 1% rule
- 1.20% ✓
- Cap rate
- 7.68%
- Cash-on-cash
- 4.97%
- DSCR
- 1.22
- GRM
- 6.9
CMA / ARV
- ARV (on-the-fly)
- $430,790
- Comps found
- 12
Show comp detail 12 sales within ~0.75 mi
| Address | Dist | Beds/Ba | Sqft | Sold | Price | $/sf | Match |
|---|---|---|---|---|---|---|---|
| 1441 SW Edinburgh Dr | 0.21mi | 3/2.0 | 2,023 (+8%) | 1mo | $455,000 | $225 | 76 |
| 1422 SW Becker Rd | 0.12mi | 4/2.0 (+1) | 1,806 (-4%) | 9mo | $415,000 | $230 | 76 |
| 1144 SW Arc Ct | 0.36mi | 4/2.0 (+1) | 1,935 (+3%) | 5mo | $447,500 | $231 | 68 |
| 4314 SW Jaunt Rd | 0.35mi | 3/3.0 | 1,803 (-4%) | 8mo | $439,000 | $243 | 67 |
| 4682 SW Babylon St | 0.50mi | 4/2.0 (+1) | 1,916 (+2%) | 4mo | $440,000 | $230 | 64 |
| 1357 SW Idol Ave | 0.44mi | 4/2.0 (+1) | 1,997 (+7%) | 1mo | $425,000 | $213 | 63 |
| 4572 SW Savona Blvd #16 | 0.46mi | 4/2.0 (+1) | 1,819 (-3%) | 9mo | $424,995 | $234 | 61 |
| 4266 SW Mcclellen St | 0.69mi | 4/2.0 (+1) | 1,906 (+2%) | 1mo | $435,000 | $228 | 59 |
| 1312 SW Calmar Ave #164 | 0.16mi | 4/3.0 (+1) | 2,126 (+14%) | 3mo | $489,000 | $230 | 59 |
| 4497 Farmington St | 0.27mi | 4/3.0 (+1) | 2,101 (+12%) | 2mo | $415,000 | $198 | 57 |
| 1261 SW Kapok Ave | 0.73mi | 3/2.0 | 1,680 (-10%) | 5mo | $474,900 | $283 | 44 |
| 1041 SW Dartmouth Ave | 0.61mi | 4/3.0 (+1) | 2,132 (+14%) | 5mo | $490,000 | $230 | 35 |
Match score weights: distance 35% · size 25% · config 20% · recency 20%. Top-matched comps best support the ARV.
Projected returns pro-forma
-3.0% appreciation · 0.22% rent growth · sell at horizon
- IRR
- -12.2%
- Equity multiple
- 0.57×
- Total profit
- $-30,578
- Equity at exit
- $38,021
- IRR
- -8.9%
- Equity multiple
- 0.53×
- Total profit
- $-33,715
- Equity at exit
- $22,048
Cash invested: $71,400 (down + closing). Projections, not guarantees.
Landlord ↔ Tenant lean methodology
- Overall (STATE)
- 87 Strongly Landlord-Friendly
- State Florida
- 87 Strongly Landlord-Friendly · R+3
- County
- — inherits STATE
- City
- — inherits STATE
ZIP-level market 34953
- Home prices YoY
- -10.1%
- Rents YoY
- 0.2%
- Active inventory
- 768
- Price-to-rent
- 6.9×
Monthly cashflow live
- Estimated rent
- $3,071 high interval (Pro) →
- Mortgage (P&I)
- −$1,337
- Tax from tax record
- −$687 /mo · $8,241/yr
- Insurance
- −$106
- HOA
- −$0
- Vacancy / Maint / Mgmt
- −$645
- Net cashflow
- $296
Break-even live
Sensitivity live
| Price | -10% $440 | -5% $368 | +0% $296 | +5% $223 | +10% $151 |
|---|---|---|---|---|---|
| Rent | -10% $53 | -5% $174 | +0% $296 | +5% $417 | +10% $538 |
| Rate | -1.0pp $424 | -0.5pp $360 | base $296 | +0.5pp $230 | +1.0pp $162 |
UW: 25.0% down · 7.5% · 30yr · 1.5% tax · 5.0% vac · 8.0% maint · 8.0% mgmt
Financing live
Cash to close
- Down payment
- $63,750
- Closing costs
- $7,650
- Reserves months
- —
- Total cash needed
- —
Loan-product check · same deal, 3 products live
Conventional
25% down · 7.5% · 30yr
- Down + closing
- —
- Monthly P&I
- —
- Monthly cashflow
- —
- DSCR
- —
- Eligible?
- —
Personal DTI + credit; lowest rate.
DSCR
20% down · 8.5% · 30yr
- Down + closing
- —
- Monthly P&I
- —
- Monthly cashflow
- —
- DSCR
- —
- Eligible?
- —
No personal income docs; deal must DSCR.
Hard money
10% down · 12.0% · 12mo
- Down + closing
- —
- Monthly P&I
- —
- Monthly cashflow
- —
- DSCR
- —
- Eligible?
- —
Short-term bridge; refi at stabilization.
Rent comps 17 comps
| Address | Beds | Baths | Sqft | Rent | $/sqft | DOM | Units | Dist |
|---|---|---|---|---|---|---|---|---|
| 1280 SW Kalevala Dr Port Saint Lucie, FL | 4.0 | 3.0 | 2080 | $3,300 | $1.59 | 16d | 1 | 0.36mi |
| 1201 SW Idol Ave Port Saint Lucie, FL | 3.0 | 2.0 | 1796 | $2,600 | $1.45 | 16d | 1 | 0.56mi |
| 1481 SW Jacksonville Ave Port Saint Lucie, FL | 3.0 | 2.0 | 1780 | $3,300 | $1.85 | 16d | 1 | 0.61mi |
| 4209 SW McClellen St Port Saint Lucie, FL | 3.0 | 2.0 | 1766 | $3,400 | $1.93 | 25d | 1 | 0.78mi |
| 962 SW Kappa Ave Port Saint Lucie, FL | 3.0 | 2.0 | 1275 | $3,000 | $2.35 | 25d | 1 | 1.03mi |
| 4285 SW Walker St Port Saint Lucie, FL | 4.0 | 2.0 | 1833 | $2,476 | $1.35 | 16d | 1 | 1.07mi |
| 1198 SW Ingrassina Ave Port Saint Lucie, FL | 4.0 | 2.0 | 1993 | $2,800 | $1.40 | 25d | 1 | 1.09mi |
| 4262 SW Jared St Port Saint Lucie, FL | 3.0 | 2.0 | 1240 | $2,350 | $1.90 | 25d | 1 | 1.12mi |
| 1342 SW Wampler Ave Port Saint Lucie, FL | 3.0 | 2.0 | 1282 | $2,400 | $1.87 | 25d | 1 | 1.13mi |
| 952 SW Jasper Ave Port Saint Lucie, FL | 4.0 | 2.0 | 1833 | $2,216 | $1.21 | 23d | 1 | 1.26mi |
| 1326 SW Bartell Ave Port Saint Lucie, FL | 3.0 | 2.0 | 2370 | $3,000 | $1.27 | 25d | 1 | 1.29mi |
| 363 SW Becker Rd Port Saint Lucie, FL | 4.0 | 3.0 | 2236 | $5,500 | $2.46 | 16d | 1 | 1.31mi |
| 8500 SW America Walks Blvd Port Saint Lucie, FL | 1.0–2.0 | 1.0–2.0 | 1306 | $2,995 | $2.29 | 23d | 19 | 1.33mi |
| 644 SW Hoffenberg Ave Port Saint Lucie, FL | 4.0 | 2.0 | 2134 | $2,900 | $1.36 | 25d | 1 | 1.41mi |
| 854 SW Paar Dr Port Saint Lucie, FL | 4.0 | 3.0 | 2121 | $2,800 | $1.32 | 25d | 1 | 1.43mi |
| 4481 SW Darlington St Port Saint Lucie, FL | 4.0 | 2.0 | 1796 | $2,700 | $1.50 | 16d | 1 | 1.47mi |
| 601 SW Icon Ave Port Saint Lucie, FL | 3.0 | 2.0 | 1383 | $2,800 | $2.02 | 23d | 1 | 1.48mi |
Listing history 19 events
-
2026-03-11status Pending
-
2019-10-25soldstatus $250,000
-
2019-10-03historical
-
2019-09-23status Pending
-
2019-08-23$255,000 Active
-
2019-07-26$255,000 Active
-
2018-08-17soldstatus $25,000
-
2017-04-17soldstatus $19,000
-
2015-02-19historical 44-char remark
Show marketing remark (44 chars)
AREA OF NEW HOME CLOSE TO I-95 PRICE TO SELL
-
2014-02-14soldstatus $13,000
-
2014-02-12soldstatus $13,000
-
2014-01-15historical
-
2013-07-22$15,000
-
2006-03-08$89,900 44-char remark
Show marketing remark (44 chars)
AREA OF NEW HOME CLOSE TO I-95 PRICE TO SELL
-
2006-03-07historical
-
2006-03-07historical
-
2005-12-07$89,700
-
2005-07-26$89,700
-
2005-04-11soldstatus $19,700
ⓘ Source: listings_history table (triggers on properties + properties_extension) + one-shot
backfill from property_details.listing_events for pre-trigger history.
Tax reassessment forecast FL · Resets to sale price
- Current annual tax
- $8,241 · $687/mo
- Projected year-2 tax
- $8,241 · $687/mo
- Expected delta
- $0/yr ($0/mo · 0.0%)
ⓘ Screening estimate from a state-policy table — verify with the county assessor before closing.
Climate risk First Street
- Flood 1/10 Low FEMA zone X (unshaded) · 0% chance over 30 yrs
- Wildfire 3/10 Moderate
- Heat 10/10 Extreme 7 d/yr ≥106°F today · 26 d/yr by 30 yrs out
- Wind 10/10 Extreme 99% chance of damaging wind over 30 yrs
- Air quality 1/10 Low 0 unhealthy d/yr today · 0 by 30 yrs out
Nearby sold comps map
Loading sold comps map…
Walkable amenities ~0.75 mi
Loading nearby amenities…
Taxation est. · year 1
- Rental income
- $36,849
- − Mortgage interest
- −$14,284
- − Property taxes
- −$8,241
- − Insurance
- −$1,275
- − Repairs & maintenance
- −$2,948
- − Management
- −$2,948
- − Depreciation
- −$7,418
- Taxable loss
- −$265
- Est. tax savings @ 24.0%
- +$64
- After-tax cash flow
- $3,611/yr
For passive investors: Depreciation is non-cash, so a rental often shows a tax loss while cash-flowing — sheltering income. Rental losses are passive: they offset passive income freely, and up to $25,000/yr can offset ordinary (W-2) income if you actively participate and your MAGI is under $100k (phasing out to $0 by $150k); unused losses carry forward. On sale, claimed depreciation is recaptured at up to 25%, and gains may owe capital-gains tax (a 1031 exchange can defer both). Figures are a year-1 estimate at your 24.0% rate — not tax advice; consult a CPA.
Schools (NCES district)
- District
- St. Lucie
- NCES district ID
- 1201770
- Math proficiency
- 40% ▼ -11.00%
- Reading proficiency
- 48% ▼ -4.00%
- Median HH income
- $44,737
- Composite
- 37.28/100
- National rank
- #4449
- State rank
- #51 of 73 in FL
Livability — Port St. Lucie
No livability data for this city. (Only ~50 U.S. cities are tracked.)
Census & demographics
- Census place
- Port St. Lucie, FL
- County
- Saint Lucie County · 337,150 people
- City population
- 221,051
- Metro
- Port St. Lucie, FL
- Population (ZIP)
- 86,875
- Household income
- $85,667
- Rent vs Own
- Severe rent burden
- 857.0
Population outlook (St. Lucie County) Hauer SSP2
- Today (2025)
- 338,016 people
- By 2030
- 355,687 · +5.2%
- By 2040
- 385,521 · +14.1%
- By 2050
- 406,106 · +20.1%
- By 2075
- 441,054 · +30.5%
- By 2100
- 436,885 · +29.2%
Race, ethnicity, and origin ACS 2023
- Neighborhood character
- Diverse neighborhood (Simpson 0.69)
- Race & ethnicity
- White 42% Hispanic / Latino 28% Black 23% Two or more races 15% Asian 2%
- Hispanic origin (detail)
- Mexican 2% Puerto Rican 8% Cuban 4% Dominican 3%
- Common ancestry
- Hispanic 4% Romanian 2% Estonian 2%
- Foreign-born
- 24% · Canada, Jamaica, China
- Languages at home
- 69% English-only · Spanish 19% French/Haitian/Cajun 6% Other Indo-European 3%
Political lean MEDSL · St. Lucie
- 2024 margin
- Lean R (+9.1) · D 45.1% · R 54.2%
- 2008→2024 swing
- -21.2pp toward R · 2008: 12.1pp · 2024: -9.1pp
- All cycles
- 2024: R+9.1 2020: R+1.6 2016: R+2.5 2012: D+7.9 2008: D+12.1
Not yet ingested
- Civics
- —
Market trends
- HPI YoY
- ▼ -44.19%
- Current HPI
- 392.7681
- Rent YoY
- ▲ 0.22%
- Metro
- Port St. Lucie, FL
- State GDP YoY
- ▲ 3.28%
- F500 in state
- 36
Industry mix (Fortune 500 HQ in FL)
| Industry | F500 HQs | Revenue |
|---|---|---|
| Industrial Technology | 2 | $29B |
|
||
| Insurance | 2 | $17B |
|
||
| Retail | 1 | $60B |
|
||
| Technology Distribution | 1 | $58B |
|
||
| Homebuilding | 1 | $35B |
|
||
| Technology Manufacturing | 1 | $35B |
|
||
Price history
+1169.0% since first listed19 events — show timeline
- 2026-03-11 Pending — Beaches MLS
- 2019-10-25 Sold (Public Records) $250,000 Public Records
- 2019-10-03 Listing Removed — Stellar MLS as Distributed by MLS Grid
- 2019-09-23 Pending — Beaches MLS
- 2019-08-23 Listed $255,000 Beaches MLS
- 2019-07-26 Listed $255,000 Stellar MLS as Distributed by MLS Grid
- 2018-08-17 Sold (Public Records) $25,000 Public Records
- 2017-04-17 Sold (Public Records) $19,000 Public Records
- 2015-02-19 Listing Removed — Beaches MLS
- 2014-02-14 Sold (Public Records) $13,000 Public Records
- 2014-02-12 Sold (MLS) $13,000 Beaches MLS
- 2014-01-15 Listing Removed — Beaches MLS
- 2013-07-22 Listed $15,000 Beaches MLS
- 2006-03-08 Listed $89,900 Beaches MLS
- 2006-03-07 Listing Removed — Beaches MLS
- 2006-03-07 Listing Removed — Beaches MLS
- 2005-12-07 Listed $89,700 Beaches MLS
- 2005-07-26 Listed $89,700 Beaches MLS
- 2005-04-11 Sold (Public Records) $19,700 Public Records
Property tax history
+35.6%/yrLatest (2025): $8,241 · +6.4% YoY. Source: county tax records.
Cash-flow waterfall
monthlySold comps — $/sqft
last 12 mo · ≤1 miLoading sold comps…