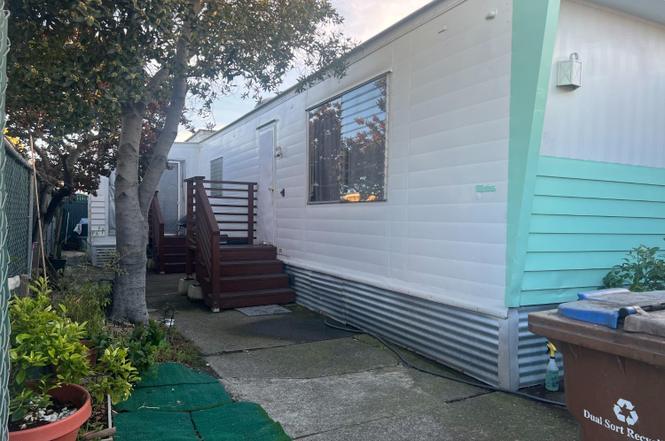
2130 Redwood Hwy Unit F5 · Larkspur, CA
Flood risk No data
- FEMA flood zone
- —
- Chance of flooding over 30 yrs
- —
- Est. flood insurance / yr
- —
Fire risk No data
- Est. fire insurance / yr
- —
Heat risk No data
- Hot days now (above threshold)
- —
- Hot days in 30 yrs
- —
Wind risk No data
- Chance of severe wind over 30 yrs
- —
Air-quality risk No data
- Unhealthy air days now
- —
- Unhealthy air days in 30 yrs
- —
Risk factors via First Street. Map © Google.
Why this score? — see what drove the B grade
The composite is a weighted blend of 9 inputs, each scored 0–100. Each bar is that input's sub-score; the figure is the points it added to the 100-point composite (weight × sub-score).
- Cash flow +30.0/30.0
- 1% rule +10.0/10.0
- DSCR +10.0/10.0
- Appreciation +7.7/10.0
- Schools +6.5/10.0
- Livability +4.3/5.0
- Rent growth +3.4/5.0
- Condition / age +2.5/5.0
- ARV discount +0.0/15.0
$120,000
🖨 Deal sheet 📄 Offer letter ✓ Due diligence
Listing remarks
Excellent central Marin location and school district! Affordable and Rarely available. Updated spacious one-bedroom, one-bath home is move-in ready! All-age park, friendly community, owner-occupied park. Quiet, private, fenced, and spacious yard patio. Sunny & bright throughout. Beautifully remodeled kitchen with laminated floors throughout the entire home. The seller has converted the living room into a bedroom. Assigned, off-street parking. Conveniently to all amenities such as Larkspur Ferry, Village, Town Center with Farmer's Market, Smart train station, buses, hiking and biking trails including Cal Park tunnel, quick freeway access to everything! Current owner's space rent will
Key facts
- Quick freeway access
- Remodeled kitchen
- Private fenced yard
Tags
Property features AI
Finance
- HOA & community: No HOA; Located in Marin RV park; Not a senior community
Exterior
- Parking: Assigned off-street parking (1 space)
- Security: Carbon monoxide detector
- Utilities: Public sewer; Land lease: $1,500/month
- Home design: Manufactured in park (single wide)
- Construction: Metal roof; Mayflower (Guerdon) manufactured home; Aluminum skirting
- Exterior features: Porch steps
Interior
- Kitchen: Wood counters; Dishwasher; Disposal; Free-standing gas range; Free-standing refrigerator; Range hood
- Bedrooms: 1 bedroom
- Flooring: Laminate flooring
- Bathrooms: 1 full bathroom with tile and tub/shower combo
- Heating & cooling: Gas heating; No cooling
- Interior features: Updated/remodeled condition; Carbon monoxide detector
- Laundry & utility: No laundry in unit
Neighborhood map
What this means for you Summary
Snapshot
- This is a 1-bed/1.0-bath manufactured listed at $120k.
Deal economics
- At list price, monthly cash flow is $2k ($22k/yr) — positive.
- The deal already cash-flows at list — no discount required.
- Meets the 1% rule at list price ($3k rent vs $120k).
- Recommended offer: $106k (12.0% below list) — sets the bar for market timing.
- Cap rate 24.8% vs local median 1.4% in Larkspur — top-decile yield for the area; either an underpriced asset or a hidden risk that comps aren't pricing in. Stress-test before assuming the spread holds.
Location & tenants
- Location reads 86/100 on livability (#5 in CA, #381 nationally) — a professional / high-income tenant draw. Strengths: schools A+, amenities A+, commute A+; Watch: cost of living F.
- Tamalpais Union High (suburban): math 62% / reading 78% proficiency, ranked #42 of 517 in CA (top 8%) — strong family-tenant draw, lease renewals of 3-5y typical.
- Market conditions: Rents rising (+3.5%/yr); 49 active listings in the ZIP; 3 comparable units currently listed for rent nearby; rentals leasing fast (median 2d on market — plan ~1-2 weeks tenant-placement turnaround); high-income renter base; 149 units permitted in Marin County in 2024 (5 in 5+ unit buildings).
Forward outlook
- In year one you build about $7k of equity ($830 loan paydown + $7k appreciation (5.4% local appreciation)).
- Marin County population projected at +9% by 2050 — modest demand growth; plan on rents tracking national, not racing it.
- At projected returns (5.4% appreciation + 3.5% rent growth), your $34k cash investment doubles in ~2 years — after that, you're playing with house money.
- By year 5, paydown + projected appreciation supports a ~$32k cash-out refi (75% LTV) — recoverable capital for the next deal without selling this one.
Negotiation context
- It's been on market 357 days — a 12% lower offer ($106k) is reasonable based on typical stale-listing flexibility.
- 6 sale attempts since 7y ago; this cycle's ask has dropped $9k (7%) from the opening price — seller is motivated, your offer sets the floor, not the list.
Questions for the listing agent
- It's been on market 357 days. Have you received any prior offers? Is the seller open to a 12% concession, seller financing, or rate buy-down credit?
- Built in 1961 — when were the roof, HVAC, electrical panel, plumbing, and water heater last replaced?
- Why hasn't it sold? Are there any deal-killer items the seller is aware of (foundation, flood, title, zoning, code violations)?
- Is there a deadline driving the sale (1031 exchange, divorce, estate, relocation)? That informs how much negotiation room exists.
- Schools are A-rated — typically a magnet for longer-tenancy family renters. What's the average tenant stay here, and is there a school-zone premium baked into asking?
- What's the average days-on-market for RENTAL listings here right now (not sales)? A rising rental-DOM trend means longer vacancies and softer asking-rent achievability than the comps imply.
- What's the recent tenant-quality profile in this submarket — average credit score on applications, eviction rate, late-payment / NSF rate, and stable-employment percentage? A property-management company in the area should have these aggregated.
- How much new for-sale + rental construction is in the pipeline within 1–3 miles? Heavy new supply typically softens prices + rents 12–24 months out; constrained supply supports both.
Investment metrics
- 1% rule
- 2.82% ✓
- Cap rate
- 24.75%
- Cash-on-cash
- 65.92%
- DSCR
- 3.93
- GRM
- 3.0
CMA / ARV
- ARV (on-the-fly)
- $85,800
- Comps found
- 2
Show comp detail 2 sales within ~0.75 mi
| Address | Dist | Beds/Ba | Sqft | Sold | Price | $/sf | Match |
|---|---|---|---|---|---|---|---|
| 2130 Redwood Hwy Unit D2 | 0.03mi | 2/1.0 (+1) | 576 (+5%) | 8mo | $90,000 | $156 | 79 |
| 2000 Redwood Hwy #71 | 0.27mi | 1/1.0 | 480 (-13%) | 10mo | $65,000 | $135 | 57 |
Match score weights: distance 35% · size 25% · config 20% · recency 20%. Top-matched comps best support the ARV.
Projected returns pro-forma
5.43% appreciation · 3.52% rent growth · sell at horizon
- IRR
- 73.4%
- Equity multiple
- 5.47×
- Total profit
- $150,029
- Equity at exit
- $71,175
- IRR
- 71.2%
- Equity multiple
- 11.54×
- Total profit
- $354,254
- Equity at exit
- $125,546
Cash invested: $33,600 (down + closing). Projections, not guarantees.
Landlord ↔ Tenant lean methodology
- Overall (STATE)
- 18 Strongly Tenant-Friendly
- State California
- 18 Strongly Tenant-Friendly · D+13
- County
- — inherits STATE
- City
- — inherits STATE
ZIP-level market 94904
- Home prices YoY
- 2.0%
- Rents YoY
- 3.5%
- Active inventory
- 49
- Price-to-rent
- 3.0×
Monthly cashflow live
- Estimated rent
- $3,386 medium interval (Pro) →
- Mortgage (P&I)
- −$629
- Tax est. 1.5%
- −$150 /mo · $1,800/yr
- Insurance
- −$50
- HOA
- −$0
- Vacancy / Maint / Mgmt
- −$711
- Net cashflow
- $1,846
Break-even live
UW: 25.0% down · 7.5% · 30yr · 1.5% tax · 5.0% vac · 8.0% maint · 8.0% mgmt
Financing live
Cash to close
- Down payment
- $30,000
- Closing costs
- $3,600
- Reserves months
- —
- Total cash needed
- —
Loan-product check · same deal, 3 products live
Conventional
25% down · 7.5% · 30yr
- Down + closing
- —
- Monthly P&I
- —
- Monthly cashflow
- —
- DSCR
- —
- Eligible?
- —
Personal DTI + credit; lowest rate.
DSCR
20% down · 8.5% · 30yr
- Down + closing
- —
- Monthly P&I
- —
- Monthly cashflow
- —
- DSCR
- —
- Eligible?
- —
No personal income docs; deal must DSCR.
Hard money
10% down · 12.0% · 12mo
- Down + closing
- —
- Monthly P&I
- —
- Monthly cashflow
- —
- DSCR
- —
- Eligible?
- —
Short-term bridge; refi at stabilization.
Rent comps 3 comps
| Address | Beds | Baths | Sqft | Rent | $/sqft | DOM | Units | Dist |
|---|---|---|---|---|---|---|---|---|
| 199 Tamal Vista Blvd Corte Madera, CA | 1.0–3.0 | 1.0–2.0 | 1018 | $4,245 | $4.17 | 1d | 24 | 0.34mi |
| 505 Magnolia Ave Larkspur, CA | — | 1.0 | 350 | $2,150 | $6.14 | 10d | 1 | 1.15mi |
| 30 Locust Ave Unit 6 Larkspur, CA | 2.0 | 1.0 | 750 | $2,700 | $3.60 | 1d | 1 | 1.21mi |
Listing history 27 events
-
2026-06-18days on market $120,000 Active 357 DOM
-
2026-06-17days on market $120,000 Active 356 DOM
-
2026-06-16days on market $120,000 Active 355 DOM
-
2026-06-15days on market $120,000 Active 354 DOM
-
2026-06-13days on market $120,000 Active 352 DOM
-
2026-06-13days on market $120,000 Active 351 DOM
-
2026-06-09days on market $120,000 Active 348 DOM
-
2026-06-08days on market $120,000 Active 347 DOM
-
2026-06-07days on market $120,000 Active 346 DOM
-
2026-06-04days on market $120,000 Active 343 DOM
-
2026-06-03days on market $120,000 Active 342 DOM
-
2026-06-02days on market $120,000 Active 341 DOM
-
2026-06-01days on market $120,000 Active 340 DOM
-
2026-05-31days on market $120,000 Active 339 DOM
-
2026-04-23status Active
-
2026-04-23price $120,000
-
2025-06-24$129,000 Active
-
2024-06-08price $139,500
-
2024-02-26$149,500 Active
-
2022-02-26$159,500 Active
-
2019-09-06soldstatus $113,500 Sold
-
2019-09-01status Pending
-
2019-08-20historical Contingent
-
2019-08-13status Active
-
2019-08-13price $117,500
-
2019-08-07historical Off-Market
-
2019-05-08$125,000 Active
ⓘ Source: listings_history table (triggers on properties + properties_extension) + one-shot
backfill from property_details.listing_events for pre-trigger history.
Nearby sold comps map
Loading sold comps map…
Walkable amenities ~0.75 mi
Loading nearby amenities…
Taxation est. · year 1
- Rental income
- $40,633
- − Mortgage interest
- −$6,722
- − Property taxes
- −$1,800
- − Insurance
- −$600
- − Repairs & maintenance
- −$3,251
- − Management
- −$3,251
- − Depreciation
- −$3,491
- Taxable income
- $21,519
- Est. tax owed @ 24.0%
- −$5,165
- After-tax cash flow
- $16,984/yr
For passive investors: Depreciation is non-cash, so a rental often shows a tax loss while cash-flowing — sheltering income. Rental losses are passive: they offset passive income freely, and up to $25,000/yr can offset ordinary (W-2) income if you actively participate and your MAGI is under $100k (phasing out to $0 by $150k); unused losses carry forward. On sale, claimed depreciation is recaptured at up to 25%, and gains may owe capital-gains tax (a 1031 exchange can defer both). Figures are a year-1 estimate at your 24.0% rate — not tax advice; consult a CPA.
Schools (NCES district)
- District
- Tamalpais Union High
- NCES district ID
- 0638790
- Math proficiency
- 62% ▲ 4.00%
- Reading proficiency
- 78% ▲ 6.00%
- Median HH income
- $106,037
- Composite
- 64.66/100
- National rank
- #527
- State rank
- #42 of 517 in CA
Livability — Larkspur
- Score
- 86/100
- State rank
- #5
- US rank
- #381
Category grades
Schools grade is shown separately in the Schools card above.
Census & demographics
- Census place
- Larkspur, CA
- County
- Marin County · 243,328 people
- City population
- 7,315
- Metro
- San Francisco-Oakland-Berkeley, CA
- Population (ZIP)
- 12,815
- Household income
- $169,118
- Rent vs Own
- Severe rent burden
- 713.0
Population outlook (Marin County) Hauer SSP2
- Today (2025)
- 276,379 people
- By 2030
- 282,942 · +2.4%
- By 2040
- 292,937 · +6.0%
- By 2050
- 300,449 · +8.7%
- By 2075
- 316,946 · +14.7%
- By 2100
- 303,948 · +10.0%
Race, ethnicity, and origin ACS 2023
- Neighborhood character
- Predominantly White (73%)
- Race & ethnicity
- White 73% Hispanic / Latino 13% Two or more races 8% Asian 7%
- Hispanic origin (detail)
- Mexican 6%
- Common ancestry
- Italian 4% Romanian 3% Lithuanian 3%
- Foreign-born
- 17% · Canada, South Korea, China
- Languages at home
- 78% English-only · Spanish 10% Other Indo-European 4% German/W. Germanic 2%
Political lean MEDSL · Marin
- 2024 margin
- Solid D (+63.9) · D 80.6% · R 16.7% · Other 2.7%
- 2008→2024 swing
- +6.2pp toward D · 2008: 57.7pp · 2024: 63.9pp
- All cycles
- 2024: D+63.9 2020: D+66.5 2016: D+62.9 2012: D+50.5 2008: D+57.7
Not yet ingested
- Civics
- —
Market trends
- HPI YoY
- ▲ 5.43%
- Current HPI
- 282.1489
- Rent YoY
- ▲ 3.52%
- Metro
- San Francisco-Oakland-Berkeley, CA
- State GDP YoY
- ▲ 3.21%
- F500 in state
- 116
Industry mix (Fortune 500 HQ in CA)
| Industry | F500 HQs | Revenue |
|---|---|---|
| Technology | 27 | $1,492B |
|
||
| Financial Services | 3 | $174B |
|
||
| Retail | 3 | $44B |
|
||
| Insurance | 3 | $26B |
|
||
| Media / Entertainment | 2 | $115B |
|
||
| Pharmaceuticals / Biotech | 2 | $62B |
|
||
Price history
-4.0% since first listed13 events — show timeline
- 2026-04-23 Relisted — BAREIS
- 2026-04-23 Price Changed $120,000 BAREIS
- 2025-06-24 Listed $129,000 BAREIS
- 2024-06-08 Price Changed $139,500 BAREIS
- 2024-02-26 Listed $149,500 BAREIS
- 2022-02-26 Listed $159,500 BAREIS
- 2019-09-06 Sold (MLS) $113,500 BAREIS
- 2019-09-01 Pending — BAREIS
- 2019-08-20 Contingent — BAREIS
- 2019-08-13 Relisted — BAREIS
- 2019-08-13 Price Changed $117,500 BAREIS
- 2019-08-07 Delisted — BAREIS
- 2019-05-08 Listed $125,000 BAREIS
Cash-flow waterfall
monthlySold comps — $/sqft
last 12 mo · ≤1 miLoading sold comps…