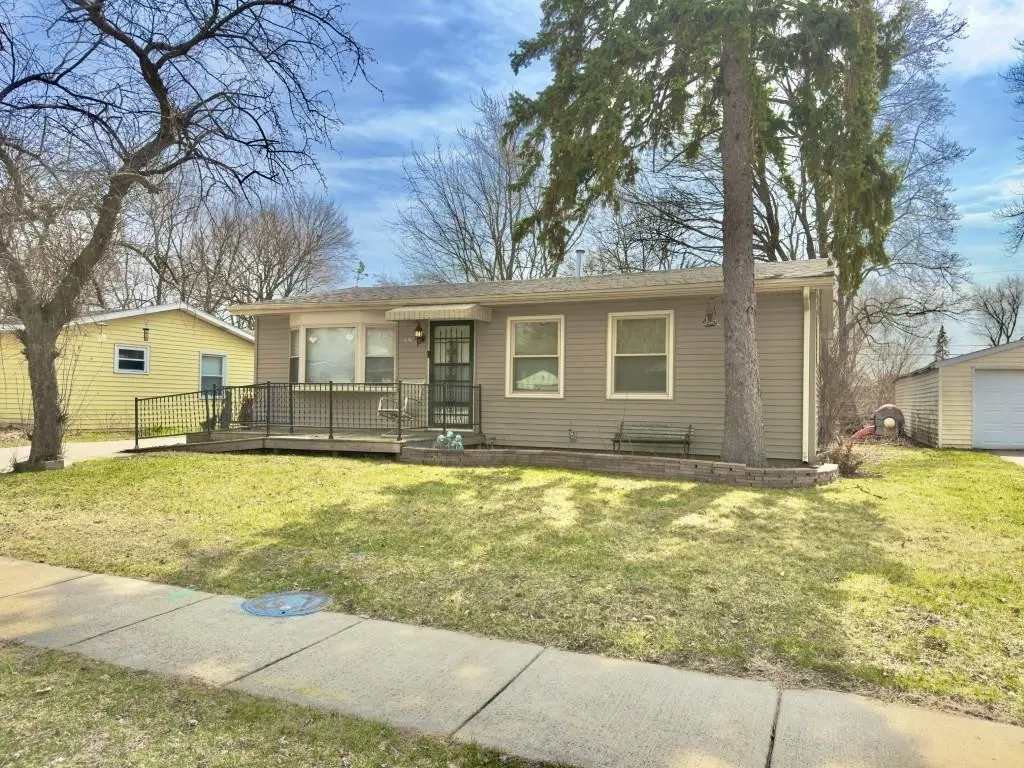
1021 Drexel Blvd · Machesney Park, IL
Flood risk 7/10 · Major
- FEMA flood zone
- X (unshaded)
- Chance of flooding over 30 yrs
- 0.76%
- Est. flood insurance / yr
- $507 – $1,088
Fire risk 1/10 · Minimal
- Est. fire insurance / yr
- $804 – $1,492
Heat risk 2/10 · Minimal
- Hot days now (above 102°F)
- 7 days/yr
- Hot days in 30 yrs
- 15 days/yr
Wind risk 2/10 · Minimal
- Chance of severe wind over 30 yrs
- —
Air-quality risk 3/10 · Minor
- Unhealthy air days now
- 2 days/yr
- Unhealthy air days in 30 yrs
- 3 days/yr
Risk factors via First Street. Map © Google.
Why this score? — see what drove the B+ grade
The composite is a weighted blend of 9 inputs, each scored 0–100. Each bar is that input's sub-score; the figure is the points it added to the 100-point composite (weight × sub-score).
- Cash flow +30.0/30.0
- ARV discount +15.0/15.0
- DSCR +10.0/10.0
- 1% rule +9.8/10.0
- Livability +3.7/5.0
- Rent growth +2.5/5.0
- Condition / age +2.5/5.0
- Schools +1.8/10.0
- Appreciation +0.0/10.0
$119,900
🖨 Deal sheet 📄 Offer letter ✓ Due diligence
Listing remarks
Great investment opportunity! Previously a 4 bedroom turned into 3 bedrooms with 2 full baths. Relax in the living room with the large bay windows or hang out in the family room leading to the enclosed porch. Porch connects to a large 1 car garage with additional storage. Additional garden shed in the rear. Great opportunity to bring your ideas to life! Being sold As-Is. Will need some TLC.
Key facts
- Large bay windows
- Large garage
- Enclosed porch
Tags
Property features AI
Exterior
- Parking: Attached 1-car garage
- Utilities: Public water service; Public sewer
- Home design: Single family residence (house); Residential property
- Exterior features: Shingle roof; Public water; Public sewer
Interior
- Kitchen: Gas cooktop; Refrigerator
- Bathrooms: Two full bathrooms (both on the main level)
- Heating & cooling: Forced air heating; Natural gas
- Interior features: Gas cooktop; Refrigerator; Gas water heater; Forced air heating (natural gas)
Neighborhood map
What this means for you Summary
Snapshot
- This is a 3-bed/2.0-bath single-family listed at $120k.
Deal economics
- At list price, monthly cash flow is $431 ($5k/yr) — positive.
- The deal already cash-flows at list — no discount required.
- Meets the 1% rule at list price ($2k rent vs $120k).
- Cap rate 11.3% vs local median 4.9% in Machesney Park — top-decile yield for the area; either an underpriced asset or a hidden risk that comps aren't pricing in. Stress-test before assuming the spread holds.
Location & tenants
- Location reads 74/100 on livability (#244 in IL, #4,425 nationally) — a middle-class / working-renter tenant base. Strengths: cost of living A+, housing A+, health & safety A+; Watch: amenities D+, commute F.
- Harlem UD 122 (suburban): math 17% / reading 23% proficiency, ranked #418 of 620 in IL (top 67%) — low school quality limits family demand, transient renter base, plan for 1-2y turnover.
- Zoned schools: Windsor Elem School (math 13% / reading 20%, grade F, #1,224 of 2,056 statewide, top 60%, 365 students, 0% FRL); Harlem High School (math 18% / reading 23%, grade F, #350 of 693 statewide, top 51%, 1,875 students, 0% FRL) — zoned schools average 0% FRL vs 45% district-wide (45 pts lower); this property's tenant base skews higher-income than the district average.
- Market conditions: 94 active listings in the ZIP; 285 units permitted in Winnebago County in 2024 (0 in 5+ unit buildings).
Forward outlook
- Local home prices are declining (-3.0%/yr); year-one equity from $829 of loan paydown is wiped out by about $4k of value loss. Plan a longer hold.
- Winnebago County population projected at -20% by 2050 — secular population decline; favor cash flow + early exit over multi-decade hold.
- At projected returns (-3.0% appreciation + 3.0% rent growth), your $34k cash investment doubles in ~8 years — after that, you're playing with house money.
Negotiation context
- Only 5 days on market — expect competitive offers; lowballing is unlikely to land.
Risks & watch-outs
- Watch-outs: flood insurance adds $66/mo; built in 1959 — expect roof / HVAC / electrical / plumbing capex.
- Climate carrying-cost: major flood risk — expect insurance premiums to compound above CPI over the hold.
Questions for the listing agent
- Built in 1959 — when were the roof, HVAC, electrical panel, plumbing, and water heater last replaced?
- What's the actual annual flood-insurance premium (NFIP or private), and is the property in a SFHA with mandatory coverage?
- Is there a deadline driving the sale (1031 exchange, divorce, estate, relocation)? That informs how much negotiation room exists.
- Schools are F-rated, which usually means shorter tenancies and higher turnover. Who's the typical renter profile here, and what's been the actual vacancy rate?
- What's the average days-on-market for RENTAL listings here right now (not sales)? A rising rental-DOM trend means longer vacancies and softer asking-rent achievability than the comps imply.
- What's the recent tenant-quality profile in this submarket — average credit score on applications, eviction rate, late-payment / NSF rate, and stable-employment percentage? A property-management company in the area should have these aggregated.
- How much new for-sale + rental construction is in the pipeline within 1–3 miles? Heavy new supply typically softens prices + rents 12–24 months out; constrained supply supports both.
Investment metrics
- 1% rule
- 1.48% ✓
- Cap rate
- 11.27%
- Cash-on-cash
- 17.78%
- DSCR
- 1.79
- GRM
- 5.6
CMA / ARV
- ARV (on-the-fly)
- $175,360
- Comps found
- 12
Show comp detail 12 sales within ~0.75 mi
| Address | Dist | Beds/Ba | Sqft | Sold | Price | $/sf | Match |
|---|---|---|---|---|---|---|---|
| 810 Pettit Ct | 0.30mi | 3/1.0 | 1,312 (+2%) | 5mo | $180,000 | $137 | 74 |
| 632 Drexel Blvd | 0.39mi | 3/1.0 | 1,295 (+1%) | 8mo | $175,000 | $135 | 69 |
| 7643 Rogers St | 0.56mi | 3/1.0 | 1,281 (+0%) | 2mo | $195,815 | $153 | 68 |
| 6320 Walker Ave | 0.54mi | 3/2.0 | 1,245 (-3%) | 8mo | $170,000 | $137 | 64 |
| 744 Drexel Blvd | 0.28mi | 4/2.0 (+1) | 1,400 (+9%) | 4mo | $170,000 | $121 | 63 |
| 7418 Orion St | 0.68mi | 3/1.5 | 1,304 (+2%) | 1mo | $200,000 | $153 | 63 |
| 630 Windsor Rd | 0.50mi | 3/1.0 | 1,245 (-3%) | 7mo | $149,000 | $120 | 62 |
| 815 Kingsley Dr | 0.24mi | 4/1.0 (+1) | 1,125 (-12%) | 4mo | $165,000 | $147 | 56 |
| 7637 Rogers St | 0.54mi | 3/2.5 | 1,143 (-11%) | 2mo | $205,000 | $179 | 53 |
| 1321 E Renrose Ave | 0.70mi | 2/2.0 (-1) | 1,190 (-7%) | 5mo | $165,000 | $139 | 47 |
| 7713 Mildred Rd | 0.64mi | 4/1.0 (+1) | 1,428 (+12%) | 7mo | $76,000 | $53 | 36 |
| 7913 Mildred Rd | 0.74mi | 4/1.0 (+1) | 1,128 (-12%) | 6mo | $134,000 | $119 | 32 |
Match score weights: distance 35% · size 25% · config 20% · recency 20%. Top-matched comps best support the ARV.
Projected returns pro-forma
-3.0% appreciation · 3.0% rent growth · sell at horizon
- IRR
- 6.2%
- Equity multiple
- 1.24×
- Total profit
- $8,126
- Equity at exit
- $17,877
- IRR
- 15.6%
- Equity multiple
- 2.28×
- Total profit
- $42,875
- Equity at exit
- $10,367
Cash invested: $33,572 (down + closing). Projections, not guarantees.
Landlord ↔ Tenant lean methodology
- Overall (STATE)
- 43 Moderately Tenant-Leaning
- State Illinois
- 43 Moderately Tenant-Leaning · D+7
- County
- — inherits STATE
- City
- — inherits STATE
ZIP-level market 61115
- Home prices YoY
- -34.6%
- Active inventory
- 94
- Price-to-rent
- 5.6×
Monthly cashflow live
- Estimated rent
- $1,775 medium interval (Pro) →
- Mortgage (P&I)
- −$629
- Tax from tax record
- −$227 /mo · $2,719/yr
- Insurance
- −$50
- Flood insurance flood zone
- −$66 /mo · $798/yr
- HOA
- −$0
- Vacancy / Maint / Mgmt
- −$373
- Net cashflow
- $431
Break-even live
UW: 25.0% down · 7.5% · 30yr · 1.5% tax · 5.0% vac · 8.0% maint · 8.0% mgmt
Financing live
Cash to close
- Down payment
- $29,975
- Closing costs
- $3,597
- Reserves months
- —
- Total cash needed
- —
Loan-product check · same deal, 3 products live
Conventional
25% down · 7.5% · 30yr
- Down + closing
- —
- Monthly P&I
- —
- Monthly cashflow
- —
- DSCR
- —
- Eligible?
- —
Personal DTI + credit; lowest rate.
DSCR
20% down · 8.5% · 30yr
- Down + closing
- —
- Monthly P&I
- —
- Monthly cashflow
- —
- DSCR
- —
- Eligible?
- —
No personal income docs; deal must DSCR.
Hard money
10% down · 12.0% · 12mo
- Down + closing
- —
- Monthly P&I
- —
- Monthly cashflow
- —
- DSCR
- —
- Eligible?
- —
Short-term bridge; refi at stabilization.
Listing history 2 events
-
2026-05-20status Pending
-
2026-05-15$119,900 Active
ⓘ Source: listings_history table (triggers on properties + properties_extension) + one-shot
backfill from property_details.listing_events for pre-trigger history.
Tax reassessment forecast IL · Partial reset (capped growth)
- Current annual tax
- $2,719 · $227/mo
- Projected year-2 tax
- $2,720 · $227/mo
- Expected delta
- +$1/yr ($0/mo · 0.0%)
ⓘ Screening estimate from a state-policy table — verify with the county assessor before closing.
Climate risk First Street
- Flood 7/10 Severe FEMA zone X (unshaded) · 76% chance over 30 yrs
- Wildfire 1/10 Low
- Heat 2/10 Low 7 d/yr ≥102°F today · 15 d/yr by 30 yrs out
- Wind 2/10 Low
- Air quality 3/10 Moderate 2 unhealthy d/yr today · 3 by 30 yrs out
Nearby sold comps map
Loading sold comps map…
Walkable amenities ~0.75 mi
Loading nearby amenities…
Taxation est. · year 1
- Rental income
- $21,306
- − Mortgage interest
- −$6,716
- − Property taxes
- −$2,719
- − Insurance
- −$1,397
- − Repairs & maintenance
- −$1,704
- − Management
- −$1,704
- − Depreciation
- −$3,488
- Taxable income
- $3,576
- Est. tax owed @ 24.0%
- −$858
- After-tax cash flow
- $4,312/yr
For passive investors: Depreciation is non-cash, so a rental often shows a tax loss while cash-flowing — sheltering income. Rental losses are passive: they offset passive income freely, and up to $25,000/yr can offset ordinary (W-2) income if you actively participate and your MAGI is under $100k (phasing out to $0 by $150k); unused losses carry forward. On sale, claimed depreciation is recaptured at up to 25%, and gains may owe capital-gains tax (a 1031 exchange can defer both). Figures are a year-1 estimate at your 24.0% rate — not tax advice; consult a CPA.
Schools (NCES district)
- District
- Harlem UD 122
- NCES district ID
- 1718240
- Math proficiency
- 17% ▼ -8.00%
- Reading proficiency
- 23% ▼ -7.00%
- Median HH income
- $51,228
- Composite
- 18.01/100
- National rank
- #8982
- State rank
- #418 of 620 in IL
Livability — Machesney Park
- Score
- 74/100
- State rank
- #244
- US rank
- #4425
Category grades
Schools grade is shown separately in the Schools card above.
Census & demographics
- Census place
- Machesney Park, IL
- City population
- 22,424
- Population (ZIP)
- 22,424
Population outlook (Winnebago County) Hauer SSP2
- Today (2025)
- 271,080 people
- By 2030
- 260,684 · -3.8%
- By 2040
- 238,405 · -12.1%
- By 2050
- 216,129 · -20.3%
- By 2075
- 172,882 · -36.2%
- By 2100
- 135,336 · -50.1%
Race, ethnicity, and origin ACS 2023
- Neighborhood character
- Predominantly White (80%)
- Race & ethnicity
- White 80% Hispanic / Latino 11% Two or more races 7% Black 2% Asian 2%
- Hispanic origin (detail)
- Mexican 8% Puerto Rican 1%
- Common ancestry
- Romanian 2% Italian 2% Portuguese 2%
- Foreign-born
- 5% · Canada
- Languages at home
- 93% English-only · Spanish 4% Other Indo-European 1% Russian/Polish/Slavic 1%
Political lean MEDSL · Winnebago
- 2024 margin
- Toss-up / Even · D 49.5% · R 49.0% · Other 1.5%
- 2008→2024 swing
- -12.2pp toward R · 2008: 12.8pp · 2024: 0.6pp
- All cycles
- 2024: D+0.6 2020: D+2.5 2016: R+1.2 2012: D+5.7 2008: D+12.8
Not yet ingested
- Civics
- —
Market trends
- HPI YoY
- ▼ -144.28%
- Current HPI
- 272.5522
- Rent YoY
- —
- Metro
- —
- State GDP YoY
- ▲ 1.59%
- F500 in state
- 60
Industry mix (Fortune 500 HQ in IL)
| Industry | F500 HQs | Revenue |
|---|---|---|
| Insurance | 4 | $201B |
|
||
| Consumer Goods | 4 | $87B |
|
||
| Industrial Machinery | 3 | $64B |
|
||
| Healthcare | 2 | $55B |
|
||
| Retail / Pharmacy | 1 | $148B |
|
||
| Agriculture / Food | 1 | $86B |
|
||
Price history
2 events — show timeline
- 2026-05-20 Pending — NWIAR
- 2026-05-15 Listed $119,900 NWIAR
Property tax history
+2.5%/yrLatest (2024): $2,719 · +8.3% YoY. Source: county tax records.
Cash-flow waterfall
monthlySold comps — $/sqft
last 12 mo · ≤1 miLoading sold comps…