5 Oakdale Mnr Unit B14 · Suffern, NY
Flood risk 1/10 · Minimal
- FEMA flood zone
- X (unshaded)
- Chance of flooding over 30 yrs
- 0.0%
- Est. flood insurance / yr
- $507 – $1,088
Fire risk 4/10 · Minor
- Est. fire insurance / yr
- $691 – $1,283
Heat risk 6/10 · Moderate
- Hot days now (above 98°F)
- 7 days/yr
- Hot days in 30 yrs
- 15 days/yr
Wind risk 4/10 · Minor
- Chance of severe wind over 30 yrs
- 23.0%
Air-quality risk 3/10 · Minor
- Unhealthy air days now
- 2 days/yr
- Unhealthy air days in 30 yrs
- 4 days/yr
Risk factors via First Street. Map © Google.
Why this score? — see what drove the C- grade
The composite is a weighted blend of 9 inputs, each scored 0–100. Each bar is that input's sub-score; the figure is the points it added to the 100-point composite (weight × sub-score).
- Cash flow +16.5/30.0
- 1% rule +10.0/10.0
- DSCR +5.1/10.0
- Schools +5.1/10.0
- ARV discount +4.6/15.0
- Condition / age +3.8/5.0
- Livability +3.4/5.0
- Rent growth +2.5/5.0
- Appreciation +0.0/10.0
$129,000
🖨 Deal sheet (PDF) 📄 Offer letter ✓ Due diligence
Listing remarks MLS
Priced to sell, the sought after Oakdale Manor comes with a parking spot and the most affordable community in all of Rockland county that still offers a good quality of life. Please text or email.
Key facts
- Built 1970
- Listed 112 days
Neighborhood map
What this means for you Summary
Snapshot
- This is a 1-bed/1.0-bath condo listed at $129k. Condition is rated good.
Deal economics
- At list price, monthly cash flow is $75 ($897/yr) — positive.
- The deal already cash-flows at list — no discount required.
- Meets the 1% rule at list price ($3k rent vs $129k).
- Recommended offer: $117k (9.0% below list) — sets the bar for market timing.
- Cap rate 7.0% vs local median 3.2% in Suffern — top-decile yield for the area; either an underpriced asset or a hidden risk that comps aren't pricing in. Stress-test before assuming the spread holds.
Location & tenants
- Location reads 68/100 on livability (#546 in NY) — a middle-class / working-renter tenant base. Strengths: employment A+, housing A+; Watch: amenities F, commute F, cost of living F.
- Suffern Central School District (suburban): math 53% / reading 59% proficiency, ranked #242 of 590 in NY (top 41%) — acceptable for families but not a draw, mixed tenant base, ~2y average lease; only 18% free/reduced lunch — higher-income household profile.
- Zoned schools: Richard P Connor Elementary School (math 42% / reading 62%, grade C-, #988 of 2,108 statewide, top 49%, 383 students, 0% FRL); Suffern Middle School (math 30% / reading 56%, grade D-, #370 of 729 statewide, top 51%, 836 students, 38% FRL); Suffern Senior High School (math 96% / reading 95%, grade A+, #76 of 1,100 statewide, top 7%, 1,486 students, 31% FRL).
- Market conditions: 230 active listings in the ZIP; 16 comparable units currently listed for rent nearby; rentals at typical pace (median 20d on market — plan ~3-4 weeks tenant-placement turnaround); solid renter incomes; 429 units permitted in Rockland County in 2024 (231 in 5+ unit buildings).
- This rent runs 31% of the median local income ($108k/yr) — at the standard rent-burdened threshold; future hikes will face affordability resistance.
Forward outlook
- Local home prices are declining (-3.0%/yr); year-one equity from $892 of loan paydown is wiped out by about $4k of value loss. Plan a longer hold.
- Rockland County population projected at +7% by 2050 — modest demand growth; plan on rents tracking national, not racing it.
Negotiation context
- It's been on market 112 days — a 9% lower offer ($117k) is reasonable based on typical stale-listing flexibility.
- 4 sale attempts since 6y ago with the ask held roughly flat each time — persistent listings suggest the price (not the market) is what's stuck; bring a comps-based counter.
- Current owner paid $88k; 47% above their basis — modest negotiation headroom, anchor on the comps not their cost.
Risks & watch-outs
- Watch-outs: HOA is 44% of rent.
- Climate carrying-cost: extreme-heat days projected 7→15/yr by 2055 (HVAC capex compounding) — expect insurance premiums to compound above CPI over the hold.
Questions for the listing agent
- It's been on market 112 days. Have you received any prior offers? Is the seller open to a 9% concession, seller financing, or rate buy-down credit?
- Built in 1970 — when were the roof, HVAC, electrical panel, plumbing, and water heater last replaced?
- What does the HOA fee cover, when was the last increase, and are there any pending special assessments or reserve-fund shortfalls?
- Any open or pending special assessments — roof, HVAC, plumbing, elevator, façade? What's the per-unit balance and payoff schedule, and is the seller paying it off at close or rolling it to the buyer?
- Why hasn't it sold? Are there any deal-killer items the seller is aware of (foundation, flood, title, zoning, code violations)?
- Is there a deadline driving the sale (1031 exchange, divorce, estate, relocation)? That informs how much negotiation room exists.
- Schools are B-rated — typically a magnet for longer-tenancy family renters. What's the average tenant stay here, and is there a school-zone premium baked into asking?
- What's the average days-on-market for RENTAL listings here right now (not sales)? A rising rental-DOM trend means longer vacancies and softer asking-rent achievability than the comps imply.
- What's the recent tenant-quality profile in this submarket — average credit score on applications, eviction rate, late-payment / NSF rate, and stable-employment percentage? A property-management company in the area should have these aggregated.
- How much new apartment / multifamily construction is in the pipeline within 1–3 miles? Heavy new supply (>2% of stock underway) typically softens rents 12–24 months out; light construction supports rent growth.
Investment metrics
- 1% rule
- 2.17% ✓
- Cap rate
- 6.99%
- Cash-on-cash
- 2.48%
- DSCR
- 1.11
- GRM
- 3.8
CMA / ARV
- ARV (median comp)
- $121,093
- List price
- $129,000
- Delta
- 6.53%
- Verdict
- FAIR
- Comps
- 20 within 1.0 mi
Projected returns pro-forma
-3.0% appreciation · 3.0% rent growth · sell at horizon
- IRR
- -11.6%
- Equity multiple
- 0.58×
- Total profit
- $-15,334
- Equity at exit
- $19,234
- IRR
- -1.6%
- Equity multiple
- 0.89×
- Total profit
- $-3,940
- Equity at exit
- $11,154
Cash invested: $36,120 (down + closing). Projections, not guarantees.
Landlord ↔ Tenant lean methodology
- Overall (STATE)
- 15 Strongly Tenant-Friendly
- State New York
- 15 Strongly Tenant-Friendly · D+10
- County
- — inherits STATE
- City
- — inherits STATE
ZIP-level market 10901
- Active inventory
- 230
- Price-to-rent
- 3.8×
Monthly cashflow live
- Estimated rent
- $2,799 high interval (Pro) →
- Mortgage (P&I)
- −$676
- Tax est. 1.5%
- −$161 /mo · $1,935/yr
- Insurance
- −$54
- HOA est. from 5 same-building comps
- −$1,245
- Vacancy / Maint / Mgmt
- −$588
- Net cashflow
- $75
Break-even live
Sensitivity live
| Price | -10% $164 | -5% $119 | +0% $75 | +5% $30 | +10% $-14 |
|---|---|---|---|---|---|
| Rent | -10% $-146 | -5% $-36 | +0% $75 | +5% $185 | +10% $296 |
| Rate | -1.0pp $140 | -0.5pp $108 | base $75 | +0.5pp $41 | +1.0pp $7 |
UW: 25.0% down · 7.5% · 30yr · 1.5% tax · 5.0% vac · 8.0% maint · 8.0% mgmt
Financing live
Cash to close
- Down payment
- $32,250
- Closing costs
- $3,870
- Reserves months
- —
- Total cash needed
- —
Loan-product check · same deal, 3 products live
Conventional
25% down · 7.5% · 30yr
- Down + closing
- —
- Monthly P&I
- —
- Monthly cashflow
- —
- DSCR
- —
- Eligible?
- —
Personal DTI + credit; lowest rate.
DSCR
20% down · 8.5% · 30yr
- Down + closing
- —
- Monthly P&I
- —
- Monthly cashflow
- —
- DSCR
- —
- Eligible?
- —
No personal income docs; deal must DSCR.
Hard money
10% down · 12.0% · 12mo
- Down + closing
- —
- Monthly P&I
- —
- Monthly cashflow
- —
- DSCR
- —
- Eligible?
- —
Short-term bridge; refi at stabilization.
Rent comps 16 comps
| Address | Beds | Baths | Sqft | Rent | $/sqft | DOM | Units | Dist |
|---|---|---|---|---|---|---|---|---|
| 15 Washington Ave Unit 304 Suffern, NY | 2.0 | 2.0 | 1001 | $3,400 | $3.40 | 22d | 1 | 0.36mi |
| 15 Washington Ave Unit 414 Suffern, NY | 1.0 | 1.0 | 687 | $2,700 | $3.93 | 9d | 1 | 0.38mi |
| 15 Washington Ave Suffern, NY | 1.0–2.0 | 1.0–2.0 | 848 | $2,400 | $2.83 | 3d | 4 | 0.39mi |
| 15 Washington Ave Unit 310 Suffern, NY | 2.0 | 2.0 | 1009 | $3,450 | $3.42 | 26d | 1 | 0.39mi |
| 15 Washington Ave Unit 407 Suffern, NY | 1.0 | 1.0 | 974 | $3,200 | $3.29 | 26d | 1 | 0.39mi |
| 15 Washington Ave Unit 316 Suffern, NY | 1.0 | 1.0 | 735 | $2,850 | $3.88 | 26d | 1 | 0.39mi |
| 15 Washington Ave Unit 110 Suffern, NY | 2.0 | 2.0 | 1009 | $3,400 | $3.37 | 3d | 1 | 0.39mi |
| 10 Chestnut St Unit A106 Suffern, NY | 2.0 | 1.5 | 889 | $2,850 | $3.21 | 0d | 1 | 0.41mi |
| 35 Park Ave Unit 6T Suffern, NY | 1.0 | 1.0 | 865 | $2,450 | $2.83 | 20d | 1 | 0.43mi |
| 92 Blauvelt Way Suffern, NY | 1.0–2.0 | 1.0–2.0 | 867 | $2,763 | $3.19 | 0d | 3 | 0.49mi |
| 6 Pavilion Rd Suffern, NY | 2.0 | 1.5 | 1000 | $2,950 | $2.95 | 0d | 1 | 0.51mi |
| 16 Pavilion Ridge Way Unit 7 Suffern, NY | 1.0 | 1.0 | 860 | $2,350 | $2.73 | 26d | 1 | 0.57mi |
| 5 Wayne Ave Suffern, NY | 2.0 | 1.0 | 916 | $2,400 | $2.62 | 0d | 1 | 0.58mi |
| 276 Parkside Dr Suffern, NY | 2.0 | 2.0 | 1095 | $2,800 | $2.56 | 45d | 1 | 0.87mi |
| 27 Bon Aire Cir Unit 8301 Suffern, NY | 2.0 | 1.5 | 860 | $2,450 | $2.85 | 20d | 1 | 0.96mi |
| 15 Lake Ave Unit B Hillburn, NY | 2.0 | 1.0 | 880 | $2,400 | $2.73 | 0d | 1 | 1.36mi |
HOA detail condo
- Monthly dues
- $0 · $0/yr
- Assessments
- None detected in remarks — confirm with the listing agent.
Listing history 18 events
-
2026-06-21days on market $129,000 Active 112 DOM
-
2026-06-18days on market $129,000 Active 109 DOM
-
2026-06-17days on market $129,000 Active 108 DOM
-
2026-06-16days on market $129,000 Active 107 DOM
-
2026-06-15days on market $129,000 Active 106 DOM
-
2026-06-13days on market $129,000 Active 104 DOM
-
2026-06-09status $129,000 Active 100 DOM
-
2026-05-07status Pending 196-char remark
Show marketing remark (196 chars)
Priced to sell, the sought after Oakdale Manor comes with a parking spot and the most affordable community in all of Rockland county that still offers a good quality of life. Please text or email.
-
2026-04-24price $129,000 196-char remark
Show marketing remark (196 chars)
Priced to sell, the sought after Oakdale Manor comes with a parking spot and the most affordable community in all of Rockland county that still offers a good quality of life. Please text or email.
-
2026-04-17price $126,000 196-char remark
Show marketing remark (196 chars)
Priced to sell, the sought after Oakdale Manor comes with a parking spot and the most affordable community in all of Rockland county that still offers a good quality of life. Please text or email.
-
2026-01-26$129,000 Active 196-char remark
Show marketing remark (196 chars)
Priced to sell, the sought after Oakdale Manor comes with a parking spot and the most affordable community in all of Rockland county that still offers a good quality of life. Please text or email.
-
2023-05-30$118,000 Active
-
2021-06-28soldstatus $88,000 Closed
-
2021-03-15status Pending
-
2021-02-25price $92,500
-
2021-02-25status Active
-
2021-02-22historical
-
2020-12-02$97,500 Active
ⓘ Source: listings_history table (triggers on properties + properties_extension) + one-shot
backfill from property_details.listing_events for pre-trigger history.
Climate risk First Street
- Flood 1/10 Low FEMA zone X (unshaded) · 0% chance over 30 yrs
- Wildfire 4/10 Moderate
- Heat 6/10 Major 7 d/yr ≥98°F today · 15 d/yr by 30 yrs out
- Wind 4/10 Moderate 23% chance of damaging wind over 30 yrs
- Air quality 3/10 Moderate 2 unhealthy d/yr today · 4 by 30 yrs out
Nearby sold comps map
Loading sold comps map…
Walkable amenities ~0.75 mi
Loading nearby amenities…
Taxation est. · year 1
- Rental income
- $33,589
- − Mortgage interest
- −$7,226
- − Property taxes
- −$1,935
- − Insurance
- −$645
- − Repairs & maintenance
- −$2,687
- − Management
- −$2,687
- − HOA
- −$14,940
- − Depreciation
- −$3,753
- Taxable loss
- −$284
- Est. tax savings @ 24.0%
- +$68
- After-tax cash flow
- $965/yr
For passive investors: Depreciation is non-cash, so a rental often shows a tax loss while cash-flowing — sheltering income. Rental losses are passive: they offset passive income freely, and up to $25,000/yr can offset ordinary (W-2) income if you actively participate and your MAGI is under $100k (phasing out to $0 by $150k); unused losses carry forward. On sale, claimed depreciation is recaptured at up to 25%, and gains may owe capital-gains tax (a 1031 exchange can defer both). Figures are a year-1 estimate at your 24.0% rate — not tax advice; consult a CPA.
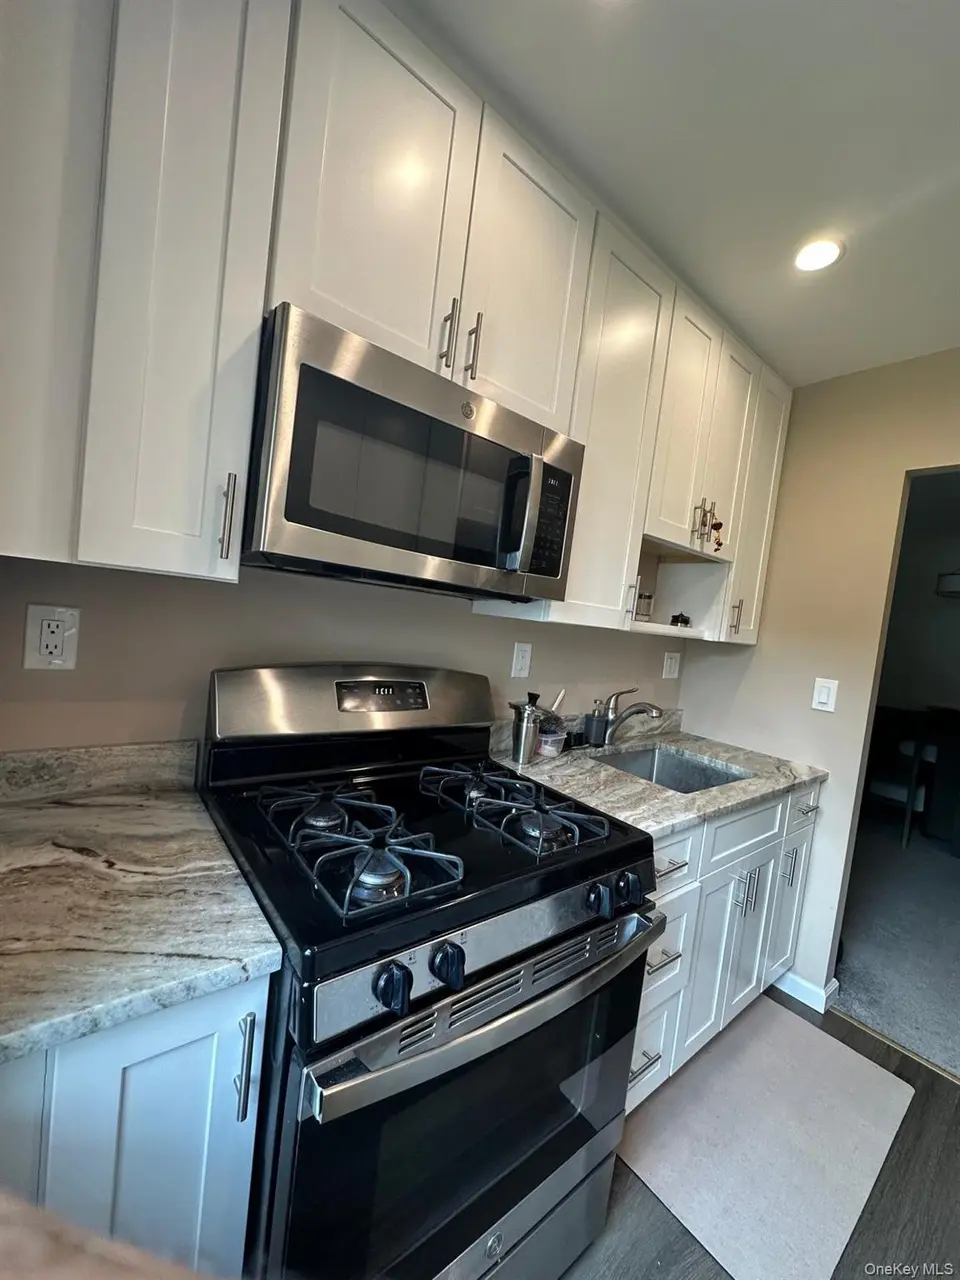
Condition & rehab AI · 6 photos
This condo is in good condition with a fresh paint job and well-maintained interior. It offers a good quality of life and is priced to sell, making it an attractive investment opportunity.
Value-add opportunities
- Both Painting interior walls — Fresh paint enhances curb appeal and interior aesthetics.
- Both Landscaping and curb appeal improvements — Enhances property's visual appeal and can attract more buyers/renters.
- Both HVAC maintenance or upgrade — Ensures comfort and energy efficiency, which is important for both resale and rental value.
- Both Kitchen and bathroom updates — Modernizing these spaces can significantly increase the property's value and attract more buyers/renters.
- Both Landscaping and curb appeal improvements — Enhances property's visual appeal and can attract more buyers/renters.
Renovation cost estimate screening
Value-add ROI direction
- Both Painting interior walls — Fresh paint enhances curb appeal and interior aesthetics. ↑
- Both Landscaping and curb appeal improvements — Enhances property's visual appeal and can attract more buyers/renters. ↑
- Both HVAC maintenance or upgrade — Ensures comfort and energy efficiency, which is important for both resale and rental value. ↑
- Both Kitchen and bathroom updates — Modernizing these spaces can significantly increase the property's value and attract more buyers/renters. ↑
- Both Landscaping and curb appeal improvements — Enhances property's visual appeal and can attract more buyers/renters. ↑
ⓘ Cost ranges are severity-bucket heuristics (US national rule-of-thumb). Get contractor quotes + a written scope before underwriting a rehab budget.
Schools (NCES district)
- District
- Suffern Central School District
- NCES district ID
- 3628320
- Math proficiency
- 53% ▼ -17.00%
- Reading proficiency
- 59% ▼ -4.00%
- Median HH income
- $85,871
- Composite
- 51.17/100
- National rank
- #1758
- State rank
- #242 of 590 in NY
Livability — Suffern
- Score
- 68/100
- State rank
- #546
- US rank
- #9788
Category grades
Schools grade is shown separately in the Schools card above.
Census & demographics
- Census place
- Suffern, NY
- County
- Rockland County · 98,828 people
- Metro
- New York-Newark-Jersey City, NY-NJ-PA
- Population (ZIP)
- 27,095
- Household income
- $108,041
- Rent vs Own
- Severe rent burden
- 828.0
Population outlook (Rockland County) Hauer SSP2
- Today (2025)
- 339,642 people
- By 2030
- 345,987 · +1.9%
- By 2040
- 357,178 · +5.2%
- By 2050
- 362,456 · +6.7%
- By 2075
- 367,281 · +8.1%
- By 2100
- 328,211 · -3.4%
Race, ethnicity, and origin ACS 2023
- Neighborhood character
- Predominantly White (69%)
- Race & ethnicity
- White 69% Hispanic / Latino 13% Black 10% Two or more races 6% Asian 5%
- Hispanic origin (detail)
- Mexican 5% Puerto Rican 3% Dominican 2%
- Common ancestry
- Romanian 8% Scotch-Irish 4% Hispanic 4%
- Foreign-born
- 18% · Canada, China, South Korea
- Languages at home
- 69% English-only · Spanish 10% German/W. Germanic 5% French/Haitian/Cajun 3%
Political lean MEDSL · Rockland
- 2024 margin
- R (+11.8) · D 44.1% · R 55.9%
- 2008→2024 swing
- -17.7pp toward R · 2008: 5.9pp · 2024: -11.8pp
- All cycles
- 2024: R+11.8 2020: D+1.7 2016: D+5.1 2012: D+6.6 2008: D+5.9
Not yet ingested
- Civics
- —
Market trends
- HPI YoY
- ▼ -582.29%
- Current HPI
- 282.4798
- Rent YoY
- —
- Metro
- New York-Newark-Jersey City, NY-NJ-PA
- State GDP YoY
- ▲ 2.60%
- F500 in state
- 92
Industry mix (Fortune 500 HQ in NY)
| Industry | F500 HQs | Revenue |
|---|---|---|
| Financial Services | 10 | $950B |
|
||
| Consumer Goods | 9 | $162B |
|
||
| Insurance | 4 | $225B |
|
||
| Telecommunications | 2 | $144B |
|
||
| Pharmaceuticals | 2 | $112B |
|
||
| Media / Entertainment | 2 | $69B |
|
||
Price history
+32.3% since first listed11 events — show timeline
- 2026-05-07 Pending — OneKey® MLS as Distributed by MLS Grid
- 2026-04-24 Price Changed $129,000 OneKey® MLS as Distributed by MLS Grid
- 2026-04-17 Price Changed $126,000 OneKey® MLS as Distributed by MLS Grid
- 2026-01-26 Listed $129,000 OneKey® MLS as Distributed by MLS Grid
- 2023-05-30 Listed $118,000 OneKey® MLS as Distributed by MLS Grid
- 2021-06-28 Sold (MLS) $88,000 OneKey® MLS as Distributed by MLS Grid
- 2021-03-15 Pending — OneKey® MLS as Distributed by MLS Grid
- 2021-02-25 Price Changed $92,500 OneKey® MLS as Distributed by MLS Grid
- 2021-02-25 Relisted — OneKey® MLS as Distributed by MLS Grid
- 2021-02-22 Listing Removed — OneKey® MLS as Distributed by MLS Grid
- 2020-12-02 Listed $97,500 OneKey® MLS as Distributed by MLS Grid
Cash-flow waterfall
monthlySold comps — $/sqft
last 12 mo · ≤1 miLoading sold comps…