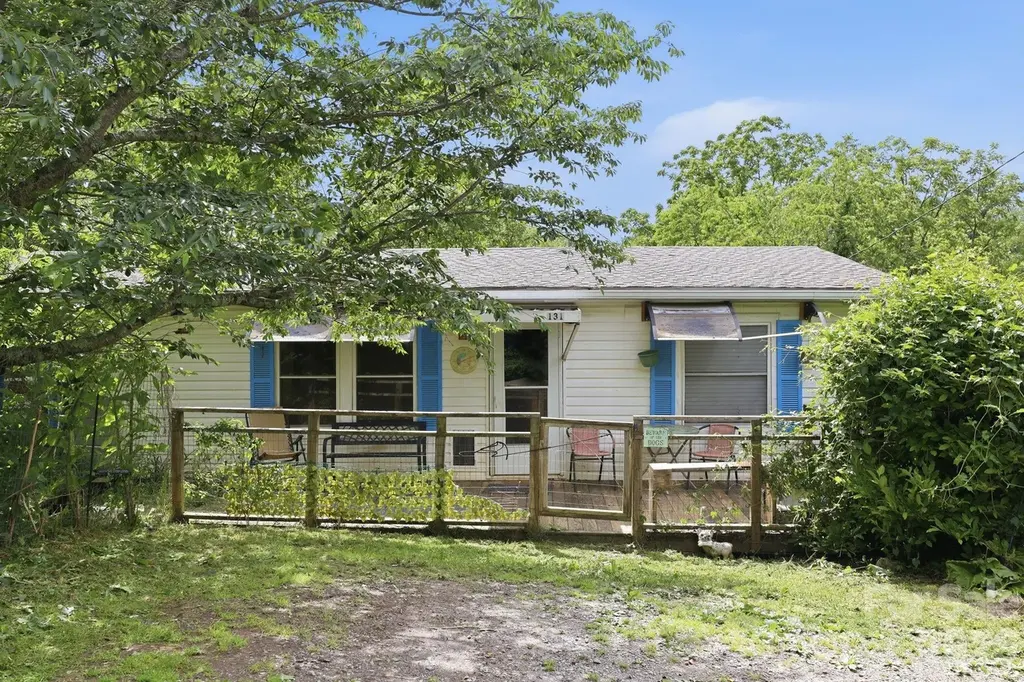
131 Vinewood Cir · Asheville, NC
Flood risk 1/10 · Minimal
- FEMA flood zone
- X (unshaded)
- Chance of flooding over 30 yrs
- 0.0%
- Est. flood insurance / yr
- $507 – $1,088
Fire risk 1/10 · Minimal
- Est. fire insurance / yr
- $906 – $1,684
Heat risk 4/10 · Minor
- Hot days now (above 98°F)
- 7 days/yr
- Hot days in 30 yrs
- 19 days/yr
Wind risk 2/10 · Minimal
- Chance of severe wind over 30 yrs
- —
Air-quality risk 3/10 · Minor
- Unhealthy air days now
- 2 days/yr
- Unhealthy air days in 30 yrs
- 2 days/yr
Risk factors via First Street. Map © Google.
Why this score? — see what drove the D+ grade
The composite is a weighted blend of 9 inputs, each scored 0–100. Each bar is that input's sub-score; the figure is the points it added to the 100-point composite (weight × sub-score).
- Cash flow +18.3/30.0
- ARV discount +7.5/15.0
- DSCR +5.8/10.0
- Schools +4.0/10.0
- 1% rule +3.7/10.0
- Livability +3.6/5.0
- Rent growth +3.0/5.0
- Condition / age +2.5/5.0
- Appreciation +0.0/10.0
$225,000
🖨 Deal sheet 📄 Offer letter ✓ Due diligence
Listing remarks MLS
3 BR, 2 bath home on .33 acre lot, newer roof, large backyard, AHS Home Warranty, property being sold "as-is", front deck and covered back porch, convenient West Asheville location, close to downtown.
Key facts
- Newer stove
- Upgraded flooring
- Newer roof
Tags
Property features AI
Finance
- HOA & community: No HOA
Exterior
- Parking: Driveway (no main-level garage)
- Utilities: City water; Septic system installed
- Home design: Manufactured doublewide single-family residence; One level; R-3 zoning
- Construction: Manufactured construction; Vinyl exterior; Crawl space foundation; Built as a single-level home
- Exterior features: Lot approximately 0.33 acres; Roads are a mix of gravel and paved; Publicly maintained road access
Interior
- Kitchen: Gas range; Refrigerator
- Bedrooms: Three bedrooms on the main level
- Bathrooms: Two full bathrooms on the main level
- Heating & cooling: Electric heating; Central air conditioning
- Interior features: Gas range; Refrigerator; One main-level living area (open room count: 1)
- Laundry & utility: Laundry on the main level
Neighborhood map
What this means for you Summary
Snapshot
- This is a 3-bed/2.0-bath manufactured listed at $225k.
Deal economics
- At list price, monthly cash flow is $207 ($2k/yr) — positive.
- The deal already cash-flows at list — no discount required.
- To meet the 1% rule (rent ≥ 1% of price), the offer needs to be $195k (13.5% below list).
- Recommended offer: $195k (13.5% below list) — sets the bar for 1% rule.
- Cap rate 7.4% vs local median 2.4% in Asheville — top-decile yield for the area; either an underpriced asset or a hidden risk that comps aren't pricing in. Stress-test before assuming the spread holds.
Location & tenants
- Location reads 72/100 on livability (#96 in NC) — a middle-class / working-renter tenant base. Strengths: commute A+, health & safety A+, housing A-; Watch: crime F.
- Buncombe County Schools (suburban): math 45% / reading 50% proficiency, ranked #72 of 178 in NC (top 40%) — families likely to look elsewhere, expect single-tenant / working-renter base with shorter leases.
- Market conditions: Rents rising (+2.1%/yr); 334 active listings in the ZIP; 12 comparable units currently listed for rent nearby; rentals leasing fast (median 14d on market — plan ~1-2 weeks tenant-placement turnaround); 3,305 units permitted in Buncombe County in 2024 (1,855 in 5+ unit buildings).
- This rent runs 37% of the median local income ($63k/yr) — at the standard rent-burdened threshold; future hikes will face affordability resistance.
Forward outlook
- Local home prices are declining (-3.0%/yr); year-one equity from $2k of loan paydown is wiped out by about $7k of value loss. Plan a longer hold.
- Buncombe County population projected at +24% by 2050 — long-run rental-demand tailwind backs the buy-and-hold thesis.
Negotiation context
- It's been on market 21 days — a 2% lower offer ($222k) is reasonable based on typical stale-listing flexibility.
- 2 sale attempts since 7y ago with the ask held roughly flat each time — persistent listings suggest the price (not the market) is what's stuck; bring a comps-based counter.
- Current owner paid $116k; list at $225k implies a 94% gain — meaningful room to come down on a strong offer.
Questions for the listing agent
- Is there a deadline driving the sale (1031 exchange, divorce, estate, relocation)? That informs how much negotiation room exists.
- Schools are B-rated — typically a magnet for longer-tenancy family renters. What's the average tenant stay here, and is there a school-zone premium baked into asking?
- Crime grade is F in this area — have there been break-ins, vandalism, or insurance claims at this property in the last 3 years? What carrier currently insures it and at what premium?
- The area grade is low — what's the realistic commute time and amenity access for the typical tenant pool here? Any planned neighborhood developments (good or bad) we should know about?
- What's the average days-on-market for RENTAL listings here right now (not sales)? A rising rental-DOM trend means longer vacancies and softer asking-rent achievability than the comps imply.
- What's the recent tenant-quality profile in this submarket — average credit score on applications, eviction rate, late-payment / NSF rate, and stable-employment percentage? A property-management company in the area should have these aggregated.
- How much new for-sale + rental construction is in the pipeline within 1–3 miles? Heavy new supply typically softens prices + rents 12–24 months out; constrained supply supports both.
Investment metrics
- 1% rule
- 0.87% ✗
- Cap rate
- 7.40%
- Cash-on-cash
- 3.95%
- DSCR
- 1.18
- GRM
- 9.6
CMA / ARV
No comps found within radius.
Projected returns pro-forma
-3.0% appreciation · 2.06% rent growth · sell at horizon
- IRR
- -11.1%
- Equity multiple
- 0.60×
- Total profit
- $-25,197
- Equity at exit
- $33,548
- IRR
- -3.1%
- Equity multiple
- 0.80×
- Total profit
- $-12,735
- Equity at exit
- $19,454
Cash invested: $63,000 (down + closing). Projections, not guarantees.
Landlord ↔ Tenant lean methodology
- Overall (STATE)
- 85 Strongly Landlord-Friendly
- State North Carolina
- 85 Strongly Landlord-Friendly · R+3
- County
- — inherits STATE
- City
- — inherits STATE
ZIP-level market 28806
- Rents YoY
- 2.1%
- Active inventory
- 334
- Price-to-rent
- 9.6×
Monthly cashflow live
- Estimated rent
- $1,947 high interval (Pro) →
- Mortgage (P&I)
- −$1,180
- Tax from tax record
- −$57 /mo · $689/yr
- Insurance
- −$94
- HOA
- −$0
- Vacancy / Maint / Mgmt
- −$409
- Net cashflow
- $207
Break-even live
UW: 25.0% down · 7.5% · 30yr · 1.5% tax · 5.0% vac · 8.0% maint · 8.0% mgmt
Financing live
Cash to close
- Down payment
- $56,250
- Closing costs
- $6,750
- Reserves months
- —
- Total cash needed
- —
Loan-product check · same deal, 3 products live
Conventional
25% down · 7.5% · 30yr
- Down + closing
- —
- Monthly P&I
- —
- Monthly cashflow
- —
- DSCR
- —
- Eligible?
- —
Personal DTI + credit; lowest rate.
DSCR
20% down · 8.5% · 30yr
- Down + closing
- —
- Monthly P&I
- —
- Monthly cashflow
- —
- DSCR
- —
- Eligible?
- —
No personal income docs; deal must DSCR.
Hard money
10% down · 12.0% · 12mo
- Down + closing
- —
- Monthly P&I
- —
- Monthly cashflow
- —
- DSCR
- —
- Eligible?
- —
Short-term bridge; refi at stabilization.
Rent comps 12 comps
| Address | Beds | Baths | Sqft | Rent | $/sqft | DOM | Units | Dist |
|---|---|---|---|---|---|---|---|---|
| 313 Westover Dr Asheville, NC | 3.0 | 2.0 | 1170 | $2,200 | $1.88 | 23d | 1 | 0.88mi |
| 5 Frankie Ln Asheville, NC | 3.0 | 1.0 | 912 | $2,500 | $2.74 | 43d | 1 | 0.97mi |
| 13 Garden Rd Asheville, NC | 3.0 | 2.0 | 902 | $1,500 | $1.66 | 43d | 1 | 1.19mi |
| 5 Rolos Way Unit 5 Asheville, NC | 2.0 | 2.0 | 1100 | $1,850 | $1.68 | 13d | 1 | 1.22mi |
| 13 Rolos Way Unit 13 Asheville, NC | 3.0 | 3.0 | 1314 | $2,200 | $1.67 | 13d | 1 | 1.23mi |
| 3 W Rosecrest St Unit 3D Woodfin, NC | 2.0 | 1.0 | 875 | $1,400 | $1.60 | 13d | 1 | 1.41mi |
| 3 W Rosecrest St Unit 1C Woodfin, NC | 2.0 | 1.0 | 875 | $1,600 | $1.83 | 13d | 1 | 1.41mi |
| 275 Hazel Mill Rd Asheville, NC | 2.0 | 2.0 | 1211 | $2,037 | $1.68 | 13d | 4 | 1.42mi |
| 8 Townview Dr Asheville, NC | 3.0 | 2.0 | 1100 | $1,700 | $1.55 | 43d | 1 | 1.44mi |
| 6 Townview Dr Asheville, NC | 3.0 | 2.0 | 1100 | $1,700 | $1.55 | 43d | 1 | 1.45mi |
| 1 W Rosecrest St Unit 1C Asheville, NC | 2.0 | 1.0 | 875 | $1,600 | $1.83 | 13d | 1 | 1.45mi |
| 99 Ascension Dr Asheville, NC | 1.0–3.0 | 1.0–2.0 | 1008 | $1,624 | $1.61 | 13d | 17 | 1.50mi |
Listing history 19 events
-
2026-06-18days on market $225,000 Active 21 DOM
-
2026-06-17days on market $225,000 Active 20 DOM
-
2026-06-16days on market $225,000 Active 19 DOM
-
2026-06-15days on market $225,000 Active 18 DOM
-
2026-06-14days on market $225,000 Active 16 DOM
-
2026-06-10days on market $225,000 Active 13 DOM
-
2026-06-09days on market $225,000 Active 12 DOM
-
2026-06-08days on market $225,000 Active 11 DOM
-
2026-06-07days on market $225,000 Active 10 DOM
-
2026-06-03days on market $225,000 Active 6 DOM
-
2026-06-02days on market $225,000 Active 5 DOM
-
2026-06-01days on market $225,000 Active 4 DOM
-
2026-05-31days on market $225,000 Active 3 DOM
-
2026-05-30days on market $225,000 Active 2 DOM
-
2026-05-28$225,000 Active
-
2019-12-06soldstatus $116,000 Closed 210-char remark
Show marketing remark (210 chars)
3 BR, 2 bath home on .33 acre lot, newer roof, large backyard, AHS Home Warranty, property being sold "as-is", front deck and covered back porch, convenient West Asheville location, close to downtown.
-
2019-12-06soldstatus $116,000
Show marketing remark (210 chars)
3 BR, 2 bath home on .33 acre lot, newer roof, large backyard, AHS Home Warranty, property being sold "as-is", front deck and covered back porch, convenient West Asheville location, close to downtown.
-
2019-11-14historical Under Contract - Show 210-char remark
Show marketing remark (210 chars)
3 BR, 2 bath home on .33 acre lot, newer roof, large backyard, AHS Home Warranty, property being sold "as-is", front deck and covered back porch, convenient West Asheville location, close to downtown.
-
2019-11-07$130,000 Active 210-char remark
Show marketing remark (210 chars)
3 BR, 2 bath home on .33 acre lot, newer roof, large backyard, AHS Home Warranty, property being sold "as-is", front deck and covered back porch, convenient West Asheville location, close to downtown.
ⓘ Source: listings_history table (triggers on properties + properties_extension) + one-shot
backfill from property_details.listing_events for pre-trigger history.
Tax reassessment forecast NC · Resets to sale price
- Current annual tax
- $689 · $57/mo
- Projected year-2 tax
- $1,845 · $154/mo
- Expected delta
- +$1,156/yr (+$96/mo · 167.8%)
ⓘ Screening estimate from a state-policy table — verify with the county assessor before closing.
Climate risk First Street
- Flood 1/10 Low FEMA zone X (unshaded) · 0% chance over 30 yrs
- Wildfire 1/10 Low
- Heat 4/10 Moderate 7 d/yr ≥98°F today · 19 d/yr by 30 yrs out
- Wind 2/10 Low
- Air quality 3/10 Moderate 2 unhealthy d/yr today · 2 by 30 yrs out
Nearby sold comps map
Loading sold comps map…
Walkable amenities ~0.75 mi
Loading nearby amenities…
Taxation est. · year 1
- Rental income
- $23,366
- − Mortgage interest
- −$12,603
- − Property taxes
- −$689
- − Insurance
- −$1,125
- − Repairs & maintenance
- −$1,869
- − Management
- −$1,869
- − Depreciation
- −$6,545
- Taxable loss
- −$1,335
- Est. tax savings @ 24.0%
- +$320
- After-tax cash flow
- $2,807/yr
For passive investors: Depreciation is non-cash, so a rental often shows a tax loss while cash-flowing — sheltering income. Rental losses are passive: they offset passive income freely, and up to $25,000/yr can offset ordinary (W-2) income if you actively participate and your MAGI is under $100k (phasing out to $0 by $150k); unused losses carry forward. On sale, claimed depreciation is recaptured at up to 25%, and gains may owe capital-gains tax (a 1031 exchange can defer both). Figures are a year-1 estimate at your 24.0% rate — not tax advice; consult a CPA.
Schools (NCES district)
- District
- Buncombe County Schools
- NCES district ID
- 3700450
- Math proficiency
- 45% ▬ 0.00%
- Reading proficiency
- 50% ▲ 2.00%
- Median HH income
- $45,981
- Composite
- 40.32/100
- National rank
- #3749
- State rank
- #72 of 178 in NC
Livability — Asheville
- Score
- 72/100
- State rank
- #96
- US rank
- #6307
Category grades
Schools grade is shown separately in the Schools card above.
Census & demographics
- County
- Buncombe County · 241,085 people
- City population
- 137,611
- Metro
- Asheville, NC
- Population (ZIP)
- 43,433
- Household income
- $63,273
- Rent vs Own
- Severe rent burden
- 1783.0
Population outlook (Buncombe County) Hauer SSP2
- Today (2025)
- 286,475 people
- By 2030
- 302,237 · +5.5%
- By 2040
- 330,687 · +15.4%
- By 2050
- 356,370 · +24.4%
- By 2075
- 409,383 · +42.9%
- By 2100
- 437,270 · +52.6%
Race, ethnicity, and origin ACS 2023
- Neighborhood character
- Predominantly White (77%)
- Race & ethnicity
- White 77% Hispanic / Latino 11% Two or more races 9% Black 6% Asian 2%
- Hispanic origin (detail)
- Mexican 6%
- Common ancestry
- Serbian 3% Slovak 3% Italian 3%
- Foreign-born
- 10% · Canada, China
- Languages at home
- 86% English-only · Spanish 9% Russian/Polish/Slavic 3% Other Indo-European 2%
Political lean MEDSL · Buncombe
- 2024 margin
- Strong D (+24.8) · D 61.7% · R 36.9% · Other 1.4%
- 2008→2024 swing
- +10.9pp toward D · 2008: 13.9pp · 2024: 24.8pp
- All cycles
- 2024: D+24.8 2020: D+21.1 2016: D+14.6 2012: D+12.4 2008: D+13.9
Not yet ingested
- Civics
- —
Market trends
- HPI YoY
- ▼ -271.16%
- Current HPI
- 350.3071
- Rent YoY
- ▲ 2.06%
- Metro
- Asheville, NC
- State GDP YoY
- ▲ 3.28%
- F500 in state
- 26
Industry mix (Fortune 500 HQ in NC)
| Industry | F500 HQs | Revenue |
|---|---|---|
| Financial Services | 2 | $213B |
|
||
| Retail | 2 | $95B |
|
||
| Industrial Conglomerate | 1 | $38B |
|
||
| Metals / Steel | 1 | $35B |
|
||
| Utilities | 1 | $30B |
|
||
| Industrial Machinery | 1 | $19B |
|
||
Price history
+73.1% since first listed5 events — show timeline
- 2026-05-28 Listed $225,000 CANOPYMLS as Distributed by MLS Grid
- 2019-12-06 Sold (Public Records) $116,000 Public Records
- 2019-12-06 Sold (MLS) $116,000 CANOPYMLS as Distributed by MLS Grid
- 2019-11-14 Contingent — CANOPYMLS as Distributed by MLS Grid
- 2019-11-07 Listed $130,000 CANOPYMLS as Distributed by MLS Grid
Property tax history
+2.8%/yrLatest (2025): $689 · +6.7% YoY. Source: county tax records.
Cash-flow waterfall
monthlySold comps — $/sqft
last 12 mo · ≤1 miLoading sold comps…