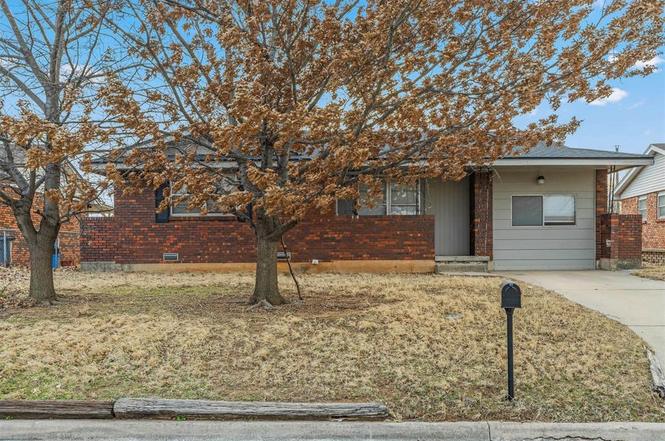
344 NW 65th St · Lawton, OK
Flood risk 1/10 · Minimal
- FEMA flood zone
- X (unshaded)
- Chance of flooding over 30 yrs
- 0.0%
- Est. flood insurance / yr
- $507 – $1,088
Fire risk 3/10 · Minor
- Est. fire insurance / yr
- $2,463 – $4,575
Heat risk 6/10 · Moderate
- Hot days now (above 109°F)
- 7 days/yr
- Hot days in 30 yrs
- 19 days/yr
Wind risk 3/10 · Minor
- Chance of severe wind over 30 yrs
- 5.0%
Air-quality risk 1/10 · Minimal
- Unhealthy air days now
- 0 days/yr
- Unhealthy air days in 30 yrs
- 0 days/yr
Risk factors via First Street. Map © Google.
Why this score? — see what drove the C- grade
The composite is a weighted blend of 9 inputs, each scored 0–100. Each bar is that input's sub-score; the figure is the points it added to the 100-point composite (weight × sub-score).
- Cash flow +17.0/30.0
- ARV discount +13.8/15.0
- DSCR +5.3/10.0
- 1% rule +4.1/10.0
- Rent growth +3.8/5.0
- Livability +3.2/5.0
- Condition / age +2.5/5.0
- Schools +2.0/10.0
- Appreciation +0.0/10.0
$138,000
🖨 Deal sheet 📄 Offer letter ✓ Due diligence
Listing remarks
Charming home in Lawton! This property at 344 NW 65th offers a welcoming layout with spacious living, cozy bedrooms, and a functional kitchen. Major update already done with a new air conditioner for comfort and efficiency. Enjoy a private backyard with plenty of room to relax or entertain. Conveniently located near shopping, schools, and Ft. Sill access—perfect for a starter home, downsizing, or investment property!
Key facts
- Functional kitchen
- Welcoming layout
- Private backyard
Tags
Property features AI
Finance
- Other: Active listing; Occupied: No
- Financial info: Loan qualification available; Not assumable
- HOA & community: No mandatory association dues
Exterior
- Utilities: Homestead not claimed
- Home design: Single family residence; Single-story (one level); Existing property
- Construction: Brick and frame construction; Architectural shingle roof; Combination foundation; Built on lot in Country Club West
- Exterior features: Open patio
Interior
- Bedrooms: 4 bedrooms
- Bathrooms: 1 full bathroom; 1 half bathroom
- Heating & cooling: Central gas heating
- Interior features: One living area; No fireplace
Neighborhood map
What this means for you Summary
Snapshot
- This is a 3-bed/2.0-bath single-family listed at $138k.
Deal economics
- At list price, monthly cash flow is $93 ($1k/yr) — positive.
- The deal already cash-flows at list — no discount required.
- To meet the 1% rule (rent ≥ 1% of price), the offer needs to be $126k (8.8% below list).
- Recommended offer: $121k (12.0% below list) — sets the bar for market timing.
Location & tenants
- Location reads 63/100 on livability (#206 in OK) — a middle-class / working-renter tenant base. Strengths: cost of living A+, housing A+; Watch: employment D, crime F, commute F.
- Lawton (urban): math 20% / reading 26% proficiency, ranked #137 of 270 in OK (top 51%) — low school quality limits family demand, transient renter base, plan for 1-2y turnover.
- Zoned schools: Edison Es (math 12% / reading 12%, grade F, #667 of 845 statewide, top 82%, 476 students, 0% FRL); Eisenhower Hs (math 19% / reading 29%, grade F, #215 of 447 statewide, top 48%, 1,350 students, 0% FRL) — zoned schools average 0% FRL vs 54% district-wide (54 pts lower); this property's tenant base skews higher-income than the district average.
- Market conditions: Rents rising fast (+5.1%/yr); 398 active listings in the ZIP; 133 units permitted in Comanche County in 2024 (0 in 5+ unit buildings).
Forward outlook
- Local home prices are declining (-3.0%/yr); year-one equity from $954 of loan paydown is wiped out by about $4k of value loss. Plan a longer hold.
- Comanche County population projected to shrink 3% by 2050 — rents likely to lag national; underwrite the cash flow, not the appreciation.
Negotiation context
- It's been on market 272 days — a 12% lower offer ($121k) is reasonable based on typical stale-listing flexibility.
- 6 sale attempts since 18y ago with the ask held roughly flat each time — persistent listings suggest the price (not the market) is what's stuck; bring a comps-based counter.
- Current owner paid $110k; 26% above their basis — modest negotiation headroom, anchor on the comps not their cost.
Risks & watch-outs
- Climate carrying-cost: extreme-heat days projected 7→19/yr by 2055 (HVAC capex compounding) — expect insurance premiums to compound above CPI over the hold.
Questions for the listing agent
- It's been on market 272 days. Have you received any prior offers? Is the seller open to a 12% concession, seller financing, or rate buy-down credit?
- Built in 1967 — when were the roof, HVAC, electrical panel, plumbing, and water heater last replaced?
- Why hasn't it sold? Are there any deal-killer items the seller is aware of (foundation, flood, title, zoning, code violations)?
- Is there a deadline driving the sale (1031 exchange, divorce, estate, relocation)? That informs how much negotiation room exists.
- Schools are D-rated, which usually means shorter tenancies and higher turnover. Who's the typical renter profile here, and what's been the actual vacancy rate?
- Crime grade is F in this area — have there been break-ins, vandalism, or insurance claims at this property in the last 3 years? What carrier currently insures it and at what premium?
- What's the average days-on-market for RENTAL listings here right now (not sales)? A rising rental-DOM trend means longer vacancies and softer asking-rent achievability than the comps imply.
- What's the recent tenant-quality profile in this submarket — average credit score on applications, eviction rate, late-payment / NSF rate, and stable-employment percentage? A property-management company in the area should have these aggregated.
- How much new for-sale + rental construction is in the pipeline within 1–3 miles? Heavy new supply typically softens prices + rents 12–24 months out; constrained supply supports both.
Investment metrics
- 1% rule
- 0.91% ✗
- Cap rate
- 7.10%
- Cash-on-cash
- 2.89%
- DSCR
- 1.13
- GRM
- 9.1
CMA / ARV
- ARV (on-the-fly)
- $160,490
- Comps found
- 12
Show comp detail 12 sales within ~0.75 mi
| Address | Dist | Beds/Ba | Sqft | Sold | Price | $/sf | Match |
|---|---|---|---|---|---|---|---|
| 340 N 62nd St | 0.17mi | 3/3.0 | 1,500 (+3%) | 2mo | $70,000 | $47 | 81 |
| 6819 NW Willow Creek Dr | 0.39mi | 3/2.0 | 1,500 (+3%) | 3mo | $200,000 | $133 | 74 |
| 717 NW 67th St | 0.35mi | 3/2.0 | 1,400 (-4%) | 4mo | $123,500 | $88 | 74 |
| 5864 NW Dearborn Ave | 0.15mi | 3/2.0 | 1,300 (-11%) | 3mo | $145,000 | $112 | 72 |
| 7118 NW Birch Pl | 0.53mi | 3/2.0 | 1,400 (-4%) | 1mo | $153,500 | $110 | 68 |
| 7216 NW Cherry Cir | 0.56mi | 3/2.0 | 1,525 (+4%) | 4mo | $175,000 | $115 | 64 |
| 14 NW 56th St | 0.66mi | 3/2.0 | 1,400 (-4%) | 1mo | $160,000 | $114 | 62 |
| 6747 NW Compass Dr | 0.48mi | 3/2.0 | 1,300 (-11%) | 2mo | $112,000 | $86 | 58 |
| 7406 NW Woodland Dr | 0.58mi | 3/2.0 | 1,300 (-11%) | 3mo | $155,000 | $119 | 52 |
| 6714 SW Embassy Cir | 0.65mi | 4/2.0 (+1) | 1,600 (+10%) | 1mo | $101,914 | $64 | 48 |
| 5322 NW Ash Ave | 0.70mi | 3/2.0 | 1,300 (-11%) | 3mo | $141,000 | $108 | 46 |
| 5333 NW Cherry Ave | 0.69mi | 3/1.5 | 1,300 (-11%) | 3mo | $130,500 | $100 | 46 |
Match score weights: distance 35% · size 25% · config 20% · recency 20%. Top-matched comps best support the ARV.
Projected returns pro-forma
-3.0% appreciation · 5.14% rent growth · sell at horizon
- IRR
- -9.5%
- Equity multiple
- 0.65×
- Total profit
- $-13,670
- Equity at exit
- $20,576
- IRR
- 2.5%
- Equity multiple
- 1.20×
- Total profit
- $7,557
- Equity at exit
- $11,932
Cash invested: $38,640 (down + closing). Projections, not guarantees.
Landlord ↔ Tenant lean methodology
- Overall (STATE)
- 83 Strongly Landlord-Friendly
- State Oklahoma
- 83 Strongly Landlord-Friendly · R+20
- County
- — inherits STATE
- City
- — inherits STATE
ZIP-level market 73505
- Rents YoY
- 5.1%
- Active inventory
- 398
- Price-to-rent
- 9.1×
Monthly cashflow live
- Estimated rent
- $1,259 medium interval (Pro) →
- Mortgage (P&I)
- −$724
- Tax from tax record
- −$120 /mo · $1,443/yr
- Insurance
- −$58
- HOA
- −$0
- Vacancy / Maint / Mgmt
- −$264
- Net cashflow
- $93
Break-even live
UW: 25.0% down · 7.5% · 30yr · 1.5% tax · 5.0% vac · 8.0% maint · 8.0% mgmt
Financing live
Cash to close
- Down payment
- $34,500
- Closing costs
- $4,140
- Reserves months
- —
- Total cash needed
- —
Loan-product check · same deal, 3 products live
Conventional
25% down · 7.5% · 30yr
- Down + closing
- —
- Monthly P&I
- —
- Monthly cashflow
- —
- DSCR
- —
- Eligible?
- —
Personal DTI + credit; lowest rate.
DSCR
20% down · 8.5% · 30yr
- Down + closing
- —
- Monthly P&I
- —
- Monthly cashflow
- —
- DSCR
- —
- Eligible?
- —
No personal income docs; deal must DSCR.
Hard money
10% down · 12.0% · 12mo
- Down + closing
- —
- Monthly P&I
- —
- Monthly cashflow
- —
- DSCR
- —
- Eligible?
- —
Short-term bridge; refi at stabilization.
Listing history 31 events
-
2026-06-19days on market $138,000 Active 272 DOM
-
2026-06-18days on market $138,000 Active 271 DOM
-
2026-06-17days on market $138,000 Active 270 DOM
-
2026-06-16days on market $138,000 Active 269 DOM
-
2026-06-15days on market $138,000 Active 268 DOM
-
2026-06-14days on market $138,000 Active 266 DOM
-
2026-06-13days on market $138,000 Active 265 DOM
-
2026-06-10days on market $138,000 Active 263 DOM
-
2026-06-09days on market $138,000 Active 262 DOM
-
2026-06-08days on market $138,000 Active 261 DOM
-
2026-06-07days on market $138,000 Active 260 DOM
-
2026-06-05days on market $138,000 Active 257 DOM
-
2026-06-03days on market $138,000 Active 256 DOM
-
2026-06-02days on market $138,000 Active 255 DOM
-
2026-06-01days on market $138,000 Active 254 DOM
-
2026-05-31days on market $138,000 Active 253 DOM
-
2026-05-30days on market $138,000 Active 252 DOM
-
2025-09-20$138,000 Active
-
2025-07-29historical
-
2025-03-14$138,000 Active
-
2025-01-24historical
-
2024-09-20price $121,000
-
2024-09-02$125,000 Active
-
2024-07-24historical
-
2024-05-22price $130,000
-
2024-01-23$135,000 Active
-
2022-04-15soldstatus $109,900
-
2022-03-04$109,900
-
2009-02-25soldstatus $44,000
-
2008-12-29soldstatus $43,005
-
2008-11-24$40,000
ⓘ Source: listings_history table (triggers on properties + properties_extension) + one-shot
backfill from property_details.listing_events for pre-trigger history.
Tax reassessment forecast OK · Resets to sale price
- Current annual tax
- $1,443 · $120/mo
- Projected year-2 tax
- $1,443 · $120/mo
- Expected delta
- $0/yr ($0/mo · 0.0%)
ⓘ Screening estimate from a state-policy table — verify with the county assessor before closing.
Climate risk First Street
- Flood 1/10 Low FEMA zone X (unshaded) · 0% chance over 30 yrs
- Wildfire 3/10 Moderate
- Heat 6/10 Major 7 d/yr ≥109°F today · 19 d/yr by 30 yrs out
- Wind 3/10 Moderate 5% chance of damaging wind over 30 yrs
- Air quality 1/10 Low 0 unhealthy d/yr today · 0 by 30 yrs out
Nearby sold comps map
Loading sold comps map…
Walkable amenities ~0.75 mi
Loading nearby amenities…
Taxation est. · year 1
- Rental income
- $15,108
- − Mortgage interest
- −$7,730
- − Property taxes
- −$1,443
- − Insurance
- −$690
- − Repairs & maintenance
- −$1,209
- − Management
- −$1,209
- − Depreciation
- −$4,015
- Taxable loss
- −$1,187
- Est. tax savings @ 24.0%
- +$285
- After-tax cash flow
- $1,403/yr
For passive investors: Depreciation is non-cash, so a rental often shows a tax loss while cash-flowing — sheltering income. Rental losses are passive: they offset passive income freely, and up to $25,000/yr can offset ordinary (W-2) income if you actively participate and your MAGI is under $100k (phasing out to $0 by $150k); unused losses carry forward. On sale, claimed depreciation is recaptured at up to 25%, and gains may owe capital-gains tax (a 1031 exchange can defer both). Figures are a year-1 estimate at your 24.0% rate — not tax advice; consult a CPA.
Schools (NCES district)
- District
- Lawton
- NCES district ID
- 4017250
- Math proficiency
- 20% ▼ -12.00%
- Reading proficiency
- 26% ▼ -9.00%
- Median HH income
- $42,618
- Composite
- 19.68/100
- National rank
- #8732
- State rank
- #137 of 270 in OK
Livability — Lawton
- Score
- 63/100
- State rank
- #206
- US rank
- #15131
Category grades
Schools grade is shown separately in the Schools card above.
Census & demographics
- Census place
- Lawton, OK
- County
- Comanche County · 96,361 people
- City population
- 89,233
- Metro
- Lawton, OK
- Population (ZIP)
- 47,790
- Household income
- $58,272
- Rent vs Own
- Severe rent burden
- 1986.0
Population outlook (Comanche County) Hauer SSP2
- Today (2025)
- 124,518 people
- By 2030
- 124,231 · -0.2%
- By 2040
- 122,193 · -1.9%
- By 2050
- 120,368 · -3.3%
- By 2075
- 120,492 · -3.2%
- By 2100
- 123,113 · -1.1%
Race, ethnicity, and origin ACS 2023
- Neighborhood character
- Diverse neighborhood (Simpson 0.70)
- Race & ethnicity
- White 50% Black 17% Two or more races 16% Hispanic / Latino 16% Native American 4% Asian 3%
- Hispanic origin (detail)
- Mexican 11% Puerto Rican 2%
- Common ancestry
- Lithuanian 2% Slovak 2% Romanian 1%
- Foreign-born
- 6% · Canada, South Korea
- Languages at home
- 88% English-only · Spanish 6% German/W. Germanic 2% Korean 1%
Political lean MEDSL · Comanche
- 2024 margin
- Strong R (+23.3) · D 37.4% · R 60.7% · Other 1.9%
- 2008→2024 swing
- -5.8pp toward R · 2008: -17.5pp · 2024: -23.3pp
- All cycles
- 2024: R+23.3 2020: R+20.1 2016: R+23.7 2012: R+17.0 2008: R+17.5
Not yet ingested
- Civics
- —
Market trends
- HPI YoY
- ▼ -134.88%
- Current HPI
- 169.4524
- Rent YoY
- ▲ 5.14%
- Metro
- Lawton, OK
- State GDP YoY
- ▲ 1.55%
- F500 in state
- 6
Industry mix (Fortune 500 HQ in OK)
| Industry | F500 HQs | Revenue |
|---|---|---|
| Energy | 3 | $48B |
|
||
Price history
+245.0% since first listed14 events — show timeline
- 2025-09-20 Listed $138,000 MLSOK
- 2025-07-29 Listing Removed — MLSOK
- 2025-03-14 Listed $138,000 MLSOK
- 2025-01-24 Listing Removed — MLSOK
- 2024-09-20 Price Changed $121,000 MLSOK
- 2024-09-02 Listed $125,000 MLSOK
- 2024-07-24 Listing Removed — MLSOK
- 2024-05-22 Price Changed $130,000 MLSOK
- 2024-01-23 Listed $135,000 MLSOK
- 2022-04-15 Sold (MLS) $109,900 LBRMLS
- 2022-03-04 Listed $109,900 LBRMLS
- 2009-02-25 Sold (Public Records) $44,000 Public Records
- 2008-12-29 Sold (MLS) $43,005 LBRMLS
- 2008-11-24 Listed $40,000 LBRMLS
Property tax history
+4.0%/yrLatest (2025): $1,443 · +4.6% YoY. Source: county tax records.
Cash-flow waterfall
monthlySold comps — $/sqft
last 12 mo · ≤1 miLoading sold comps…