3624 Parkridge Dr #214 · Dallas, TX
Flood risk 1/10 · Minimal
- FEMA flood zone
- X (unshaded)
- Chance of flooding over 30 yrs
- 0.0%
- Est. flood insurance / yr
- $507 – $1,088
Fire risk 1/10 · Minimal
- Est. fire insurance / yr
- $1,222 – $2,270
Heat risk 7/10 · Major
- Hot days now (above 109°F)
- 7 days/yr
- Hot days in 30 yrs
- 23 days/yr
Wind risk 6/10 · Moderate
- Chance of severe wind over 30 yrs
- 27.0%
Air-quality risk 3/10 · Minor
- Unhealthy air days now
- 3 days/yr
- Unhealthy air days in 30 yrs
- 4 days/yr
Risk factors via First Street. Map © Google.
Why this score? — see what drove the D+ grade
The composite is a weighted blend of 9 inputs, each scored 0–100. Each bar is that input's sub-score; the figure is the points it added to the 100-point composite (weight × sub-score).
- ARV discount +13.1/15.0
- Cash flow +12.0/30.0
- 1% rule +9.0/10.0
- Livability +4.0/5.0
- DSCR +3.6/10.0
- Schools +2.8/10.0
- Condition / age +2.5/5.0
- Rent growth +2.2/5.0
- Appreciation +0.0/10.0
$95,000
🖨 Deal sheet (PDF) 📄 Offer letter ✓ Due diligence
Listing remarks
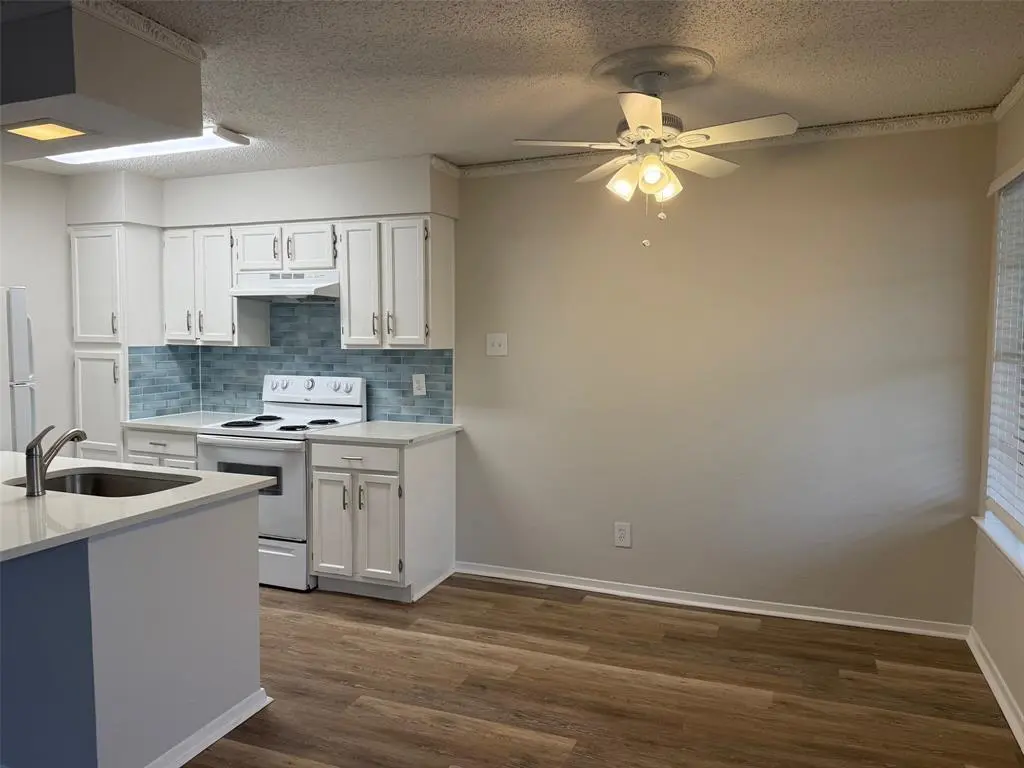
It’s tough to find something this updated at this price in DFW. Freshly renovated 1 bed, 1 bath condo featuring quartz countertops throughout, wood-look vinyl flooring, and a modern tiled shower. Super convenient location near Forest & Marsh—close to everything you need.
Key facts
- Quartz countertops
- Convenient location
- Modern tiled shower
Tags
Property features AI
Finance
- Other: Lot is designated Condo/Townhome lot; complex may subdivide; Directions: From 635 go south on Marsh Ln. Complex is on the right. Park in space 258
- Financial info: Listing for sale
- HOA & community: Mandatory association; Monthly association fee of $326; Association fees include water and sewer; HOA management: Class A (phone: 817-295-5959)
Exterior
- Parking: Assigned parking
- Security: Not specified
- Utilities: City water; City sewer; Concrete and curbs
- Home design: Condominium (residential); One story; Preowned (built in 1982); Complex: The Burgundy
- Construction: Brick construction; Built in 1982
- Exterior features: Community pool; No fencing
Interior
- Kitchen: Dishwasher; Disposal; Electric range
- Bedrooms: One bedroom (Primary bedroom on upper/second level)
- Flooring: Not specified
- Bathrooms: One full bathroom
- Heating & cooling: Central heating (electric); Central air conditioning (electric)
- Interior features: One-level layout; Two total rooms (living area and bedroom); Living and dining areas
- Laundry & utility: No specific laundry details provided
Neighborhood map
What this means for you Summary
Snapshot
- This is a 1-bed/1.0-bath condo listed at $95k.
Deal economics
- At list price, monthly cash flow is $-22 ($-266/yr) — negative.
- To cash-flow at today's rent, offer at most $91k (4.1% below list).
- Meets the 1% rule at list price ($1k rent vs $95k).
- Recommended offer: $91k (4.1% below list) — sets the bar for cash-flow.
- Cap rate 6.0% vs local median 2.3% in Dallas — top-decile yield for the area; either an underpriced asset or a hidden risk that comps aren't pricing in. Stress-test before assuming the spread holds.
Location & tenants
- Location reads 81/100 on livability (#24 in TX, #1,380 nationally) — a professional / high-income tenant draw. Strengths: amenities A+, commute A+, housing A+; Watch: schools C-, crime F.
- Dallas ISD (urban): math 31% / reading 36% proficiency, ranked #559 of 826 in TX (top 68%) — families likely to look elsewhere, expect single-tenant / working-renter base with shorter leases; 83% free/reduced lunch — lower-income household profile, screen leases tightly.
- Market conditions: Rents soft (-1.3%/yr); 163 active listings in the ZIP; 8 comparable units currently listed for rent nearby; rentals lingering (median 45d on market — plan ~5-8 weeks vacancy on turnover, expect pricing pressure); 50% of comp listings sitting > 30 days — soft ceiling on asking rent; solid renter incomes; 12,577 units permitted in Dallas County in 2024 (6,829 in 5+ unit buildings).
Forward outlook
- Local home prices are declining (-3.0%/yr); year-one equity from $657 of loan paydown is wiped out by about $3k of value loss. Plan a longer hold.
- Dallas County population projected at +35% by 2050 — long-run rental-demand tailwind backs the buy-and-hold thesis.
Negotiation context
- Only 4 days on market — expect competitive offers; lowballing is unlikely to land.
- 7 sale attempts since 3y ago with the ask held roughly flat each time — persistent listings suggest the price (not the market) is what's stuck; bring a comps-based counter.
Risks & watch-outs
- Watch-outs: property tax is 2.6% of price; HOA is 25% of rent.
- Climate carrying-cost: major wind risk, 27% chance of damaging wind over 30y; extreme-heat days projected 7→23/yr by 2055 (HVAC capex compounding) — expect insurance premiums to compound above CPI over the hold.
Questions for the listing agent
- What do current leases actually rent for vs. the listed asking? Can we see a recent rent roll and the last 12 months of T-12 income?
- Property tax is high relative to price — has the assessment been appealed recently, and will the sale trigger a re-assessment?
- What does the HOA fee cover, when was the last increase, and are there any pending special assessments or reserve-fund shortfalls?
- Any open or pending special assessments — roof, HVAC, plumbing, elevator, façade? What's the per-unit balance and payoff schedule, and is the seller paying it off at close or rolling it to the buyer?
- Is there a deadline driving the sale (1031 exchange, divorce, estate, relocation)? That informs how much negotiation room exists.
- Crime grade is F in this area — have there been break-ins, vandalism, or insurance claims at this property in the last 3 years? What carrier currently insures it and at what premium?
- The area grade is low — what's the realistic commute time and amenity access for the typical tenant pool here? Any planned neighborhood developments (good or bad) we should know about?
- What's the average days-on-market for RENTAL listings here right now (not sales)? A rising rental-DOM trend means longer vacancies and softer asking-rent achievability than the comps imply.
- What's the recent tenant-quality profile in this submarket — average credit score on applications, eviction rate, late-payment / NSF rate, and stable-employment percentage? A property-management company in the area should have these aggregated.
- How much new apartment / multifamily construction is in the pipeline within 1–3 miles? Heavy new supply (>2% of stock underway) typically softens rents 12–24 months out; light construction supports rent growth.
Investment metrics
- 1% rule
- 1.40% ✓
- Cap rate
- 6.01%
- Cash-on-cash
- -1.00%
- DSCR
- 0.96
- GRM
- 6.0
CMA / ARV
- ARV (median comp)
- $108,379
- List price
- $95,000
- Delta
- 1.50%
- Verdict
- FAIR
- Comps
- 4 within 1.0 mi
Projected returns pro-forma
-3.0% appreciation · 0.0% rent growth · sell at horizon
- IRR
- -23.4%
- Equity multiple
- 0.23×
- Total profit
- $-20,427
- Equity at exit
- $14,165
- IRR
- -43.8%
- Equity multiple
- -0.26×
- Total profit
- $-33,541
- Equity at exit
- $8,214
Cash invested: $26,600 (down + closing). Projections, not guarantees.
Landlord ↔ Tenant lean methodology
- Overall (STATE)
- 87 Strongly Landlord-Friendly
- State Texas
- 87 Strongly Landlord-Friendly · R+5
- County
- — inherits STATE
- City
- — inherits STATE
ZIP-level market 75234
- Rents YoY
- -1.3%
- Active inventory
- 163
- Price-to-rent
- 6.0×
Monthly cashflow live
- Estimated rent
- $1,329 high interval (Pro) →
- Mortgage (P&I)
- −$498
- Tax from tax record
- −$209 /mo · $2,502/yr
- Insurance
- −$40
- HOA
- −$326
- Vacancy / Maint / Mgmt
- −$279
- Net cashflow
- $-22
Break-even live
Sensitivity live
| Price | -10% $32 | -5% $5 | +0% $-22 | +5% $-49 | +10% $-76 |
|---|---|---|---|---|---|
| Rent | -10% $-127 | -5% $-75 | +0% $-22 | +5% $30 | +10% $83 |
| Rate | -1.0pp $26 | -0.5pp $2 | base $-22 | +0.5pp $-47 | +1.0pp $-72 |
UW: 25.0% down · 7.5% · 30yr · 1.5% tax · 5.0% vac · 8.0% maint · 8.0% mgmt
Financing live
Cash to close
- Down payment
- $23,750
- Closing costs
- $2,850
- Reserves months
- —
- Total cash needed
- —
Loan-product check · same deal, 3 products live
Conventional
25% down · 7.5% · 30yr
- Down + closing
- —
- Monthly P&I
- —
- Monthly cashflow
- —
- DSCR
- —
- Eligible?
- —
Personal DTI + credit; lowest rate.
DSCR
20% down · 8.5% · 30yr
- Down + closing
- —
- Monthly P&I
- —
- Monthly cashflow
- —
- DSCR
- —
- Eligible?
- —
No personal income docs; deal must DSCR.
Hard money
10% down · 12.0% · 12mo
- Down + closing
- —
- Monthly P&I
- —
- Monthly cashflow
- —
- DSCR
- —
- Eligible?
- —
Short-term bridge; refi at stabilization.
Rent comps 8 comps
| Address | Beds | Baths | Sqft | Rent | $/sqft | DOM | Units | Dist |
|---|---|---|---|---|---|---|---|---|
| 3737 High Vista Dr Dallas, TX | 1.0–3.0 | 1.0–2.0 | 990 | $1,235 | $1.25 | 0d | 11 | 0.22mi |
| 3022 Forest Ln Dallas, TX | 1.0–2.0 | 1.0 | 696 | $1,175 | $1.69 | 45d | 2 | 1.06mi |
| 4030 Valley View Ln Dallas, TX | 1.0–2.0 | 1.0–2.0 | 851 | $990 | $1.16 | 21d | 6 | 1.08mi |
| 4040 Valley View Ln Farmers Branch, TX | 3.0 | 1.0–2.0 | 1102 | $2,335 | $2.12 | 0d | 65 | 1.20mi |
| 12806 Midway Rd #2024 Dallas, TX | 1.0 | 1.5 | 732 | $1,400 | $1.91 | 45d | 1 | 1.41mi |
| 12818 Midway Rd Dallas, TX | 1.0 | 1.0 | 625 | $1,050 | $1.68 | 45d | 1 | 1.46mi |
| 4020 McEwen Rd Dallas, TX | 1.0 | 1.0–1.5 | 825 | $1,988 | $2.41 | 2d | 12 | 1.47mi |
| 3795 Brookhaven Club Dr Farmers Branch, TX | 1.0 | 1.0 | 648 | $1,199 | $1.85 | 45d | 1 | 1.50mi |
HOA detail condo
- Monthly dues
- $326 · $3,912/yr
- Assessments
- None detected in remarks — confirm with the listing agent.
Listing history 29 events
-
2026-06-21days on market $95,000 Active 4 DOM
-
2026-06-18remarks 273-char remark
-
2026-06-18pricedays on market $95,000 Active 1 DOM
-
2026-06-17days on market $110,000 Active 83 DOM
-
2026-06-16days on market $110,000 Active 82 DOM
-
2026-06-15days on market $110,000 Active 81 DOM
-
2026-06-13days on market $110,000 Active 79 DOM
-
2026-06-09days on market $110,000 Active 75 DOM
-
2026-06-08days on market $110,000 Active 74 DOM
-
2026-06-07days on market $110,000 Active 73 DOM
-
2026-06-04days on market $110,000 Active 70 DOM
-
2026-06-03days on market $110,000 Active 69 DOM
-
2026-06-02days on market $110,000 Active 68 DOM
-
2026-06-01days on market $110,000 Active 67 DOM
-
2026-05-31days on market $110,000 Active 66 DOM
-
2026-03-26$110,000 Active 281-char remark
-
2026-02-22historical
-
2025-12-03$120,000 Active
-
2025-10-30$1,225
-
2024-04-25historical $1,180
-
2024-04-25historical
-
2024-03-28$1,180
-
2024-03-17historical $1,180
-
2024-02-21$150,000 Active
-
2023-09-27$1,180
-
2012-11-16soldstatus
-
2007-09-05soldstatus
-
2001-10-16soldstatus
-
1994-08-11soldstatus
ⓘ Source: listings_history table (triggers on properties + properties_extension) + one-shot
backfill from property_details.listing_events for pre-trigger history.
Tax reassessment forecast TX · Resets to sale price
- Current annual tax
- $2,502 · $209/mo
- Projected year-2 tax
- $2,502 · $209/mo
- Expected delta
- $0/yr ($0/mo · 0.0%)
ⓘ Screening estimate from a state-policy table — verify with the county assessor before closing.
Climate risk First Street
- Flood 1/10 Low FEMA zone X (unshaded) · 0% chance over 30 yrs
- Wildfire 1/10 Low
- Heat 7/10 Severe 7 d/yr ≥109°F today · 23 d/yr by 30 yrs out
- Wind 6/10 Major 27% chance of damaging wind over 30 yrs
- Air quality 3/10 Moderate 3 unhealthy d/yr today · 4 by 30 yrs out
Nearby sold comps map
Loading sold comps map…
Walkable amenities ~0.75 mi
Loading nearby amenities…
Taxation est. · year 1
- Rental income
- $15,951
- − Mortgage interest
- −$5,321
- − Property taxes
- −$2,502
- − Insurance
- −$475
- − Repairs & maintenance
- −$1,276
- − Management
- −$1,276
- − HOA
- −$3,912
- − Depreciation
- −$2,764
- Taxable loss
- −$1,575
- Est. tax savings @ 24.0%
- +$378
- After-tax cash flow
- $112/yr
For passive investors: Depreciation is non-cash, so a rental often shows a tax loss while cash-flowing — sheltering income. Rental losses are passive: they offset passive income freely, and up to $25,000/yr can offset ordinary (W-2) income if you actively participate and your MAGI is under $100k (phasing out to $0 by $150k); unused losses carry forward. On sale, claimed depreciation is recaptured at up to 25%, and gains may owe capital-gains tax (a 1031 exchange can defer both). Figures are a year-1 estimate at your 24.0% rate — not tax advice; consult a CPA.
Schools (NCES district)
- District
- Dallas ISD
- NCES district ID
- 4816230
- Math proficiency
- 31% ▼ -16.00%
- Reading proficiency
- 36% ▼ -4.00%
- Median HH income
- $42,881
- Composite
- 28.41/100
- National rank
- #6763
- State rank
- #559 of 826 in TX
Livability — Dallas
- Score
- 81/100
- State rank
- #24
- US rank
- #1380
Category grades
Schools grade is shown separately in the Schools card above.
Census & demographics
- Census place
- Dallas, TX
- County
- Dallas County · 2,612,404 people
- City population
- 1,168,437
- Metro
- Dallas-Fort Worth-Arlington, TX
- Population (ZIP)
- 32,961
- Household income
- $86,733
- Rent vs Own
- Severe rent burden
- 1021.0
Population outlook (Dallas County) Hauer SSP2
- Today (2025)
- 2,979,839 people
- By 2030
- 3,191,823 · +7.1%
- By 2040
- 3,619,611 · +21.5%
- By 2050
- 4,026,915 · +35.1%
- By 2075
- 4,957,073 · +66.4%
- By 2100
- 5,508,725 · +84.9%
Race, ethnicity, and origin ACS 2023
- Neighborhood character
- Diverse neighborhood (Simpson 0.64)
- Race & ethnicity
- Hispanic / Latino 49% White 32% Two or more races 11% Asian 11% Black 6%
- Hispanic origin (detail)
- Mexican 36% Cuban 2%
- Common ancestry
- Lithuanian 2% Slovak 1% Italian 1%
- Foreign-born
- 32% · Canada, Vietnam, Jamaica
- Languages at home
- 48% English-only · Spanish 42% Other Asian/Pacific 3% Other Indo-European 3%
Political lean MEDSL · Dallas
- 2024 margin
- Strong D (+22.2) · D 60.2% · R 38.0% · Other 1.8%
- 2008→2024 swing
- +6.9pp toward D · 2008: 15.3pp · 2024: 22.2pp
- All cycles
- 2024: D+22.2 2020: D+31.6 2016: D+26.2 2012: D+15.4 2008: D+15.3
Not yet ingested
- Civics
- —
Market trends
- HPI YoY
- ▼ -325.83%
- Current HPI
- 326.1548
- Rent YoY
- ▼ -1.27%
- Metro
- Dallas-Fort Worth-Arlington, TX
- State GDP YoY
- ▲ 3.95%
- F500 in state
- 110
Industry mix (Fortune 500 HQ in TX)
| Industry | F500 HQs | Revenue |
|---|---|---|
| Energy | 16 | $1,198B |
|
||
| Technology | 5 | $198B |
|
||
| Engineering / Construction | 4 | $72B |
|
||
| Energy Services | 3 | $60B |
|
||
| Utilities | 3 | $41B |
|
||
| Healthcare | 2 | $330B |
|
||
Price history
+7950.8% since first listed17 events — show timeline
- 2026-06-17 Listed $95,000 NTREIS
- 2026-05-29 Rental Removed $1,225 NTREIS
- 2026-05-15 Listing Removed — NTREIS
- 2026-03-26 Listed $110,000 NTREIS
- 2026-02-22 Listing Removed — NTREIS
- 2025-12-03 Listed $120,000 NTREIS
- 2025-10-30 Listed for Rent $1,225 NTREIS
- 2024-04-25 Rental Removed $1,180 NTREIS
- 2024-04-25 Listing Removed — NTREIS
- 2024-03-28 Listed for Rent $1,180 NTREIS
- 2024-03-17 Rental Removed $1,180 NTREIS
- 2024-02-21 Listed $150,000 NTREIS
- 2023-09-27 Listed for Rent $1,180 NTREIS
- 2012-11-16 Sold (Public Records) — Public Records
- 2007-09-05 Sold (Public Records) — Public Records
- 2001-10-16 Sold (Public Records) — Public Records
- 1994-08-11 Sold (Public Records) — Public Records
Property tax history
+9.6%/yrLatest (2025): $2,502 · -5.9% YoY. Source: county tax records.
Cash-flow waterfall
monthlySold comps — $/sqft
last 12 mo · ≤1 miLoading sold comps…