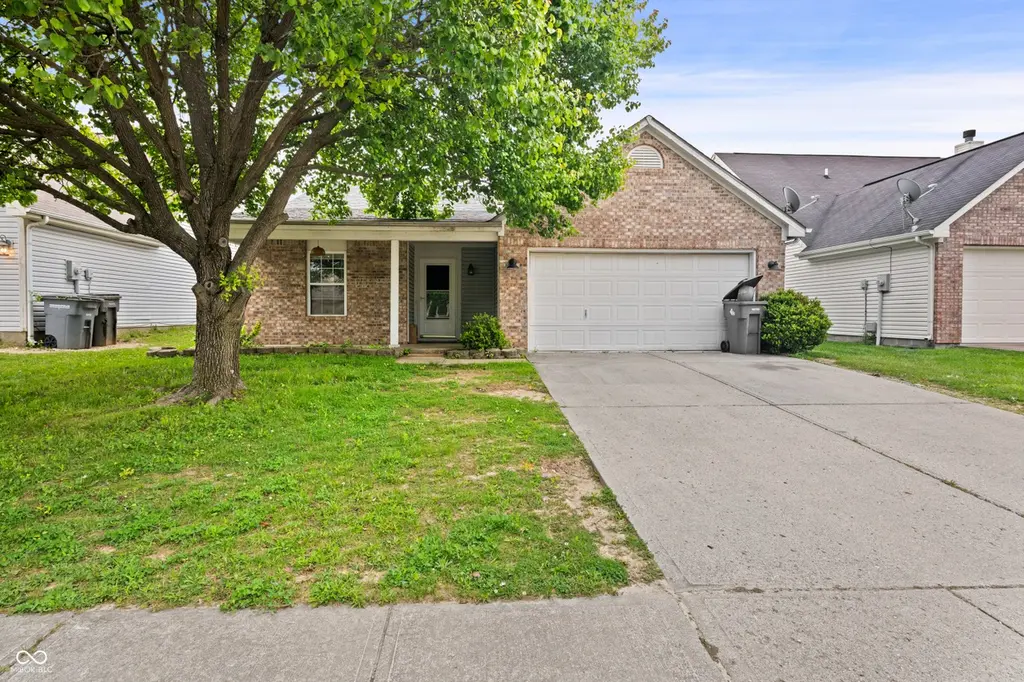
5409 Rocky Mountain Dr · Indianapolis city (balance), IN
Flood risk 1/10 · Minimal
- FEMA flood zone
- X (unshaded)
- Chance of flooding over 30 yrs
- 0.0%
- Est. flood insurance / yr
- $507 – $1,088
Fire risk 1/10 · Minimal
- Est. fire insurance / yr
- $717 – $1,331
Heat risk 3/10 · Minor
- Hot days now (above 102°F)
- 7 days/yr
- Hot days in 30 yrs
- 19 days/yr
Wind risk 2/10 · Minimal
- Chance of severe wind over 30 yrs
- 1.0%
Air-quality risk 3/10 · Minor
- Unhealthy air days now
- 2 days/yr
- Unhealthy air days in 30 yrs
- 3 days/yr
Risk factors via First Street. Map © Google.
Why this score? — see what drove the C- grade
The composite is a weighted blend of 9 inputs, each scored 0–100. Each bar is that input's sub-score; the figure is the points it added to the 100-point composite (weight × sub-score).
- Cash flow +18.1/30.0
- ARV discount +14.2/15.0
- DSCR +5.7/10.0
- 1% rule +4.5/10.0
- Schools +4.0/10.0
- Rent growth +3.4/5.0
- Livability +2.5/5.0
- Condition / age +2.5/5.0
- Appreciation +0.0/10.0
$207,500
🖨 Deal sheet 📄 Offer letter ✓ Due diligence
Listing remarks MLS
This 4 bedroom ranch has a ceramic tile gas fireplace in the living room and also a heated garage. Check out the new ceramic tile in the Kitchen and bathrooms! New carpet throughout house. Hardwood floor entry. The Master Bedroom offers privacy, being separate from the other three Bedrooms. Seller will assist with financing! $500 Bonus to selling agent if closes by April 25th, 2007!!
Key facts
- 6,012 sq ft lot
- 2 garage spots
- Built 2000
Property features AI
Finance
- Other: Ownership interest: Mandatory fee
- Financial info: Financial investment details not provided
- HOA & community: HOA present with semi-annual fee of $195
Exterior
- Parking: Attached 2-car garage (approx. 400 sq ft)
- Security: Security details not provided
- Utilities: Public water; Municipal sewer connected; Solid waste service available
- Home design: Single-family residence; One story
- Construction: Vinyl with brick exterior; Slab foundation
- Exterior features: Lot under 1/4 acre (approximately 0.14 acre)
Interior
- Kitchen: Eat-in kitchen; Dishwasher; Microwave
- Bedrooms: 4 bedrooms (all on main level); Bedroom sizes include 13 x 9, 12 x 10, 11 x 10, and 16 x 11
- Flooring: Flooring details not provided
- Bathrooms: 2 full bathrooms (both on main level)
- Heating & cooling: Forced air heating (natural gas); Central air conditioning
- Interior features: Walk-in closet(s); Eat-in kitchen; Fireplace in great room
- Laundry & utility: Laundry/utility details not provided
Neighborhood map
What this means for you Summary
Snapshot
- This is a 4-bed/1.0-bath single-family listed at $208k.
Deal economics
- At list price, monthly cash flow is $181 ($2k/yr) — positive.
- The deal already cash-flows at list — no discount required.
- To meet the 1% rule (rent ≥ 1% of price), the offer needs to be $197k (4.9% below list).
- Recommended offer: $197k (4.9% below list) — sets the bar for 1% rule.
- Cap rate 7.3% vs local median 4.4% in Indianapolis city (balance) — top-decile yield for the area; either an underpriced asset or a hidden risk that comps aren't pricing in. Stress-test before assuming the spread holds.
Location & tenants
- Location reads: area grade C — affects rentability + tenant quality, not the cash-flow math above.
- Franklin Township Community School Corporation (urban): math 42% / reading 47% proficiency, ranked #87 of 301 in IN (top 29%) — families likely to look elsewhere, expect single-tenant / working-renter base with shorter leases.
- Market conditions: Rents rising (+3.8%/yr); 261 active listings in the ZIP; 13 comparable units currently listed for rent nearby; rentals leasing fast (median 13d on market — plan ~1-2 weeks tenant-placement turnaround); solid renter incomes; 1,906 units permitted in Marion County in 2024 (621 in 5+ unit buildings).
Forward outlook
- Local home prices are declining (-3.0%/yr); year-one equity from $1k of loan paydown is wiped out by about $6k of value loss. Plan a longer hold.
- Marion County population projected at +18% by 2050 — long-run rental-demand tailwind backs the buy-and-hold thesis.
Negotiation context
- It's been on market 43 days — a 3% lower offer ($201k) is reasonable based on typical stale-listing flexibility.
- 5 sale attempts since 24y ago; this cycle's ask has dropped $27k (12%) from the opening price — seller is motivated, your offer sets the floor, not the list.
- Current owner paid $108k; list at $208k implies a 92% gain — meaningful room to come down on a strong offer.
Questions for the listing agent
- It's been on market 43 days. Have you received any prior offers? Is the seller open to a 5% concession, seller financing, or rate buy-down credit?
- What does the HOA fee cover, when was the last increase, and are there any pending special assessments or reserve-fund shortfalls?
- Is there a deadline driving the sale (1031 exchange, divorce, estate, relocation)? That informs how much negotiation room exists.
- What's the average days-on-market for RENTAL listings here right now (not sales)? A rising rental-DOM trend means longer vacancies and softer asking-rent achievability than the comps imply.
- What's the recent tenant-quality profile in this submarket — average credit score on applications, eviction rate, late-payment / NSF rate, and stable-employment percentage? A property-management company in the area should have these aggregated.
- How much new for-sale + rental construction is in the pipeline within 1–3 miles? Heavy new supply typically softens prices + rents 12–24 months out; constrained supply supports both.
Investment metrics
- 1% rule
- 0.95% ✗
- Cap rate
- 7.34%
- Cash-on-cash
- 3.75%
- DSCR
- 1.17
- GRM
- 8.8
CMA / ARV
- ARV (on-the-fly)
- $244,032
- Comps found
- 12
Show comp detail 12 sales within ~0.75 mi
| Address | Dist | Beds/Ba | Sqft | Sold | Price | $/sf | Match |
|---|---|---|---|---|---|---|---|
| 5233 Rocky Mountain Dr | 0.15mi | 3/2.0 (-1) | 1,246 (-2%) | 2mo | $239,000 | $192 | 79 |
| 5410 Waterton Lakes Dr | 0.08mi | 3/2.5 (-1) | 1,231 (-3%) | 4mo | $252,000 | $205 | 76 |
| 5548 Glen Canyon Dr | 0.18mi | 3/2.0 (-1) | 1,245 (-2%) | 5mo | $234,000 | $188 | 75 |
| 5108 Thompson Park Blvd | 0.29mi | 3/2.0 (-1) | 1,264 (-1%) | 4mo | $229,900 | $182 | 73 |
| 5048 Thompson Park Blvd | 0.31mi | 3/2.0 (-1) | 1,196 (-6%) | 3mo | $238,050 | $199 | 64 |
| 5135 Brouse Ct | 0.46mi | 3/2.0 (-1) | 1,243 (-2%) | 2mo | $252,450 | $203 | 64 |
| 5136 Rocky Mountain Dr | 0.25mi | 3/2.0 (-1) | 1,390 (+9%) | 4mo | $239,000 | $172 | 60 |
| 4727 Deacon Ln | 0.63mi | 3/2.0 (-1) | 1,252 (-2%) | 6mo | $200,000 | $160 | 54 |
| 5105 Bahia Dr | 0.71mi | 3/1.5 (-1) | 1,332 (+5%) | 1mo | $225,000 | $169 | 51 |
| 4712 Plowman Dr | 0.70mi | 3/2.0 (-1) | 1,344 (+6%) | 1mo | $270,000 | $201 | 48 |
| 4734 Deacon Ln | 0.63mi | 3/2.0 (-1) | 1,390 (+9%) | 1mo | $266,500 | $192 | 45 |
| 5223 Bahia Dr | 0.68mi | 3/1.5 (-1) | 1,112 (-12%) | 4mo | $195,000 | $175 | 37 |
Match score weights: distance 35% · size 25% · config 20% · recency 20%. Top-matched comps best support the ARV.
Projected returns pro-forma
-3.0% appreciation · 3.78% rent growth · sell at horizon
- IRR
- -9.6%
- Equity multiple
- 0.65×
- Total profit
- $-20,509
- Equity at exit
- $30,939
- IRR
- 0.8%
- Equity multiple
- 1.06×
- Total profit
- $3,515
- Equity at exit
- $17,941
Cash invested: $58,100 (down + closing). Projections, not guarantees.
Landlord ↔ Tenant lean methodology
- Overall (STATE)
- 90 Strongly Landlord-Friendly
- State Indiana
- 90 Strongly Landlord-Friendly · R+11
- County
- — inherits STATE
- City
- — inherits STATE
ZIP-level market 46237
- Rents YoY
- 3.8%
- Active inventory
- 261
- Price-to-rent
- 8.8×
Monthly cashflow live
- Estimated rent
- $1,974 high interval (Pro) →
- Mortgage (P&I)
- −$1,088
- Tax from tax record
- −$170 /mo · $2,044/yr
- Insurance
- −$86
- HOA
- −$33
- Vacancy / Maint / Mgmt
- −$415
- Net cashflow
- $181
Break-even live
UW: 25.0% down · 7.5% · 30yr · 1.5% tax · 5.0% vac · 8.0% maint · 8.0% mgmt
Financing live
Cash to close
- Down payment
- $51,875
- Closing costs
- $6,225
- Reserves months
- —
- Total cash needed
- —
Loan-product check · same deal, 3 products live
Conventional
25% down · 7.5% · 30yr
- Down + closing
- —
- Monthly P&I
- —
- Monthly cashflow
- —
- DSCR
- —
- Eligible?
- —
Personal DTI + credit; lowest rate.
DSCR
20% down · 8.5% · 30yr
- Down + closing
- —
- Monthly P&I
- —
- Monthly cashflow
- —
- DSCR
- —
- Eligible?
- —
No personal income docs; deal must DSCR.
Hard money
10% down · 12.0% · 12mo
- Down + closing
- —
- Monthly P&I
- —
- Monthly cashflow
- —
- DSCR
- —
- Eligible?
- —
Short-term bridge; refi at stabilization.
Rent comps 13 comps
| Address | Beds | Baths | Sqft | Rent | $/sqft | DOM | Units | Dist |
|---|---|---|---|---|---|---|---|---|
| 5309 Waterton Lakes Dr Indianapolis, IN | 3.0 | 2.0 | 1390 | $1,865 | $1.34 | 7d | 1 | 0.13mi |
| 5844 Timber Lake Blvd Indianapolis, IN | 3.0 | 2.0 | 1250 | $1,856 | $1.48 | 2d | 1 | 0.50mi |
| 5739 Ensenada Ave Indianapolis, IN | 3.0 | 2.0 | 1506 | $1,700 | $1.13 | 22d | 1 | 0.67mi |
| 5717 Hacienda Ct Indianapolis, IN | 3.0 | 1.5 | 1322 | $1,631 | $1.23 | 16d | 1 | 0.69mi |
| 5729 Ensenada Ave Indianapolis, IN | 4.0 | 2.0 | 1506 | $1,831 | $1.22 | 23d | 1 | 0.69mi |
| 5723 Ensenada Ave Indianapolis, IN | 3.0 | 2.0 | 1168 | $1,775 | $1.52 | 2d | 1 | 0.71mi |
| 7260 Kidwell Dr Indianapolis, IN | 3.0 | 2.0 | 1409 | $1,899 | $1.35 | 7d | 1 | 0.98mi |
| 4436 Victory Cir Indianapolis, IN | 3.0 | 2.5 | 1712 | $1,850 | $1.08 | 18d | 1 | 1.03mi |
| 5334 Padre Ln Indianapolis, IN | 3.0 | 1.5 | 1016 | $1,695 | $1.67 | 14d | 1 | 1.11mi |
| 5310 Shelbyville Rd Indianapolis, IN | 4.0 | 2.0 | 1860 | $1,850 | $0.99 | 2d | 1 | 1.12mi |
| 6543 E Hanna Ave Indianapolis, IN | 2.0–4.0 | 2.0 | 1452 | $1,659 | $1.14 | 12d | 1 | 1.27mi |
| 4901 S Emerson Ave Indianapolis, IN | 1.0–4.0 | 1.0–2.0 | 998 | $2,008 | $2.01 | 2d | 10 | 1.34mi |
| 5325 Montavia Ln Indianapolis, IN | 3.0 | 2.0 | 1632 | $1,849 | $1.13 | 23d | 1 | 1.49mi |
HOA detail
- Monthly dues
- $33 · $396/yr
- Likely covers
- gas
Listing history 23 events
-
2026-06-18price $207,500 Active 43 DOM
-
2026-06-18days on market $212,500 Active 43 DOM
-
2026-06-17days on market $212,500 Active 42 DOM
-
2026-06-16days on market $212,500 Active 41 DOM
-
2026-06-15days on market $212,500 Active 40 DOM
-
2026-06-13days on market $212,500 Active 38 DOM
-
2026-06-09days on market $212,500 Active 34 DOM
-
2026-06-08days on market $212,500 Active 33 DOM
-
2026-06-07pricedays on market $212,500 Active 32 DOM
-
2026-06-03days on market $223,500 Active 28 DOM
-
2026-06-02days on market $223,500 Active 27 DOM
-
2026-06-01days on market $223,500 Active 26 DOM
-
2026-05-31days on market $223,500 Active 25 DOM
-
2026-05-21price $223,500
-
2026-05-06$234,900 Active
-
2007-04-26soldstatus $108,000 392-char remark
Show marketing remark (392 chars)
This 4 bedroom ranch has a ceramic tile gas fireplace in the living room and also a heated garage. Check out the new ceramic tile in the Kitchen and bathrooms! New carpet throughout house. Hardwood floor entry. The Master Bedroom offers privacy, being separate from the other three Bedrooms. Seller will assist with financing! $500 Bonus to selling agent if closes by April 25th, 2007!!
-
2007-01-21$109,900 392-char remark
Show marketing remark (392 chars)
This 4 bedroom ranch has a ceramic tile gas fireplace in the living room and also a heated garage. Check out the new ceramic tile in the Kitchen and bathrooms! New carpet throughout house. Hardwood floor entry. The Master Bedroom offers privacy, being separate from the other three Bedrooms. Seller will assist with financing! $500 Bonus to selling agent if closes by April 25th, 2007!!
-
2004-05-11historical
-
2003-11-11$112,900
-
2003-06-16historical
-
2002-12-16$112,900
-
2002-11-15soldstatus $87,000
-
2002-09-13$95,000
ⓘ Source: listings_history table (triggers on properties + properties_extension) + one-shot
backfill from property_details.listing_events for pre-trigger history.
Tax reassessment forecast IN · Partial reset (capped growth)
- Current annual tax
- $2,044 · $170/mo
- Projected year-2 tax
- $2,044 · $170/mo
- Expected delta
- $0/yr ($0/mo · -0.0%)
ⓘ Screening estimate from a state-policy table — verify with the county assessor before closing.
Climate risk First Street
- Flood 1/10 Low FEMA zone X (unshaded) · 0% chance over 30 yrs
- Wildfire 1/10 Low
- Heat 3/10 Moderate 7 d/yr ≥102°F today · 19 d/yr by 30 yrs out
- Wind 2/10 Low 100% chance of damaging wind over 30 yrs
- Air quality 3/10 Moderate 2 unhealthy d/yr today · 3 by 30 yrs out
Nearby sold comps map
Loading sold comps map…
Walkable amenities ~0.75 mi
Loading nearby amenities…
Taxation est. · year 1
- Rental income
- $23,687
- − Mortgage interest
- −$11,623
- − Property taxes
- −$2,044
- − Insurance
- −$1,038
- − Repairs & maintenance
- −$1,895
- − Management
- −$1,895
- − HOA
- −$396
- − Depreciation
- −$6,036
- Taxable loss
- −$1,240
- Est. tax savings @ 24.0%
- +$297
- After-tax cash flow
- $2,475/yr
For passive investors: Depreciation is non-cash, so a rental often shows a tax loss while cash-flowing — sheltering income. Rental losses are passive: they offset passive income freely, and up to $25,000/yr can offset ordinary (W-2) income if you actively participate and your MAGI is under $100k (phasing out to $0 by $150k); unused losses carry forward. On sale, claimed depreciation is recaptured at up to 25%, and gains may owe capital-gains tax (a 1031 exchange can defer both). Figures are a year-1 estimate at your 24.0% rate — not tax advice; consult a CPA.
Schools (NCES district)
- District
- Franklin Township Community School Corporation
- NCES district ID
- 1803750
- Math proficiency
- 42% ▼ -12.00%
- Reading proficiency
- 47% ▼ -6.00%
- Median HH income
- $67,825
- Composite
- 39.91/100
- National rank
- #3852
- State rank
- #87 of 301 in IN
Livability — Indianapolis city (balance)
No livability data for this city. (Only ~50 U.S. cities are tracked.)
Census & demographics
- Census place
- Indianapolis city (balance), IN
- County
- Marion County · 998,460 people
- City population
- 881,119
- Metro
- Indianapolis-Carmel-Anderson, IN
- Population (ZIP)
- 43,473
- Household income
- $79,078
- Rent vs Own
- Severe rent burden
- 1245.0
Population outlook (Marion County) Hauer SSP2
- Today (2025)
- 1,025,572 people
- By 2030
- 1,065,727 · +3.9%
- By 2040
- 1,141,577 · +11.3%
- By 2050
- 1,208,920 · +17.9%
- By 2075
- 1,367,288 · +33.3%
- By 2100
- 1,438,201 · +40.2%
Race, ethnicity, and origin ACS 2023
- Neighborhood character
- Predominantly White (71%)
- Race & ethnicity
- White 71% Asian 13% Hispanic / Latino 7% Two or more races 6% Black 5%
- Hispanic origin (detail)
- Mexican 6%
- Common ancestry
- Italian 2% Lithuanian 2% Romanian 2%
- Foreign-born
- 12% · Canada, Philippines
- Languages at home
- 84% English-only · Other Asian/Pacific 5% Spanish 5% Other Indo-European 4%
Political lean MEDSL · Marion
- 2024 margin
- Strong D (+27.7) · D 63.0% · R 35.3% · Other 1.7%
- 2008→2024 swing
- -0.7pp no change · 2008: 28.4pp · 2024: 27.7pp
- All cycles
- 2024: D+27.7 2020: D+29.1 2016: D+22.8 2012: D+22.2 2008: D+28.4
Not yet ingested
- Civics
- —
Market trends
- HPI YoY
- ▼ -180.33%
- Current HPI
- 238.9661
- Rent YoY
- ▲ 3.78%
- Metro
- Indianapolis-Carmel-Anderson, IN
- State GDP YoY
- ▲ 2.90%
- F500 in state
- 18
Industry mix (Fortune 500 HQ in IN)
| Industry | F500 HQs | Revenue |
|---|---|---|
| Industrial Machinery | 2 | $37B |
|
||
| Healthcare | 1 | $177B |
|
||
| Pharmaceuticals | 1 | $45B |
|
||
| Metals / Steel | 1 | $18B |
|
||
| Agriculture | 1 | $17B |
|
||
| Packaging | 1 | $12B |
|
||
Price history
+135.3% since first listed10 events — show timeline
- 2026-05-21 Price Changed $223,500 MIBOR as Distributed by MLS Grid
- 2026-05-06 Listed $234,900 MIBOR as Distributed by MLS Grid
- 2007-04-26 Sold (MLS) $108,000 MIBOR as Distributed by MLS Grid
- 2007-01-21 Listed $109,900 MIBOR as Distributed by MLS Grid
- 2004-05-11 Listing Removed — MIBOR as Distributed by MLS Grid
- 2003-11-11 Listed $112,900 MIBOR as Distributed by MLS Grid
- 2003-06-16 Listing Removed — MIBOR as Distributed by MLS Grid
- 2002-12-16 Listed $112,900 MIBOR as Distributed by MLS Grid
- 2002-11-15 Sold (MLS) $87,000 MIBOR as Distributed by MLS Grid
- 2002-09-13 Listed $95,000 MIBOR as Distributed by MLS Grid
Property tax history
+0.9%/yrLatest (2025): $2,044 · -4.3% YoY. Source: county tax records.
Cash-flow waterfall
monthlySold comps — $/sqft
last 12 mo · ≤1 miLoading sold comps…