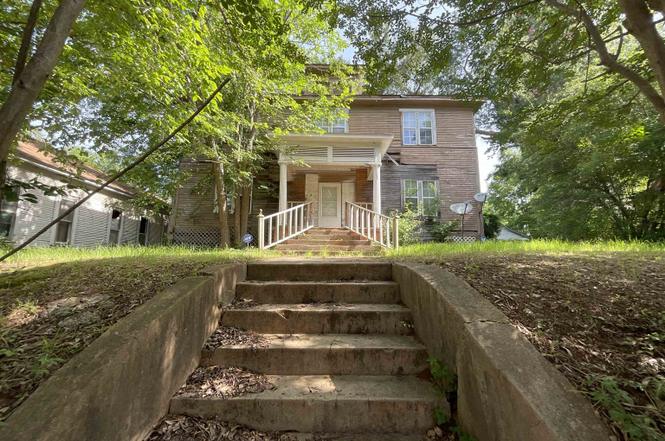
507 E Houston St · Marshall, TX
Flood risk 1/10 · Minimal
- FEMA flood zone
- X (unshaded)
- Chance of flooding over 30 yrs
- 0.0%
- Est. flood insurance / yr
- $507 – $1,088
Fire risk 4/10 · Minor
- Est. fire insurance / yr
- $1,222 – $2,270
Heat risk 7/10 · Major
- Hot days now (above 110°F)
- 7 days/yr
- Hot days in 30 yrs
- 24 days/yr
Wind risk 6/10 · Moderate
- Chance of severe wind over 30 yrs
- 57.0%
Air-quality risk 2/10 · Minimal
- Unhealthy air days now
- 1 days/yr
- Unhealthy air days in 30 yrs
- 2 days/yr
Risk factors via First Street. Map © Google.
Why this score? — see what drove the D grade
The composite is a weighted blend of 9 inputs, each scored 0–100. Each bar is that input's sub-score; the figure is the points it added to the 100-point composite (weight × sub-score).
- Cash flow +15.0/30.0
- ARV discount +7.5/15.0
- 1% rule +5.0/10.0
- DSCR +5.0/10.0
- Livability +3.4/5.0
- Rent growth +2.5/5.0
- Condition / age +2.5/5.0
- Schools +2.4/10.0
- Appreciation +0.0/10.0
$27,000
🖨 Deal sheet (PDF) 📄 Offer letter ✓ Due diligence
Listing remarks
Investor Special !! This 2-story home has 7 bedrooms and 3 baths, a kitchen downstairs and upstairs. Priced to Sale.
Key facts
- 7,100 sq ft lot
- Built 1920
- Listed 86 days
Property features AI
Finance
- Other: Lot size listed as 0.163 acres (to be determined by survey)
Exterior
- Parking: On-street parking
- Utilities: Public water; Public sewer
- Home design: Residential single-family home; 2 stories
- Exterior features: Composition roof
Interior
- Bedrooms: Total rooms: 10
- Bathrooms: 3 full bathrooms
- Heating & cooling: Window cooling unit(s); Ceiling fans
- Interior features: Electric water heater; Window cooling unit(s); Ceiling fans
Neighborhood map
What this means for you Summary
Snapshot
- This is a 7-bed/3.0-bath single-family listed at $27k.
Deal economics
- At list price, monthly cash flow is $1k ($13k/yr) — positive.
- The deal already cash-flows at list — no discount required.
- Meets the 1% rule at list price ($2k rent vs $27k).
- Recommended offer: $25k (6.0% below list) — sets the bar for market timing.
- Cap rate 52.6% vs local median 4.5% in Marshall — top-decile yield for the area; either an underpriced asset or a hidden risk that comps aren't pricing in. Stress-test before assuming the spread holds.
Location & tenants
- Location reads 68/100 on livability (#451 in TX) — a middle-class / working-renter tenant base. Strengths: cost of living A+, housing A+; Watch: amenities F, commute F, employment F.
- Marshall ISD (town): math 29% / reading 29% proficiency, ranked #658 of 826 in TX (top 80%) — low school quality limits family demand, transient renter base, plan for 1-2y turnover; 68% free/reduced lunch — lower-income household profile, screen leases tightly.
- Zoned schools: Marshall J H (math 30% / reading 27%, grade F, #1,122 of 1,662 statewide, top 69%, 1,105 students, 76% FRL).
- Market conditions: 144 active listings in the ZIP; lower-income renter base — watch delinquency; 85 units permitted in Harrison County in 2024 (15 in 5+ unit buildings).
- This rent runs 44% of the median local income ($42k/yr) — at the standard rent-burdened threshold; future hikes will face affordability resistance.
Forward outlook
- Local home prices are declining (-3.0%/yr); year-one equity from $187 of loan paydown is wiped out by about $810 of value loss. Plan a longer hold.
- At projected returns (-3.0% appreciation + 3.0% rent growth), your $8k cash investment doubles in ~1 year — after that, you're playing with house money.
Negotiation context
- It's been on market 86 days — a 6% lower offer ($25k) is reasonable based on typical stale-listing flexibility.
- 3 sale attempts; this cycle's ask has dropped $18k (40%) from the opening price — seller is motivated, your offer sets the floor, not the list.
Risks & watch-outs
- Watch-outs: built in 1920 — expect roof / HVAC / electrical / plumbing capex.
- Climate carrying-cost: major wind risk, 57% chance of damaging wind over 30y; extreme-heat days projected 7→24/yr by 2055 (HVAC capex compounding) — expect insurance premiums to compound above CPI over the hold.
Questions for the listing agent
- It's been on market 86 days. Have you received any prior offers? Is the seller open to a 6% concession, seller financing, or rate buy-down credit?
- Built in 1920 — when were the roof, HVAC, electrical panel, plumbing, and water heater last replaced?
- Why hasn't it sold? Are there any deal-killer items the seller is aware of (foundation, flood, title, zoning, code violations)?
- Is there a deadline driving the sale (1031 exchange, divorce, estate, relocation)? That informs how much negotiation room exists.
- Schools are F-rated, which usually means shorter tenancies and higher turnover. Who's the typical renter profile here, and what's been the actual vacancy rate?
- The area grade is low — what's the realistic commute time and amenity access for the typical tenant pool here? Any planned neighborhood developments (good or bad) we should know about?
- What's the average days-on-market for RENTAL listings here right now (not sales)? A rising rental-DOM trend means longer vacancies and softer asking-rent achievability than the comps imply.
- What's the recent tenant-quality profile in this submarket — average credit score on applications, eviction rate, late-payment / NSF rate, and stable-employment percentage? A property-management company in the area should have these aggregated.
- How much new for-sale + rental construction is in the pipeline within 1–3 miles? Heavy new supply typically softens prices + rents 12–24 months out; constrained supply supports both.
Investment metrics
- 1% rule
- 5.76% ✓
- Cap rate
- 52.65%
- Cash-on-cash
- 165.55%
- DSCR
- 8.37
- GRM
- 1.4
CMA / ARV
No comps found within radius.
Projected returns pro-forma
-3.0% appreciation · 3.0% rent growth · sell at horizon
- IRR
- —
- Equity multiple
- 9.21×
- Total profit
- $62,076
- Equity at exit
- $4,026
- IRR
- —
- Equity multiple
- 19.48×
- Total profit
- $139,687
- Equity at exit
- $2,334
Cash invested: $7,560 (down + closing). Projections, not guarantees.
Landlord ↔ Tenant lean methodology
- Overall (STATE)
- 87 Strongly Landlord-Friendly
- State Texas
- 87 Strongly Landlord-Friendly · R+5
- County
- — inherits STATE
- City
- — inherits STATE
ZIP-level market 75670
- Home prices YoY
- -33.8%
- Active inventory
- 144
- Price-to-rent
- 1.4×
Monthly cashflow live
- Estimated rent
- $1,556 medium interval (Pro) →
- Mortgage (P&I)
- −$142
- Tax est. 1.5%
- −$34 /mo · $405/yr
- Insurance
- −$11
- HOA
- −$0
- Vacancy / Maint / Mgmt
- −$327
- Net cashflow
- $1,043
Break-even live
Sensitivity live
| Price | -10% $1,062 | -5% $1,052 | +0% $1,043 | +5% $1,034 | +10% $1,024 |
|---|---|---|---|---|---|
| Rent | -10% $920 | -5% $982 | +0% $1,043 | +5% $1,104 | +10% $1,166 |
| Rate | -1.0pp $1,057 | -0.5pp $1,050 | base $1,043 | +0.5pp $1,036 | +1.0pp $1,029 |
UW: 25.0% down · 7.5% · 30yr · 1.5% tax · 5.0% vac · 8.0% maint · 8.0% mgmt
Financing live
Cash to close
- Down payment
- $6,750
- Closing costs
- $810
- Reserves months
- —
- Total cash needed
- —
Loan-product check · same deal, 3 products live
Conventional
25% down · 7.5% · 30yr
- Down + closing
- —
- Monthly P&I
- —
- Monthly cashflow
- —
- DSCR
- —
- Eligible?
- —
Personal DTI + credit; lowest rate.
DSCR
20% down · 8.5% · 30yr
- Down + closing
- —
- Monthly P&I
- —
- Monthly cashflow
- —
- DSCR
- —
- Eligible?
- —
No personal income docs; deal must DSCR.
Hard money
10% down · 12.0% · 12mo
- Down + closing
- —
- Monthly P&I
- —
- Monthly cashflow
- —
- DSCR
- —
- Eligible?
- —
Short-term bridge; refi at stabilization.
Listing history 10 events
-
2026-04-29status Pending
-
2026-04-24status Active
-
2026-04-24price $27,000
-
2025-11-18status Active
-
2025-10-06status Pending
-
2025-07-17$45,000 Active
-
2025-06-23soldstatus
-
2014-03-21soldstatus
-
2005-10-21soldstatus
-
2000-11-22soldstatus
ⓘ Source: listings_history table (triggers on properties + properties_extension) + one-shot
backfill from property_details.listing_events for pre-trigger history.
Climate risk First Street
- Flood 1/10 Low FEMA zone X (unshaded) · 0% chance over 30 yrs
- Wildfire 4/10 Moderate
- Heat 7/10 Severe 7 d/yr ≥110°F today · 24 d/yr by 30 yrs out
- Wind 6/10 Major 57% chance of damaging wind over 30 yrs
- Air quality 2/10 Low 1 unhealthy d/yr today · 2 by 30 yrs out
Nearby sold comps map
Loading sold comps map…
Walkable amenities ~0.75 mi
Loading nearby amenities…
Taxation est. · year 1
- Rental income
- $18,677
- − Mortgage interest
- −$1,512
- − Property taxes
- −$405
- − Insurance
- −$135
- − Repairs & maintenance
- −$1,494
- − Management
- −$1,494
- − Depreciation
- −$785
- Taxable income
- $12,851
- Est. tax owed @ 24.0%
- −$3,084
- After-tax cash flow
- $9,432/yr
For passive investors: Depreciation is non-cash, so a rental often shows a tax loss while cash-flowing — sheltering income. Rental losses are passive: they offset passive income freely, and up to $25,000/yr can offset ordinary (W-2) income if you actively participate and your MAGI is under $100k (phasing out to $0 by $150k); unused losses carry forward. On sale, claimed depreciation is recaptured at up to 25%, and gains may owe capital-gains tax (a 1031 exchange can defer both). Figures are a year-1 estimate at your 24.0% rate — not tax advice; consult a CPA.
Schools (NCES district)
- District
- Marshall ISD
- NCES district ID
- 4829160
- Math proficiency
- 29% ▼ -7.00%
- Reading proficiency
- 29% ▼ -7.00%
- Median HH income
- $40,095
- Composite
- 24.43/100
- National rank
- #7680
- State rank
- #658 of 826 in TX
Livability — Marshall
- Score
- 68/100
- State rank
- #451
- US rank
- #9156
Category grades
Schools grade is shown separately in the Schools card above.
Census & demographics
- Census place
- Marshall, TX
- County
- Harrison County · 18,670 people
- City population
- 18,670
- Metro
- Longview, TX
- Population (ZIP)
- 18,670
- Household income
- $42,386
- Rent vs Own
- Severe rent burden
- 598.0
Population outlook (Harrison County) Hauer SSP2
- Today (2025)
- 68,691 people
- By 2030
- 69,317 · +0.9%
- By 2040
- 69,973 · +1.9%
- By 2050
- 70,090 · +2.0%
- By 2075
- 70,607 · +2.8%
- By 2100
- 67,546 · -1.7%
Race, ethnicity, and origin ACS 2023
- Neighborhood character
- Diverse neighborhood (Simpson 0.67)
- Race & ethnicity
- Black 39% White 35% Hispanic / Latino 23% Two or more races 11%
- Hispanic origin (detail)
- Mexican 22%
- Common ancestry
- Lithuanian 1% Italian 1% Slovak 1%
- Foreign-born
- 6% · Canada
- Languages at home
- 85% English-only · Spanish 14%
Political lean MEDSL · Harrison
- 2024 margin
- Solid R (+50.6) · D 24.4% · R 75.0%
- 2008→2024 swing
- -19.2pp toward R · 2008: -31.4pp · 2024: -50.6pp
- All cycles
- 2024: R+50.6 2020: R+45.6 2016: R+43.9 2012: R+34.6 2008: R+31.4
Not yet ingested
- Civics
- —
Market trends
- HPI YoY
- ▼ -51.33%
- Current HPI
- 100.3741
- Rent YoY
- —
- Metro
- Longview, TX
- State GDP YoY
- ▲ 3.95%
- F500 in state
- 110
Industry mix (Fortune 500 HQ in TX)
| Industry | F500 HQs | Revenue |
|---|---|---|
| Energy | 16 | $1,198B |
|
||
| Technology | 5 | $198B |
|
||
| Engineering / Construction | 4 | $72B |
|
||
| Energy Services | 3 | $60B |
|
||
| Utilities | 3 | $41B |
|
||
| Healthcare | 2 | $330B |
|
||
Price history
-40.0% since first listed10 events — show timeline
- 2026-04-29 Pending — LAAR
- 2026-04-24 Relisted — LAAR
- 2026-04-24 Price Changed $27,000 LAAR
- 2025-11-18 Relisted — LAAR
- 2025-10-06 Pending — LAAR
- 2025-07-17 Listed $45,000 LAAR
- 2025-06-23 Sold (Public Records) — Public Records
- 2014-03-21 Sold (Public Records) — Public Records
- 2005-10-21 Sold (Public Records) — Public Records
- 2000-11-22 Sold (Public Records) — Public Records
Property tax history
+4.9%/yrLatest (2025): $2,103 · +18.9% YoY. Source: county tax records.
Cash-flow waterfall
monthlySold comps — $/sqft
last 12 mo · ≤1 miLoading sold comps…