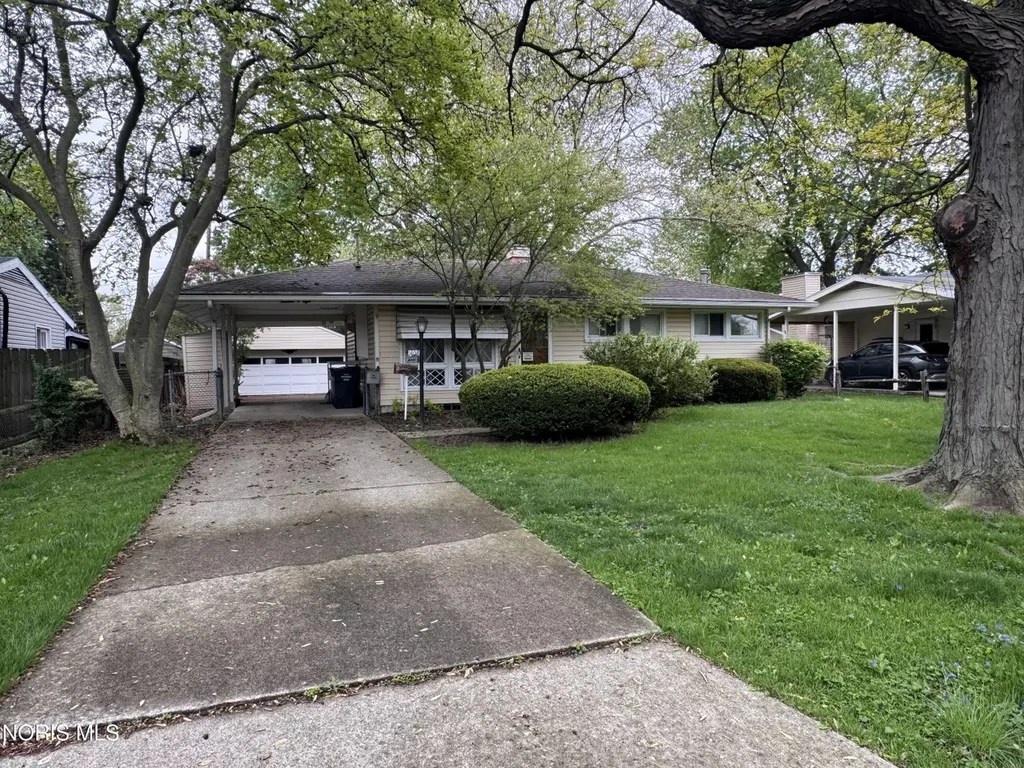
1408 Bradshaw Ct · Maumee, OH
Flood risk 1/10 · Minimal
- FEMA flood zone
- X (unshaded)
- Chance of flooding over 30 yrs
- 0.0%
- Est. flood insurance / yr
- $473 – $860
Fire risk 1/10 · Minimal
- Est. fire insurance / yr
- $713 – $1,323
Heat risk 3/10 · Minor
- Hot days now (above 99°F)
- 7 days/yr
- Hot days in 30 yrs
- 16 days/yr
Wind risk 2/10 · Minimal
- Chance of severe wind over 30 yrs
- —
Air-quality risk 2/10 · Minimal
- Unhealthy air days now
- 1 days/yr
- Unhealthy air days in 30 yrs
- 2 days/yr
Risk factors via First Street. Map © Google.
Why this score? — see what drove the B+ grade
The composite is a weighted blend of 9 inputs, each scored 0–100. Each bar is that input's sub-score; the figure is the points it added to the 100-point composite (weight × sub-score).
- Cash flow +27.9/30.0
- ARV discount +15.0/15.0
- DSCR +9.9/10.0
- 1% rule +8.7/10.0
- Schools +5.6/10.0
- Livability +3.8/5.0
- Rent growth +2.5/5.0
- Condition / age +2.5/5.0
- Appreciation +0.0/10.0
$100,000
🖨 Deal sheet 📄 Offer letter ✓ Due diligence
Listing remarks
Charming 3-bedroom ranch in the heart of Maumee! Ideally located on a quiet street within walking distance to schools, parks, shopping, and restaurants. This home offers great potential with a great layout, large fenced-in yard, and a 2-car detached garage—perfect for storage or workshop space. While the home does need updates, it presents an excellent opportunity for investors, flippers, or buyers looking to add their personal touch. Minimum Bid Auction of $100,000 on May 28th at 4 PM. Preview and registration will begin at 3 PM. Don't miss your chance to invest in a desirable location with strong upside potential!
Key facts
- Fenced-in yard
- Detached garage
- 7,800 sq ft lot
Tags
Property features AI
Exterior
- Parking: Detached 2-car garage; Driveway parking
- Utilities: Electricity connected; Natural gas connected; Public water; Public sewer
- Home design: Single Family Residence (house); One level / 1 story; Not attached; no common walls
- Construction: Vinyl siding; Block foundation
- Exterior features: Shingle roof; Chain link fence
Interior
- Kitchen: Gas range; Refrigerator
- Bedrooms: Primary bedroom on main level (approx. 9 x 8); Bedroom 2 on main level (approx. 10 x 8); Bedroom 3 on main level (approx. 8 x 8)
- Flooring: Carpet; Hardwood
- Bathrooms: 1 full bathroom
- Heating & cooling: Forced air heating (natural gas); Central air conditioning
- Interior features: 5 total rooms; Other interior features
- Laundry & utility: Laundry located in basement
Neighborhood map
What this means for you Summary
Snapshot
- This is a 3-bed/1.0-bath single-family listed at $100k.
Deal economics
- At list price, monthly cash flow is $310 ($4k/yr) — positive.
- The deal already cash-flows at list — no discount required.
- Meets the 1% rule at list price ($1k rent vs $100k).
- Recommended offer: $97k (3.0% below list) — sets the bar for market timing.
- Cap rate 10.0% vs local median 2.8% in Maumee — top-decile yield for the area; either an underpriced asset or a hidden risk that comps aren't pricing in. Stress-test before assuming the spread holds.
Location & tenants
- Location reads 76/100 on livability (#221 in OH, #3,442 nationally) — a middle-class / working-renter tenant base. Strengths: cost of living A+, housing A+, employment A-; Watch: amenities F, commute F, health & safety F.
- Maumee City (suburban): math 65% / reading 67% proficiency, ranked #194 of 656 in OH (top 30%) — acceptable for families but not a draw, mixed tenant base, ~2y average lease.
- Zoned schools: Fairfield Elementary School (math 82% / reading 82%, grade A+, #116 of 1,584 statewide, top 9%, 345 students, 32% FRL); Maumee High School (math 67% / reading 76%, grade B+, #98 of 781 statewide, top 13%, 648 students, 26% FRL) — zoned schools at 29% FRL track the district average.
- Market conditions: 113 active listings in the ZIP; 11 comparable units currently listed for rent nearby; rentals at typical pace (median 14d on market — plan ~3-4 weeks tenant-placement turnaround); solid renter incomes; 415 units permitted in Lucas County in 2024 (122 in 5+ unit buildings).
Forward outlook
- Local home prices are declining (-3.0%/yr); year-one equity from $691 of loan paydown is wiped out by about $3k of value loss. Plan a longer hold.
- Lucas County population projected at -16% by 2050 — secular population decline; favor cash flow + early exit over multi-decade hold.
- At projected returns (-3.0% appreciation + 3.0% rent growth), your $28k cash investment doubles in ~9 years — after that, you're playing with house money.
Negotiation context
- It's been on market 42 days — a 3% lower offer ($97k) is reasonable based on typical stale-listing flexibility.
Risks & watch-outs
- Watch-outs: built in 1957 — expect roof / HVAC / electrical / plumbing capex.
Questions for the listing agent
- It's been on market 42 days. Have you received any prior offers? Is the seller open to a 3% concession, seller financing, or rate buy-down credit?
- Built in 1957 — when were the roof, HVAC, electrical panel, plumbing, and water heater last replaced?
- Is there a deadline driving the sale (1031 exchange, divorce, estate, relocation)? That informs how much negotiation room exists.
- Schools are A-rated — typically a magnet for longer-tenancy family renters. What's the average tenant stay here, and is there a school-zone premium baked into asking?
- What's the average days-on-market for RENTAL listings here right now (not sales)? A rising rental-DOM trend means longer vacancies and softer asking-rent achievability than the comps imply.
- What's the recent tenant-quality profile in this submarket — average credit score on applications, eviction rate, late-payment / NSF rate, and stable-employment percentage? A property-management company in the area should have these aggregated.
- How much new for-sale + rental construction is in the pipeline within 1–3 miles? Heavy new supply typically softens prices + rents 12–24 months out; constrained supply supports both.
Investment metrics
- 1% rule
- 1.37% ✓
- Cap rate
- 10.01%
- Cash-on-cash
- 13.27%
- DSCR
- 1.59
- GRM
- 6.1
CMA / ARV
- ARV (median comp)
- $197,707
- List price
- $100,000
- Delta
- -49.42%
- Verdict
- UNDERPRICED
- Comps
- 20 within 1.0 mi
Show comp detail 12 sales within ~0.75 mi
| Address | Dist | Beds/Ba | Sqft | Sold | Price | $/sf | Match |
|---|---|---|---|---|---|---|---|
| 1253 Holgate Ave | 0.40mi | 3/1.5 | 960 (+4%) | 1mo | $193,500 | $202 | 72 |
| 4501 Thackeray Rd | 0.34mi | 3/1.0 | 960 (+4%) | 7mo | $100,000 | $104 | 72 |
| 4459 Thackeray Rd | 0.34mi | 3/1.0 | 960 (+4%) | 9mo | $168,500 | $176 | 70 |
| 1234 Shelly Ave | 0.42mi | 3/1.0 | 960 (+4%) | 8mo | $183,000 | $191 | 67 |
| 1242 Holgate Ave | 0.43mi | 2/1.0 (-1) | 925 (0%) | 10mo | $165,000 | $178 | 66 |
| 649 Midfield Dr | 0.15mi | 3/1.0 | 1,053 (+14%) | 6mo | $195,000 | $185 | 65 |
| 1381 Junior Dr | 0.60mi | 3/2.0 | 912 (-1%) | 6mo | $214,000 | $235 | 60 |
| 1371 Junior Dr | 0.58mi | 3/1.0 | 1,010 (+9%) | 2mo | $206,000 | $204 | 56 |
| 1736 N Parkway Dr | 0.68mi | 3/1.0 | 962 (+4%) | 8mo | $190,000 | $198 | 55 |
| 1313 Birch Ave | 0.68mi | 3/1.0 | 999 (+8%) | 3mo | $247,000 | $247 | 52 |
| 564 Southfield Dr | 0.46mi | 3/1.0 | 1,033 (+12%) | 9mo | $192,500 | $186 | 51 |
| 1733 N Parkway Dr | 0.69mi | 3/1.0 | 1,028 (+11%) | 8mo | $190,000 | $185 | 42 |
Match score weights: distance 35% · size 25% · config 20% · recency 20%. Top-matched comps best support the ARV.
Projected returns pro-forma
-3.0% appreciation · 3.0% rent growth · sell at horizon
- IRR
- 3.3%
- Equity multiple
- 1.13×
- Total profit
- $3,580
- Equity at exit
- $14,910
- IRR
- 12.9%
- Equity multiple
- 2.03×
- Total profit
- $28,790
- Equity at exit
- $8,646
Cash invested: $28,000 (down + closing). Projections, not guarantees.
Landlord ↔ Tenant lean methodology
- Overall (STATE)
- 73 Landlord-Friendly
- State Ohio
- 73 Landlord-Friendly · R+6
- County
- — inherits STATE
- City
- — inherits STATE
ZIP-level market 43537
- Home prices YoY
- -29.6%
- Active inventory
- 113
- Price-to-rent
- 6.1×
Monthly cashflow live
- Estimated rent
- $1,370 high interval (Pro) →
- Mortgage (P&I)
- −$524
- Tax from tax record
- −$207 /mo · $2,483/yr
- Insurance
- −$42
- HOA
- −$0
- Vacancy / Maint / Mgmt
- −$288
- Net cashflow
- $310
Break-even live
UW: 25.0% down · 7.5% · 30yr · 1.5% tax · 5.0% vac · 8.0% maint · 8.0% mgmt
Financing live
Cash to close
- Down payment
- $25,000
- Closing costs
- $3,000
- Reserves months
- —
- Total cash needed
- —
Loan-product check · same deal, 3 products live
Conventional
25% down · 7.5% · 30yr
- Down + closing
- —
- Monthly P&I
- —
- Monthly cashflow
- —
- DSCR
- —
- Eligible?
- —
Personal DTI + credit; lowest rate.
DSCR
20% down · 8.5% · 30yr
- Down + closing
- —
- Monthly P&I
- —
- Monthly cashflow
- —
- DSCR
- —
- Eligible?
- —
No personal income docs; deal must DSCR.
Hard money
10% down · 12.0% · 12mo
- Down + closing
- —
- Monthly P&I
- —
- Monthly cashflow
- —
- DSCR
- —
- Eligible?
- —
Short-term bridge; refi at stabilization.
Rent comps 11 comps
| Address | Beds | Baths | Sqft | Rent | $/sqft | DOM | Units | Dist |
|---|---|---|---|---|---|---|---|---|
| 1372 Picadilly Ln Maumee, OH | 2.0 | 1.0 | 626 | $906 | $1.45 | 12d | 1 | 0.68mi |
| 1436 Picadilly Ln Maumee, OH | 1.0–2.0 | 1.0 | 849 | $899 | $1.06 | 3d | 2 | 0.70mi |
| 2647 Eastgate Rd Toledo, OH | 1.0–2.0 | 1.0 | 722 | $1,209 | $1.67 | 23d | 1 | 0.73mi |
| 1371 Picadilly Ln Maumee, OH | 2.0 | 1.0 | 965 | $1,344 | $1.39 | 12d | 1 | 0.74mi |
| 4874 S Village Dr Toledo, OH | 1.0–2.0 | 1.0 | 900 | $1,120 | $1.24 | 14d | 1 | 0.93mi |
| 1106 Hugo St Maumee, OH | 3.0 | 1.0 | 1006 | $1,595 | $1.59 | 43d | 1 | 0.93mi |
| 4835 Heatherdowns Blvd Toledo, OH | 1.0–2.0 | 1.0–1.5 | 845 | $965 | $1.14 | 14d | 1 | 0.97mi |
| 2342 Old Stone Ct Toledo, OH | 1.0–2.0 | 1.0–2.0 | 881 | $995 | $1.13 | 14d | 1 | 1.33mi |
| 2425 Cheyenne Blvd Toledo, OH | 2.0–3.0 | 1.0–2.0 | 1055 | $1,369 | $1.30 | 7d | 1 | 1.46mi |
| 2223 Foxbourne Rd Toledo, OH | 2.0 | 1.0 | 887 | $885 | $1.00 | 21d | 2 | 1.48mi |
| 5420 Heatherdowns Blvd Toledo, OH | 1.0–2.0 | 1.0–2.0 | 1050 | $1,295 | $1.23 | 12d | 1 | 1.49mi |
Listing history 11 events
-
2026-06-14status $100,000 Pending 42 DOM
-
2026-06-10days on market $100,000 Active 42 DOM
-
2026-06-09days on market $100,000 Active 41 DOM
-
2026-06-08days on market $100,000 Active 40 DOM
-
2026-06-07days on market $100,000 Active 39 DOM
-
2026-06-03days on market $100,000 Active 35 DOM
-
2026-06-02days on market $100,000 Active 34 DOM
-
2026-06-01days on market $100,000 Active 33 DOM
-
2026-05-31days on market $100,000 Active 32 DOM
-
2026-05-30days on market $100,000 Active 31 DOM
-
2026-04-27$100,000 Active 629-char remark
ⓘ Source: listings_history table (triggers on properties + properties_extension) + one-shot
backfill from property_details.listing_events for pre-trigger history.
Tax reassessment forecast OH · Partial reset (capped growth)
- Current annual tax
- $2,483 · $207/mo
- Projected year-2 tax
- $2,483 · $207/mo
- Expected delta
- $0/yr ($0/mo · 0.0%)
ⓘ Screening estimate from a state-policy table — verify with the county assessor before closing.
Climate risk First Street
- Flood 1/10 Low FEMA zone X (unshaded) · 0% chance over 30 yrs
- Wildfire 1/10 Low
- Heat 3/10 Moderate 7 d/yr ≥99°F today · 16 d/yr by 30 yrs out
- Wind 2/10 Low
- Air quality 2/10 Low 1 unhealthy d/yr today · 2 by 30 yrs out
Nearby sold comps map
Loading sold comps map…
Walkable amenities ~0.75 mi
Loading nearby amenities…
Taxation est. · year 1
- Rental income
- $16,443
- − Mortgage interest
- −$5,602
- − Property taxes
- −$2,483
- − Insurance
- −$500
- − Repairs & maintenance
- −$1,315
- − Management
- −$1,315
- − Depreciation
- −$2,909
- Taxable income
- $2,319
- Est. tax owed @ 24.0%
- −$556
- After-tax cash flow
- $3,158/yr
For passive investors: Depreciation is non-cash, so a rental often shows a tax loss while cash-flowing — sheltering income. Rental losses are passive: they offset passive income freely, and up to $25,000/yr can offset ordinary (W-2) income if you actively participate and your MAGI is under $100k (phasing out to $0 by $150k); unused losses carry forward. On sale, claimed depreciation is recaptured at up to 25%, and gains may owe capital-gains tax (a 1031 exchange can defer both). Figures are a year-1 estimate at your 24.0% rate — not tax advice; consult a CPA.
Schools (NCES district)
- District
- Maumee City
- NCES district ID
- 3904436
- Math proficiency
- 65% ▼ -10.00%
- Reading proficiency
- 67% ▼ -7.00%
- Median HH income
- $53,412
- Composite
- 56.38/100
- National rank
- #1162
- State rank
- #194 of 656 in OH
Livability — Maumee
- Score
- 76/100
- State rank
- #221
- US rank
- #3442
Category grades
Schools grade is shown separately in the Schools card above.
Census & demographics
- Census place
- Maumee, OH
- County
- Lucas County · 380,724 people
- City population
- 30,111
- Metro
- Toledo, OH
- Population (ZIP)
- 30,111
- Household income
- $82,752
- Rent vs Own
- Severe rent burden
- 592.0
Population outlook (Lucas County) Hauer SSP2
- Today (2025)
- 420,751 people
- By 2030
- 410,187 · -2.5%
- By 2040
- 384,019 · -8.7%
- By 2050
- 355,125 · -15.6%
- By 2075
- 291,683 · -30.7%
- By 2100
- 233,670 · -44.5%
Race, ethnicity, and origin ACS 2023
- Neighborhood character
- Predominantly White (83%)
- Race & ethnicity
- White 83% Hispanic / Latino 6% Black 6% Two or more races 6% Asian 1%
- Hispanic origin (detail)
- Mexican 4%
- Common ancestry
- Romanian 9% Lithuanian 4% Slovak 2%
- Foreign-born
- 3% · Canada
- Languages at home
- 95% English-only · Spanish 2% Other Indo-European 1% German/W. Germanic 1%
Political lean MEDSL · Lucas
- 2024 margin
- D (+12.6) · D 55.8% · R 43.2%
- 2008→2024 swing
- -18.9pp toward R · 2008: 31.4pp · 2024: 12.6pp
- All cycles
- 2024: D+12.6 2020: D+16.8 2016: D+17.4 2012: D+30.4 2008: D+31.4
Not yet ingested
- Civics
- —
Market trends
- HPI YoY
- ▼ -85.67%
- Current HPI
- 203.8449
- Rent YoY
- —
- Metro
- Toledo, OH
- State GDP YoY
- ▲ 1.98%
- F500 in state
- 48
Industry mix (Fortune 500 HQ in OH)
| Industry | F500 HQs | Revenue |
|---|---|---|
| Insurance | 3 | $145B |
|
||
| Industrial Machinery | 3 | $49B |
|
||
| Financial Services | 3 | $24B |
|
||
| Consumer Goods | 2 | $93B |
|
||
| Aerospace / Defense | 2 | $47B |
|
||
| Utilities | 2 | $33B |
|
||
Price history
2 events — show timeline
- 2026-06-10 Pending — NORIS
- 2026-04-27 Listed $100,000 NORIS
Property tax history
+2.7%/yrLatest (2025): $2,483 · +1.6% YoY. Source: county tax records.
Cash-flow waterfall
monthlySold comps — $/sqft
last 12 mo · ≤1 miLoading sold comps…